[[{“value”:”
Below 2022 highs: Austin, San Francisco, Phoenix, San Antonio, Denver, Sacramento, Dallas-Ft. Worth, Portland, Salt Lake, Seattle, Tampa, Raleigh, Houston, Atlanta, Charlotte, Nashville, Las Vegas, Minneapolis, Orlando…
Rose past their 2022 highs (but some are now sagging): Miami, San Diego, Los Angeles, Baltimore, Kansas City, Columbus, Washington D.C., Philadelphia, Boston, Chicago, New York…
By Wolf Richter for WOLF STREET.
Prices of single-family houses, condos, and co-ops in February fell in some of the 33 large Metropolitan Statistical Areas (MSAs) on our list here. And in 21 of these metros, prices are down from the 2022 peaks. In other metros, prices rose. None made new highs in February.
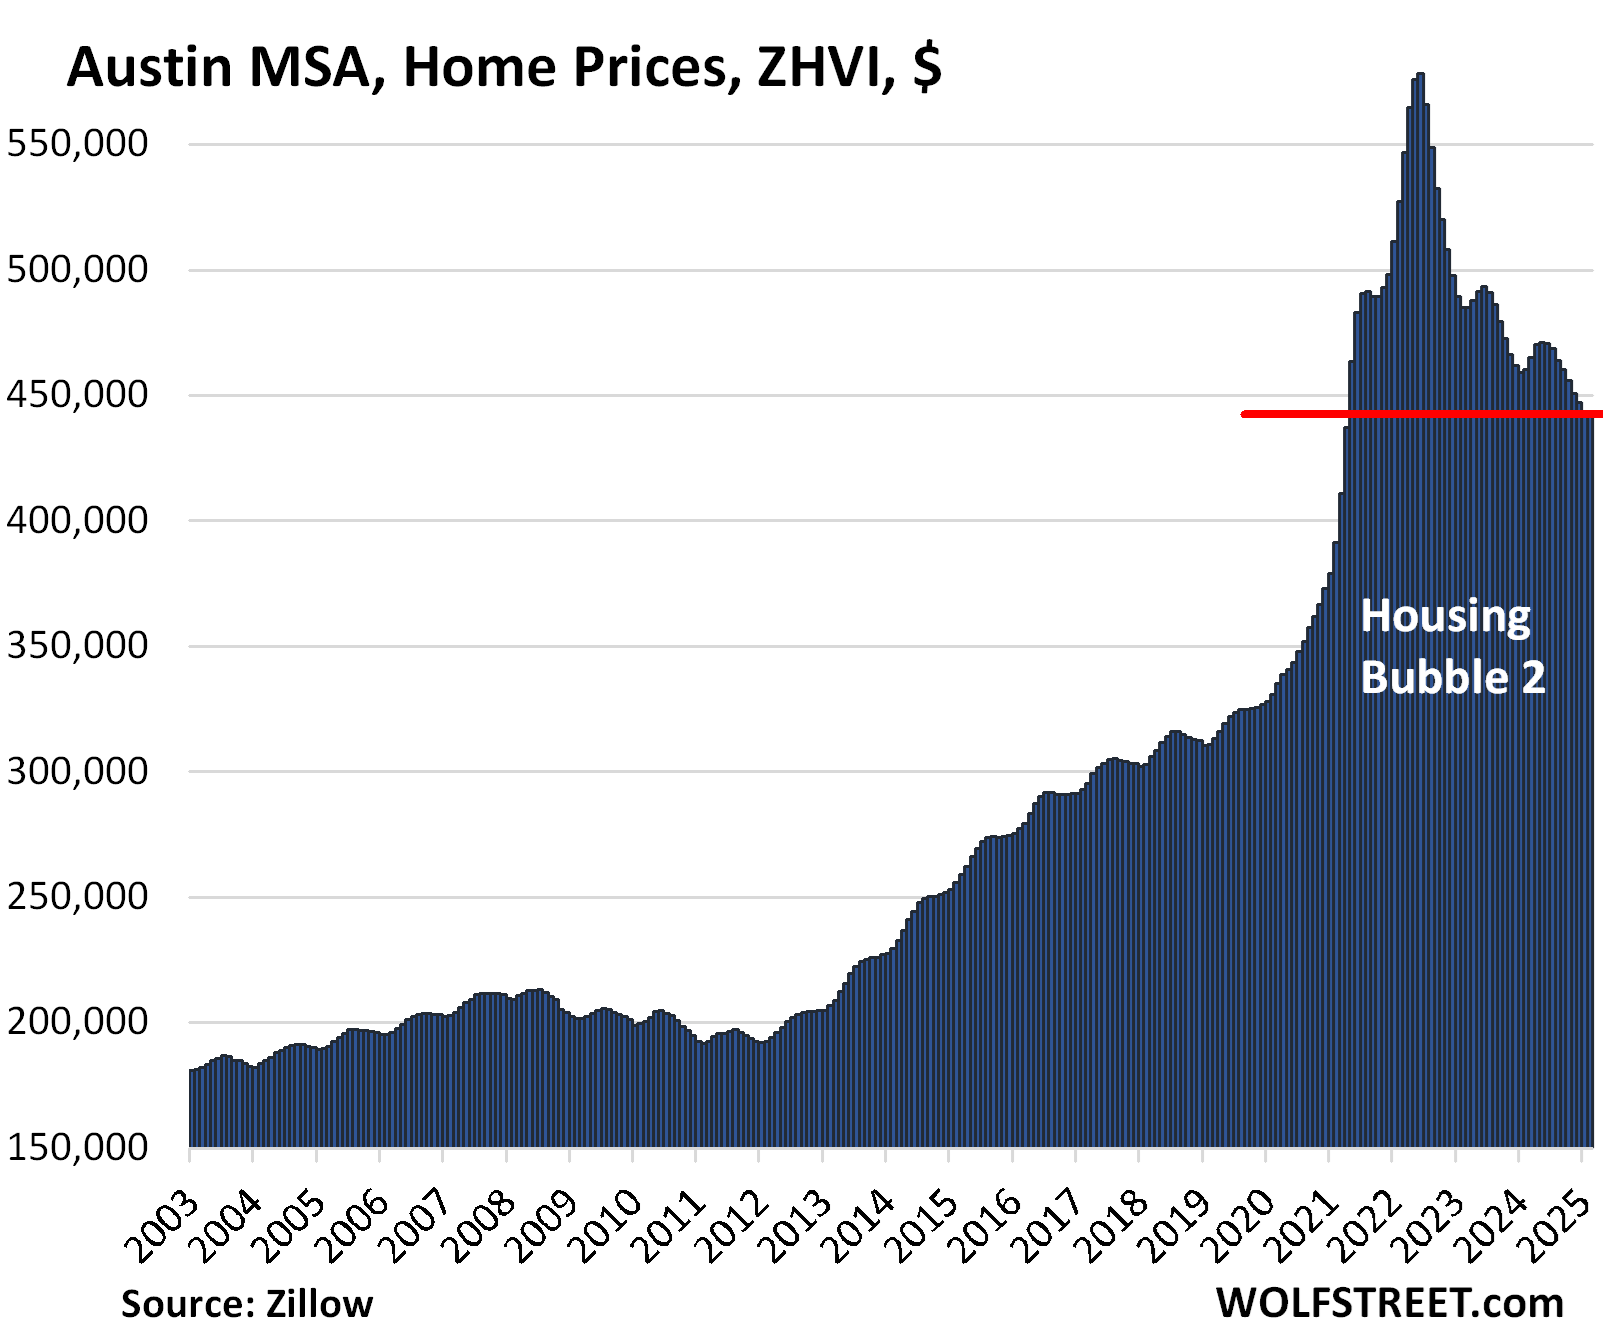
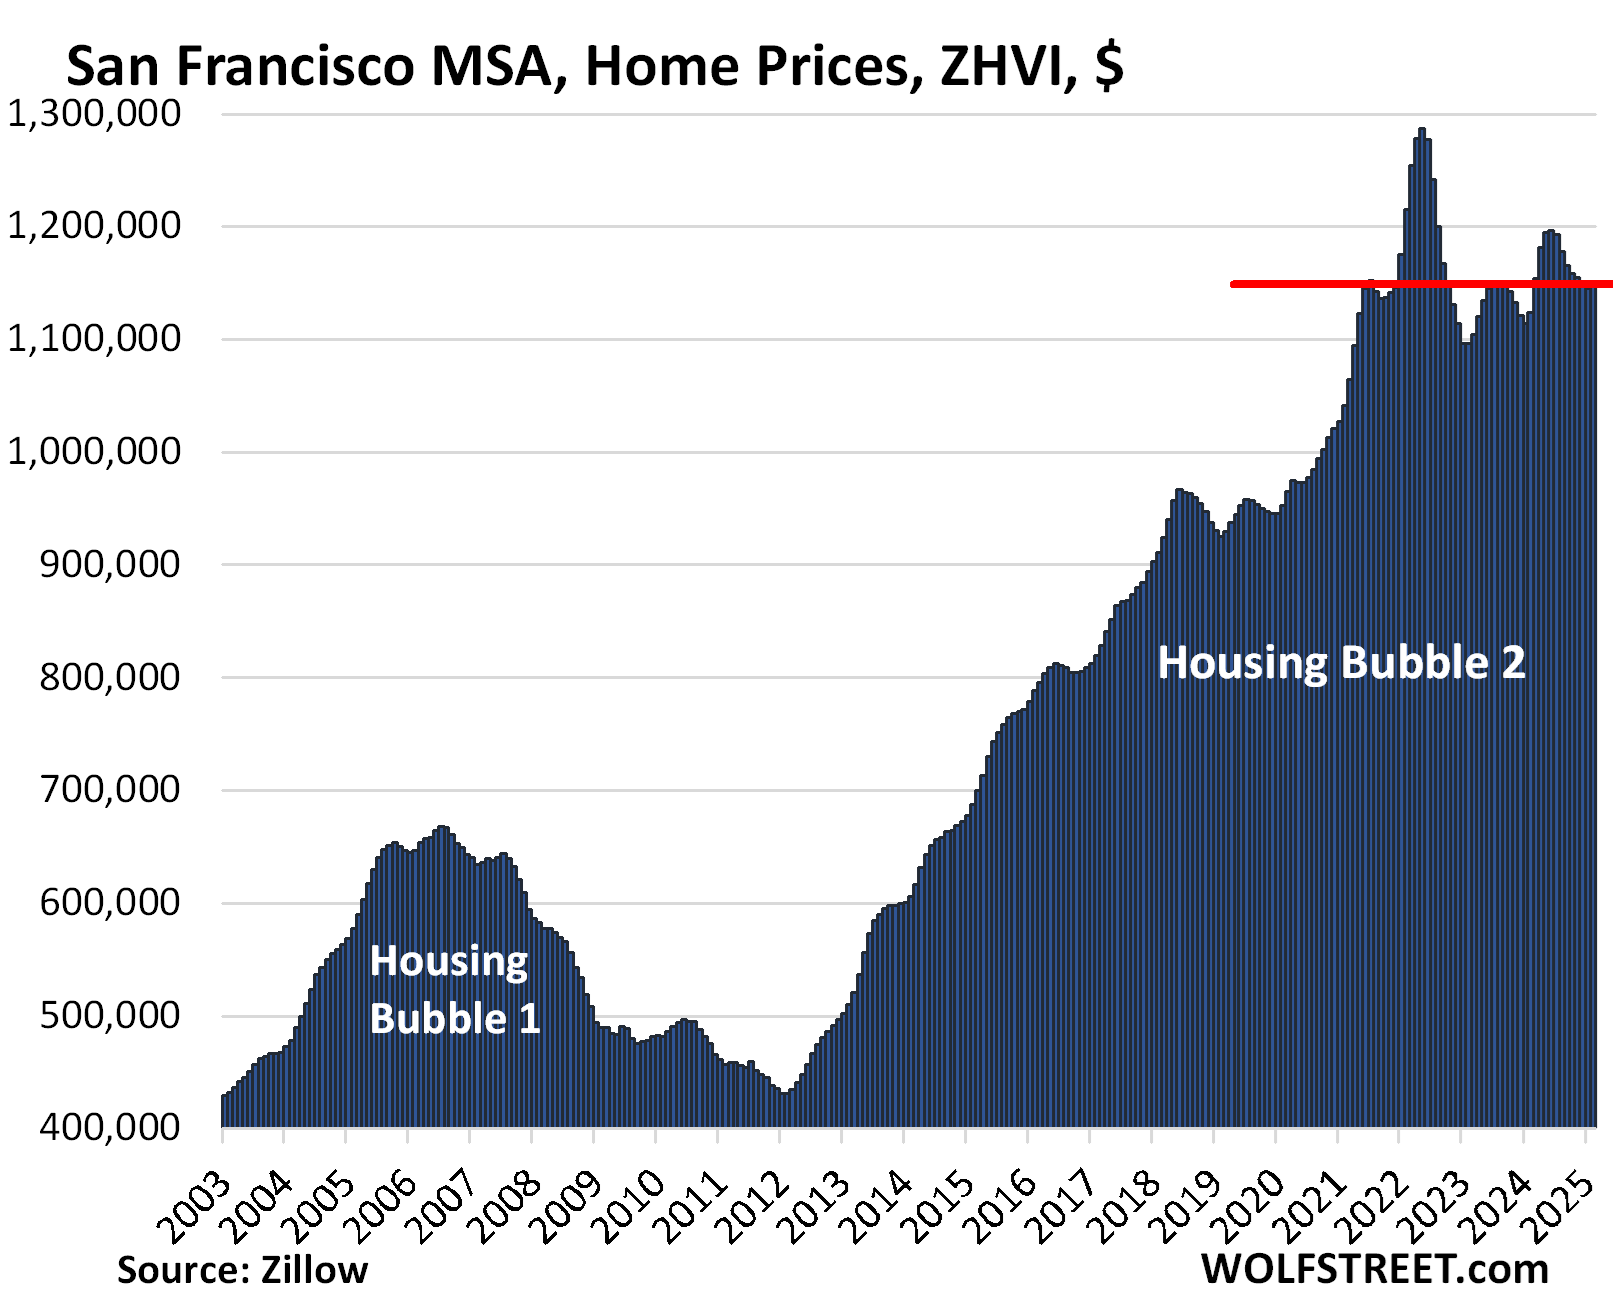
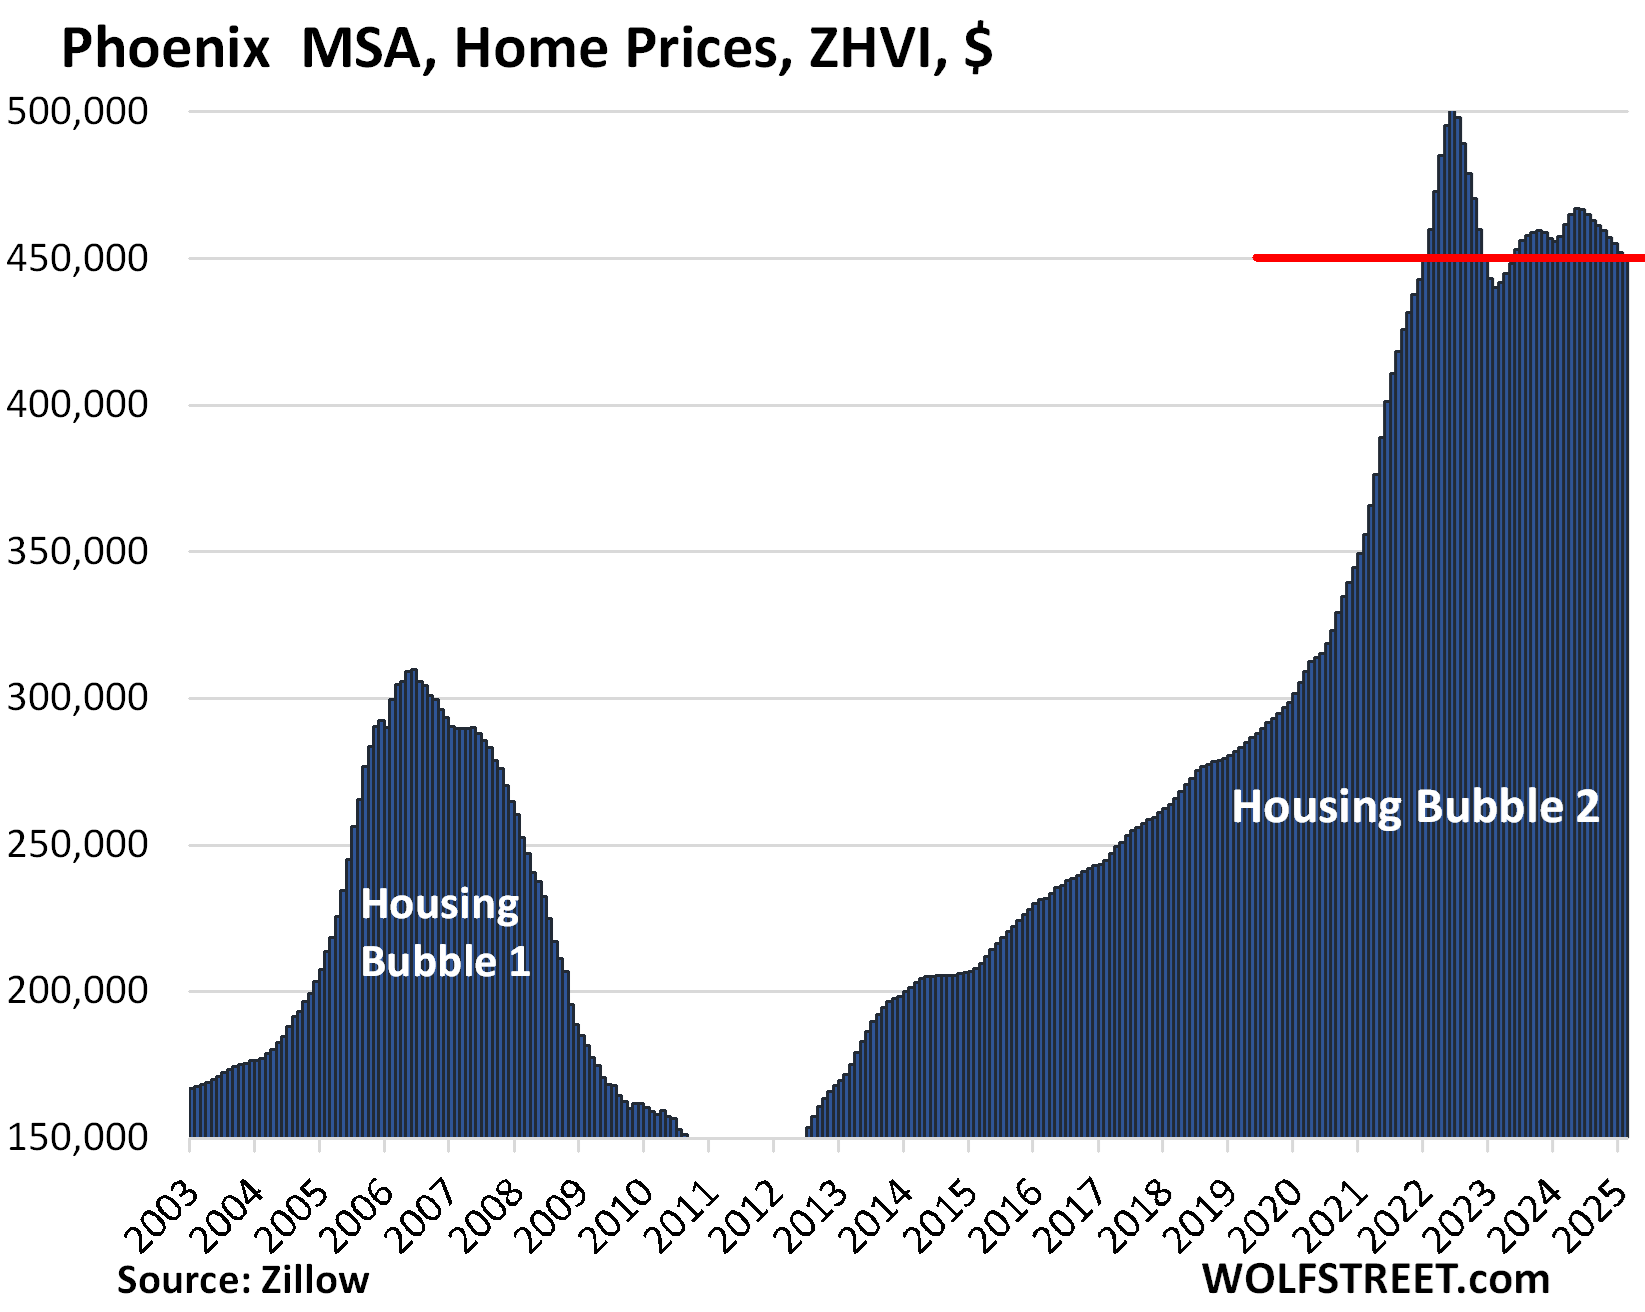
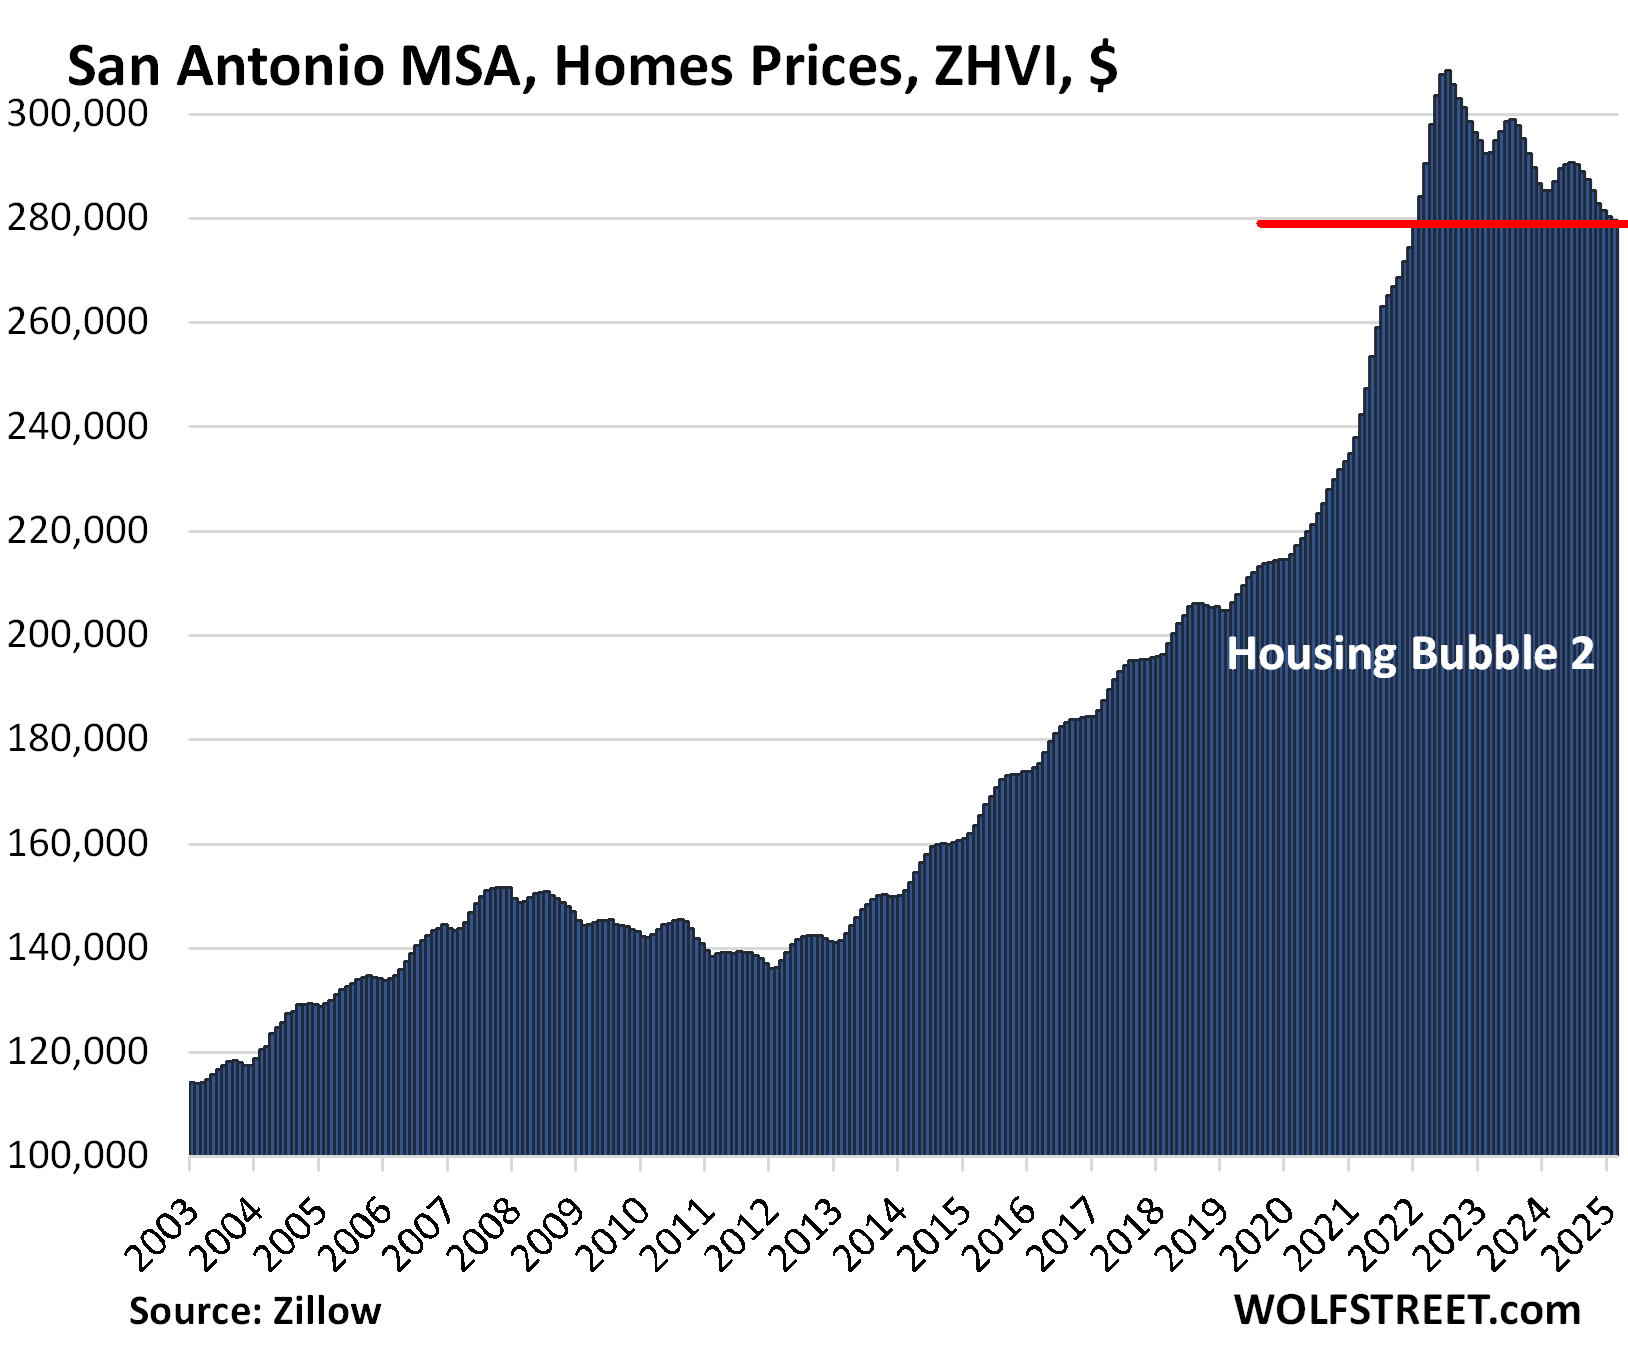
Down from the 2022 peaks: Prices in 21 metros of our 33 metros are down from their 2022 peaks, led by the metros of Austin (-23.4%), San Francisco (-10.6%), Phoenix (-10.1%), San Antonio (-9.4%), and Denver (-8.2%).
Down year-over-year: Prices in 7 metros were down year-over-year, led by Austin (-3.8%), Tampa (-3.6%), San Antonio (-2.0%), Phoenix (-1.6%) … including now Miami (-0.2%). Denver was down just a hair (-0.02%), so essentially unchanged.
No New highs in February 2025: No metro of the 33 metros here made a new highs.
Some technical points. All data is from the “raw” mid-tier Zillow Home Value Index (ZHVI), released Sunday. The ZHVI is based on millions of data points in Zillow’s “Database of All Homes,” including from public records (tax data), MLS, brokerages, local Realtor Associations, real-estate agents, and households across the US. It includes pricing data for off-market deals and for-sale-by-owner deals. Zillow’s Database of All Homes also has sales-pairs data.
In some markets, there is no seasonality to home prices, as you can see in the charts below, which are not-seasonally-adjusted. In other markets, there is distinct seasonality, with annual price peaks occurring at roughly the same month of the year.
To qualify for this list, the MSA must be one of the largest by population, and must have had a ZHVI of at least $300,000 at the peak. The metros of New Orleans, Oklahoma City, Tulsa, Cincinnati, Pittsburgh, etc. don’t qualify for this list because their ZHVI has never reached $300,000, despite the surge of home prices in recent years, but from low levels.
The 21 metros below their highs of mid-2022.
Home prices exploded during the pandemic and through mid-2022 in these markets, driven by the Fed’s interest rate repression, including trillions of dollars of QE at the time, resulting in below-3% mortgages.
But the Fed gradually backed away from interest-rate repression starting in 2022, hiked rates, and has shed $2.2 trillion in assets from its balance sheet. Since September 2022, mortgage rates have been around 7%, give or take some – they’re currently at 6.65%, according to the Mortgage Bankers Association – and these rates were normal before QE started in 2008.
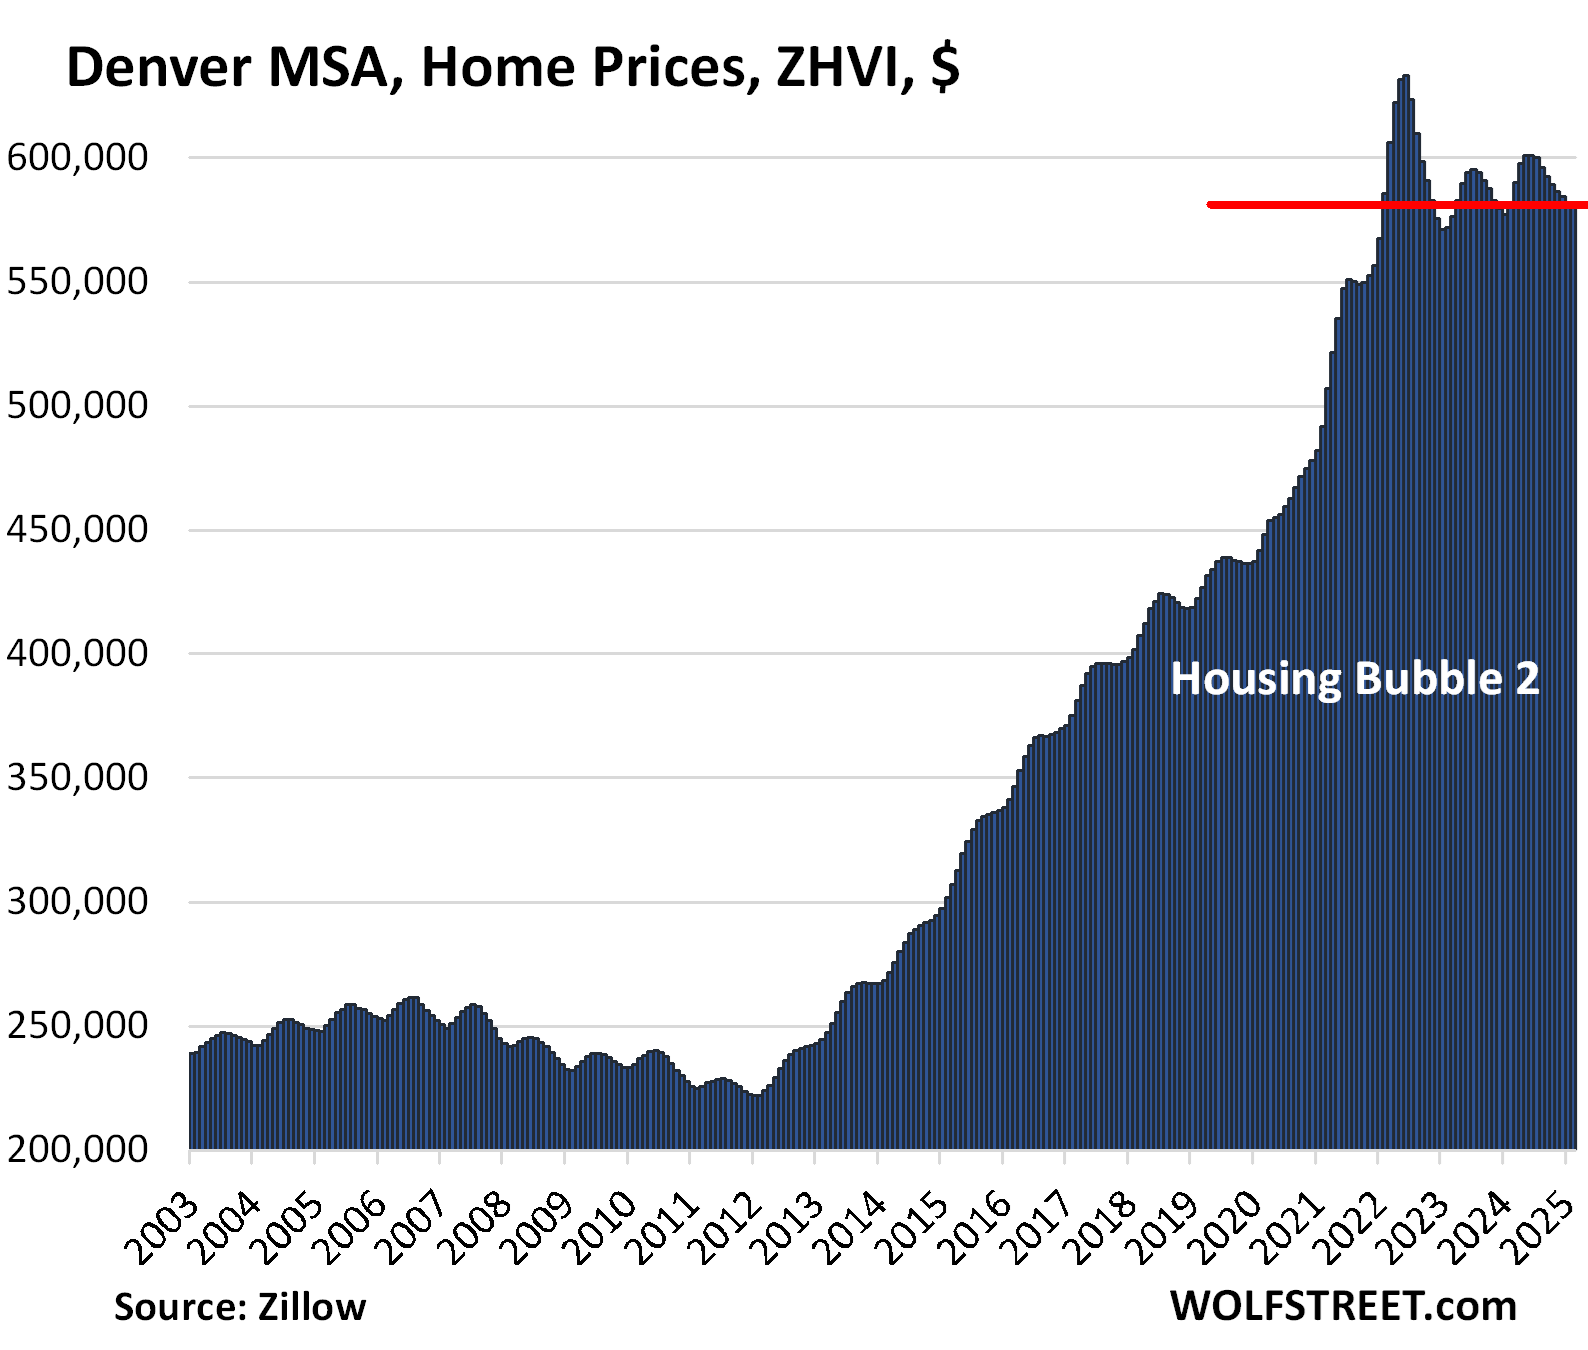
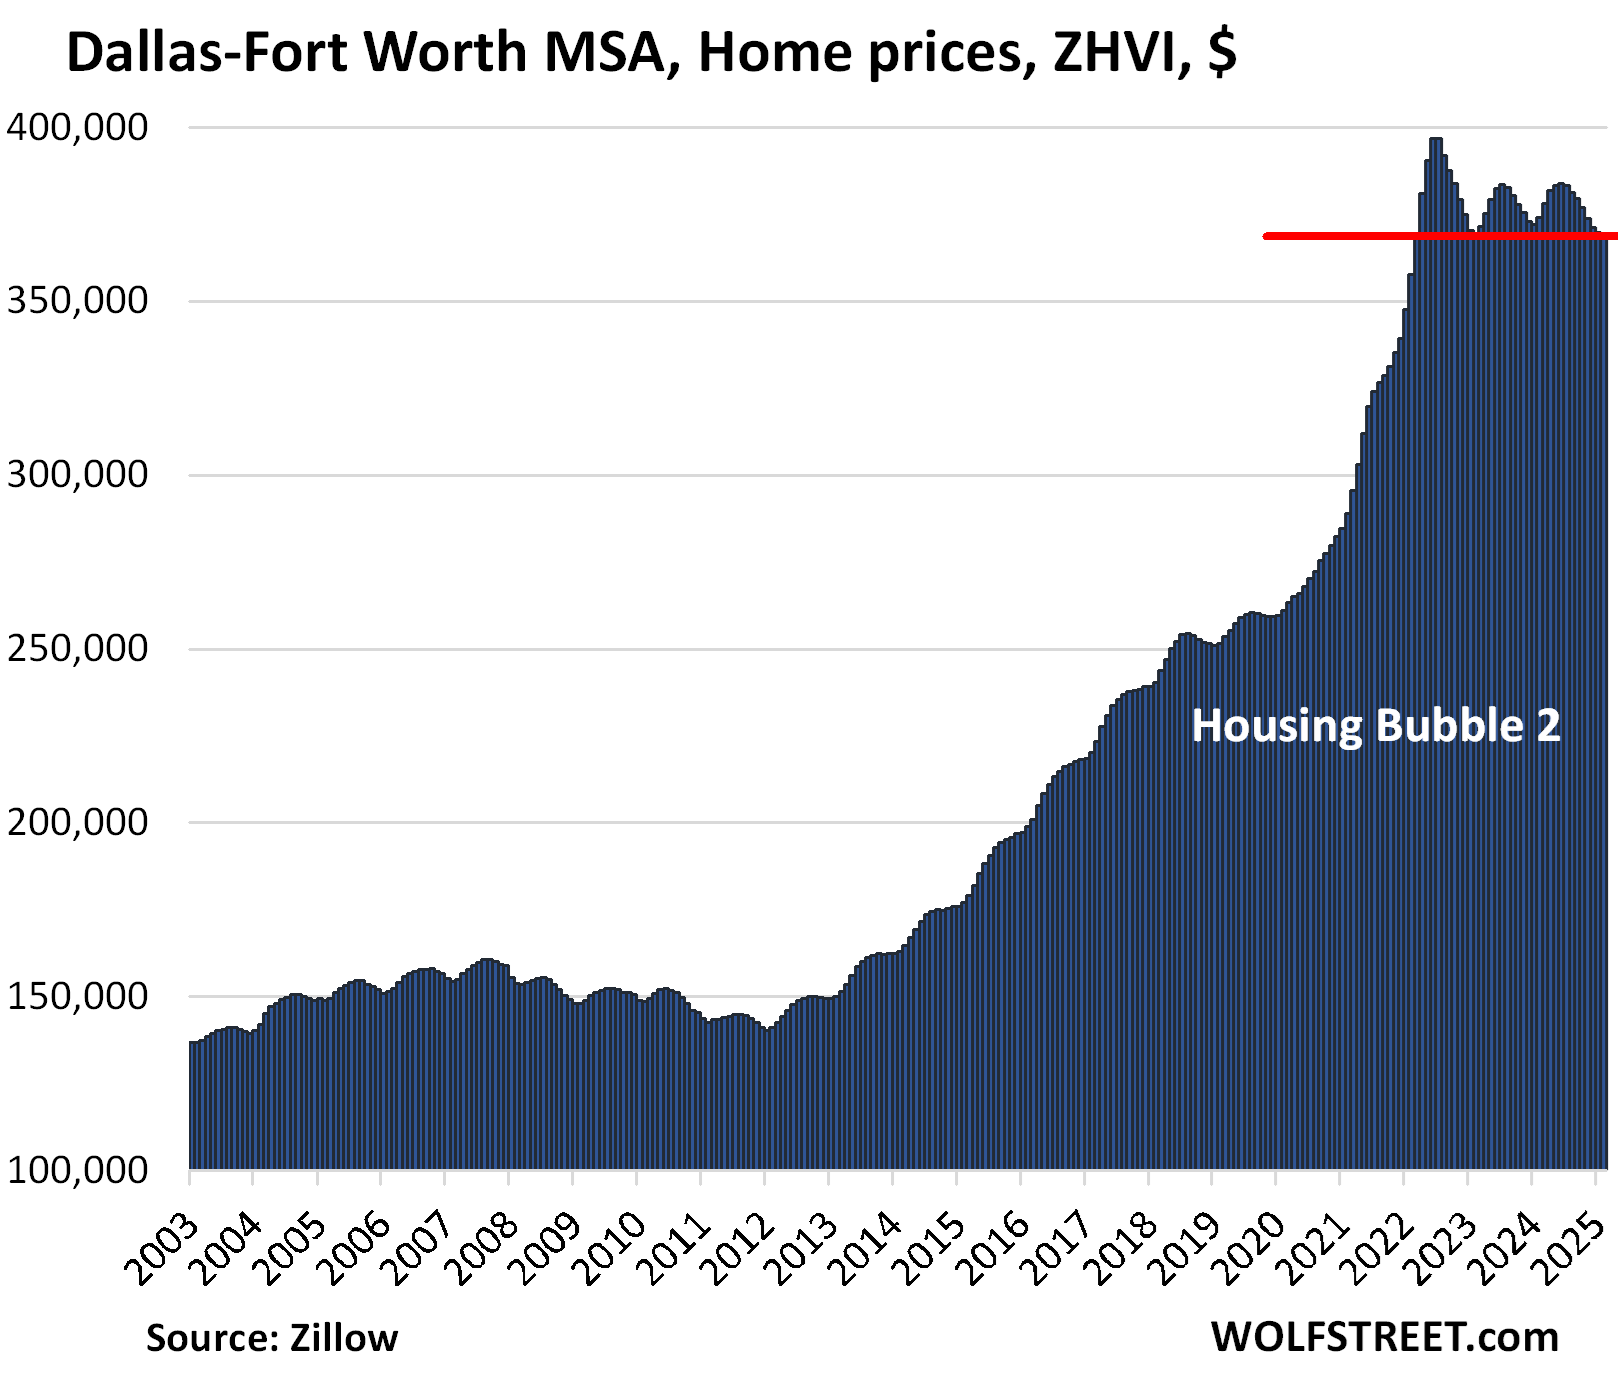
One curious thing visible in the charts – on top of their inherent absurdity – is that the metros in Texas, the Denver metro, and a few other metros didn’t experience Housing Bubble 1 which began to implode in 2006. Texas had finally gotten through with a huge housing bust some years earlier, and it therefore didn’t experience the big price drops in 2006 to 2012, just moderate declines. But its Housing Bubble 2 was a doozie.
| Austin MSA, Home Prices | |||
| From Jun 2022 peak | MoM | YoY | Since 2000 |
| -23.4% | -0.1% | -3.8% | 153% |
The Austin MSA includes the counties of Travis (Austin-Round Rock), Williamson, Hays, Caldwell, and Bastrop.
Prices are back where they’d been in April 2021. No real estate chart should ever look like this absurdity.
| San Francisco MSA, Home Prices | |||
| From May 2022 peak | MoM | YoY | Since 2000 |
| -10.6% | 0.5% | 2.4% | 290% |
The MSA includes San Francisco, Oakland, much of the East Bay, much of the North Bay, and goes south on the Peninsula into Silicon Valley through San Mateo County.
Prices are back where they’d first been in June 2021.
| Phoenix MSA, Home Prices | |||
| From Jun 2022 peak | MoM | YoY | Since 2000 |
| -10.1% | -0.4% | -1.6% | 216% |
Prices are back where they’d first been in January 2022:
| San Antonio MSA, Home Prices | |||
| From Jul 2022 peak | MoM | YoY | Since 2000 |
| -9.4% | -0.3% | -2.0% | 145.6% |
Prices have dropped to the lowest level since January 2022.
| Denver MSA, Home Prices | |||
| From Jun 2022 peak | MoM | YoY | Since 2000 |
| -8.2% | 0.0% | 0.0% | 209% |
Prices are back where they’d first been in February 2022.
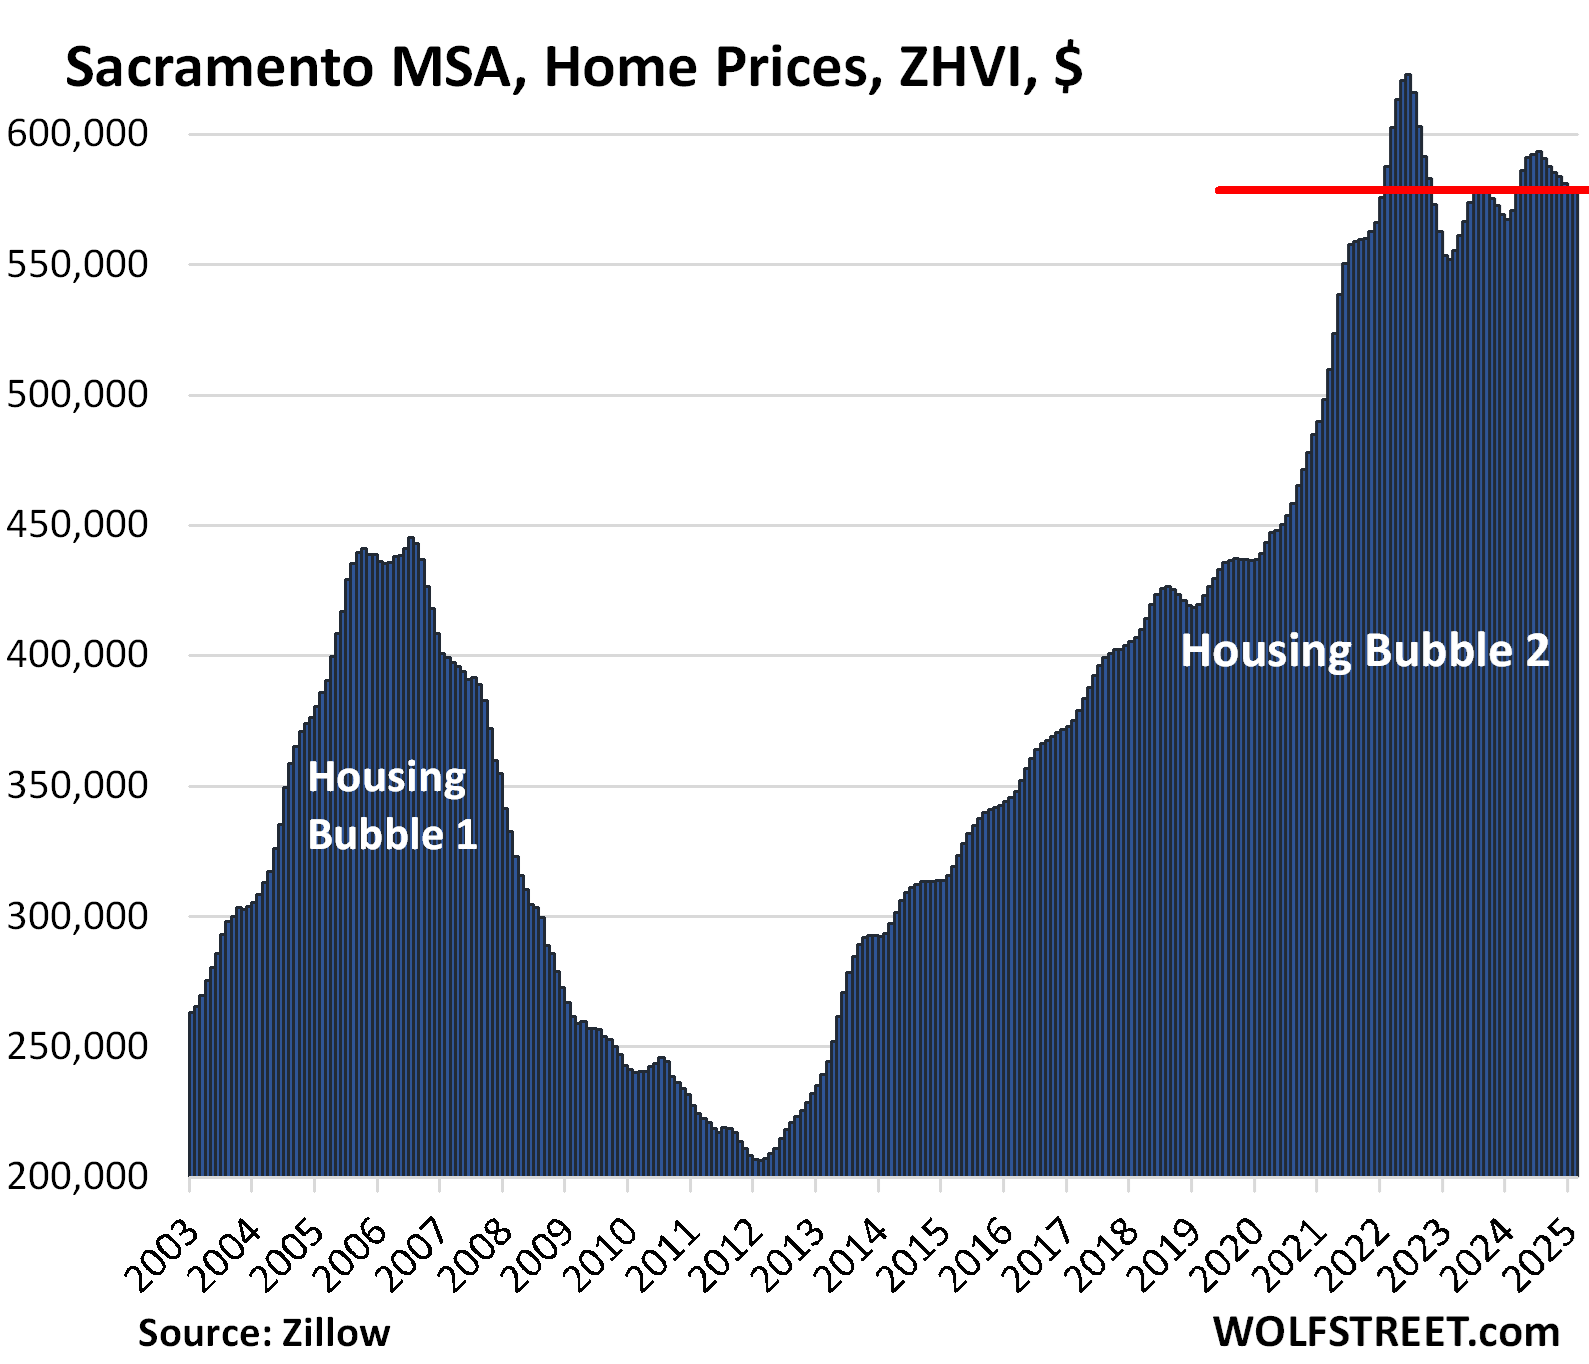
| Sacramento MSA, Home Prices | |||
| From July 2022 peak | MoM | YoY | Since 2000 |
| -7.2% | 0.0% | 1.3% | 243.1% |
| Dallas-Fort Worth MSA, Home Prices | |||
| From Jun 2022 peak | MoM | YoY | Since 2000 |
| -7.1% | -0.2% | -1.4% | 190% |
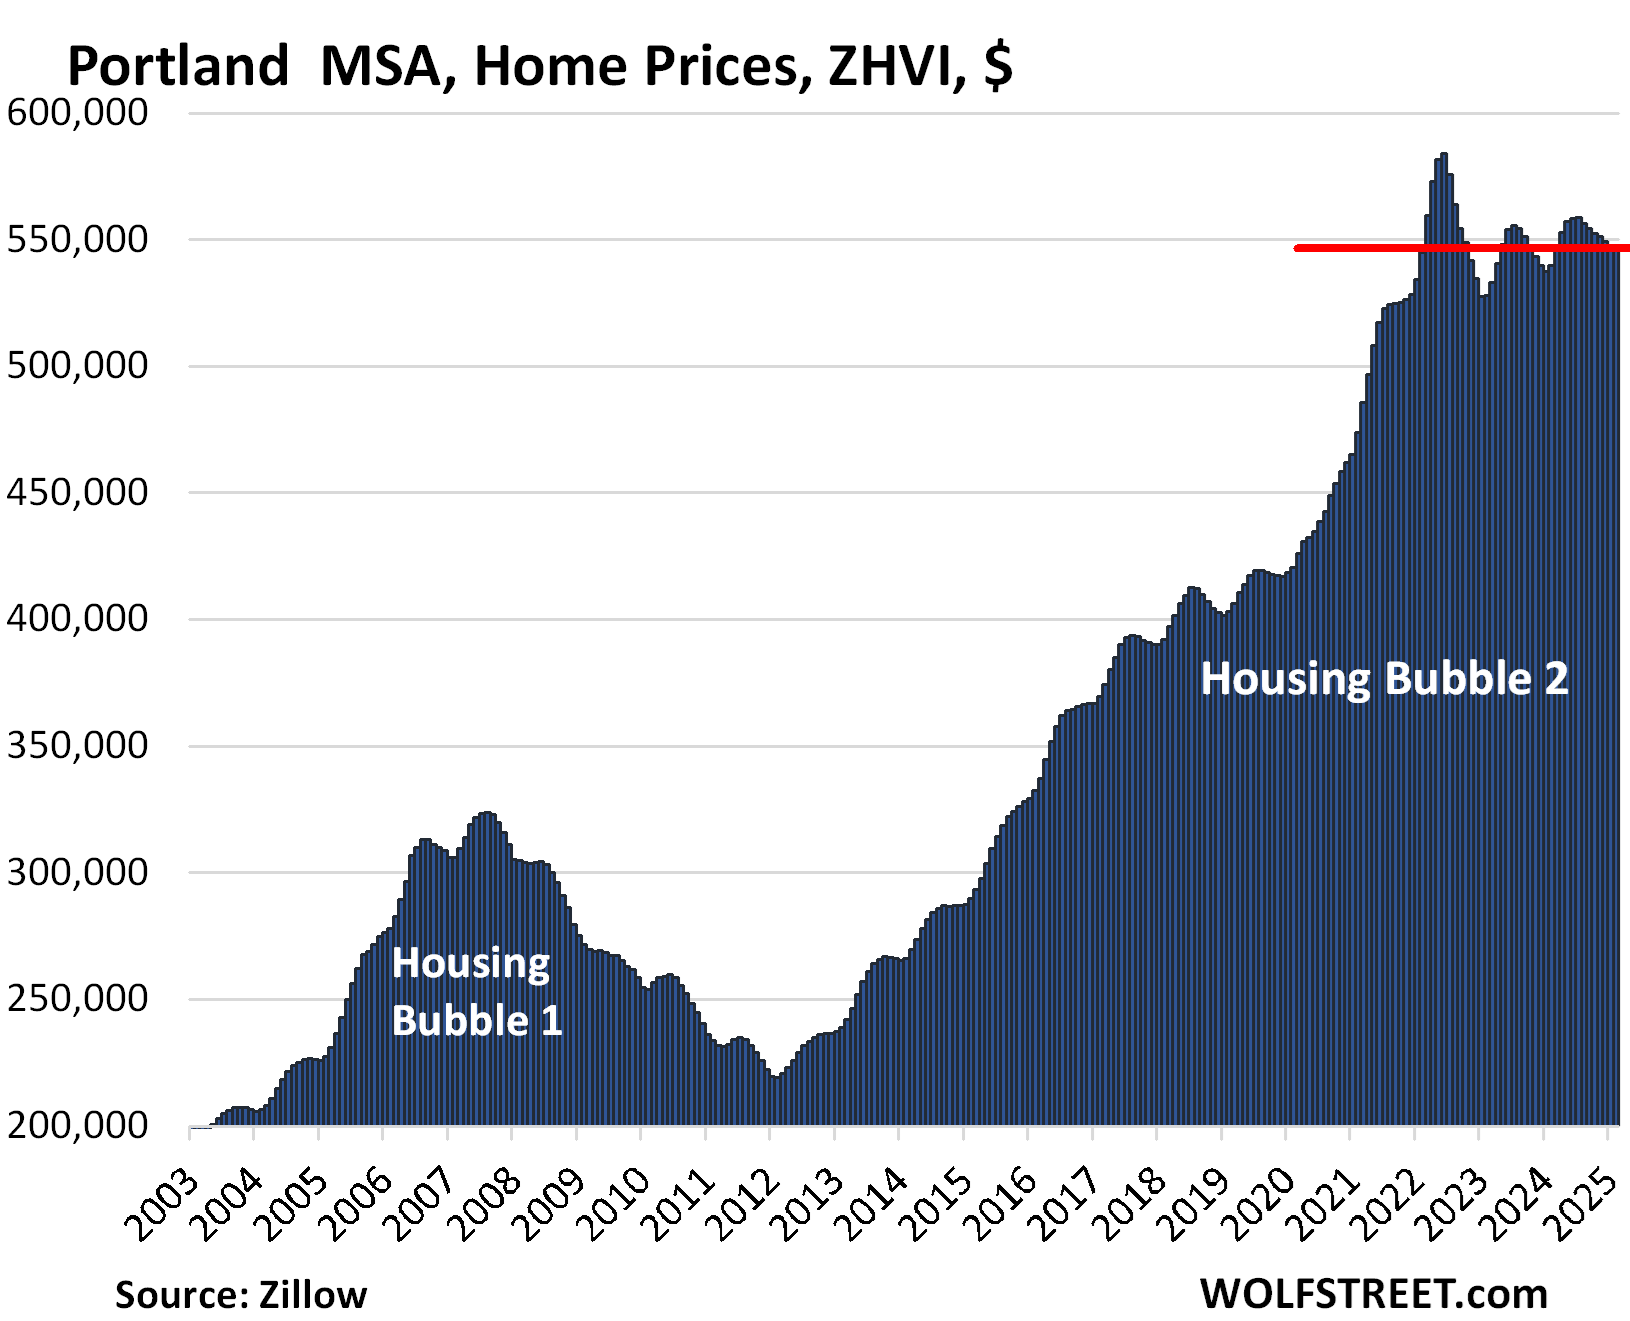
| Portland MSA, Home Prices | |||
| From May 2022 peak | MoM | YoY | Since 2000 |
| -6.3% | 0.1% | 1.3% | 216% |
Prices are back where they’d first been in January 2022.
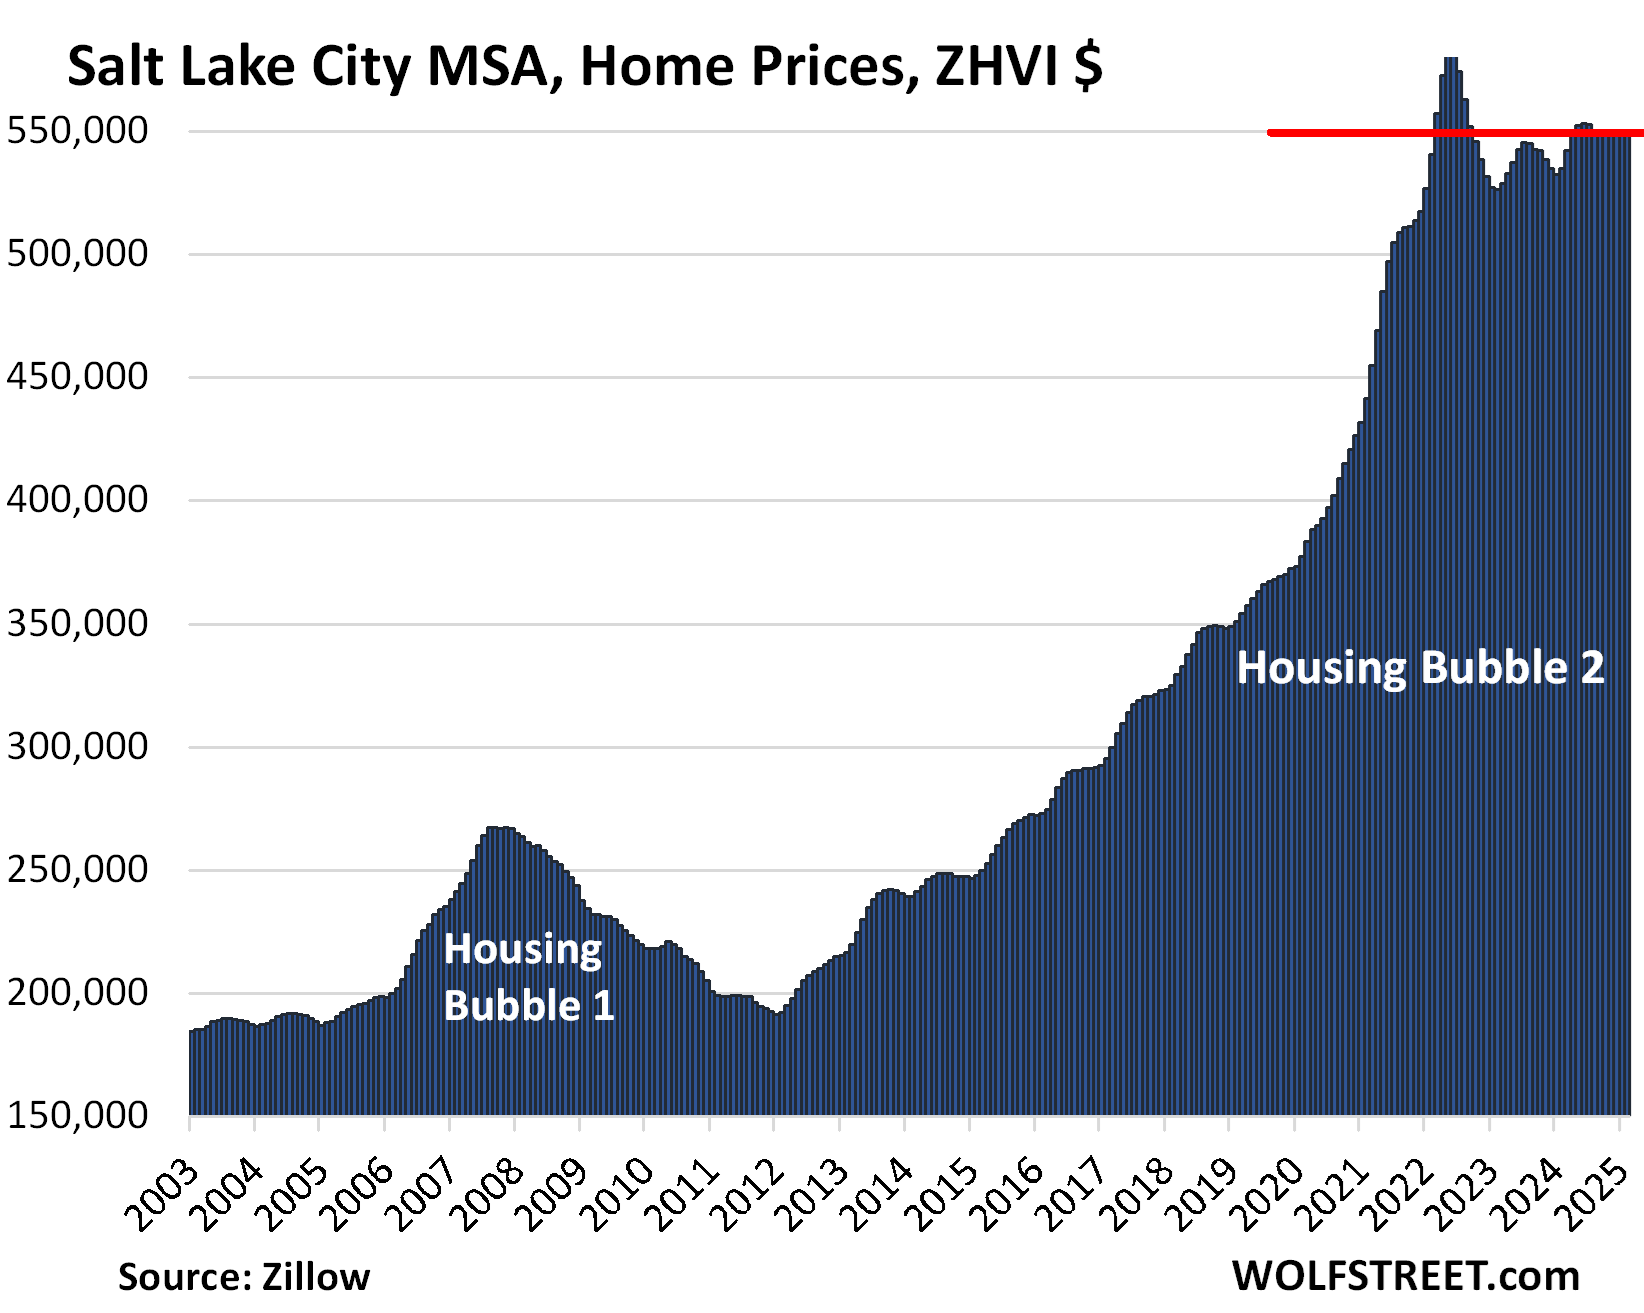
| Salt Lake City MSA, Home Prices | |||
| From July 2022 peak | MoM | YoY | Since 2000 |
| -5.8% | 0.2% | 2.7% | 214% |
First seen in March 2022:
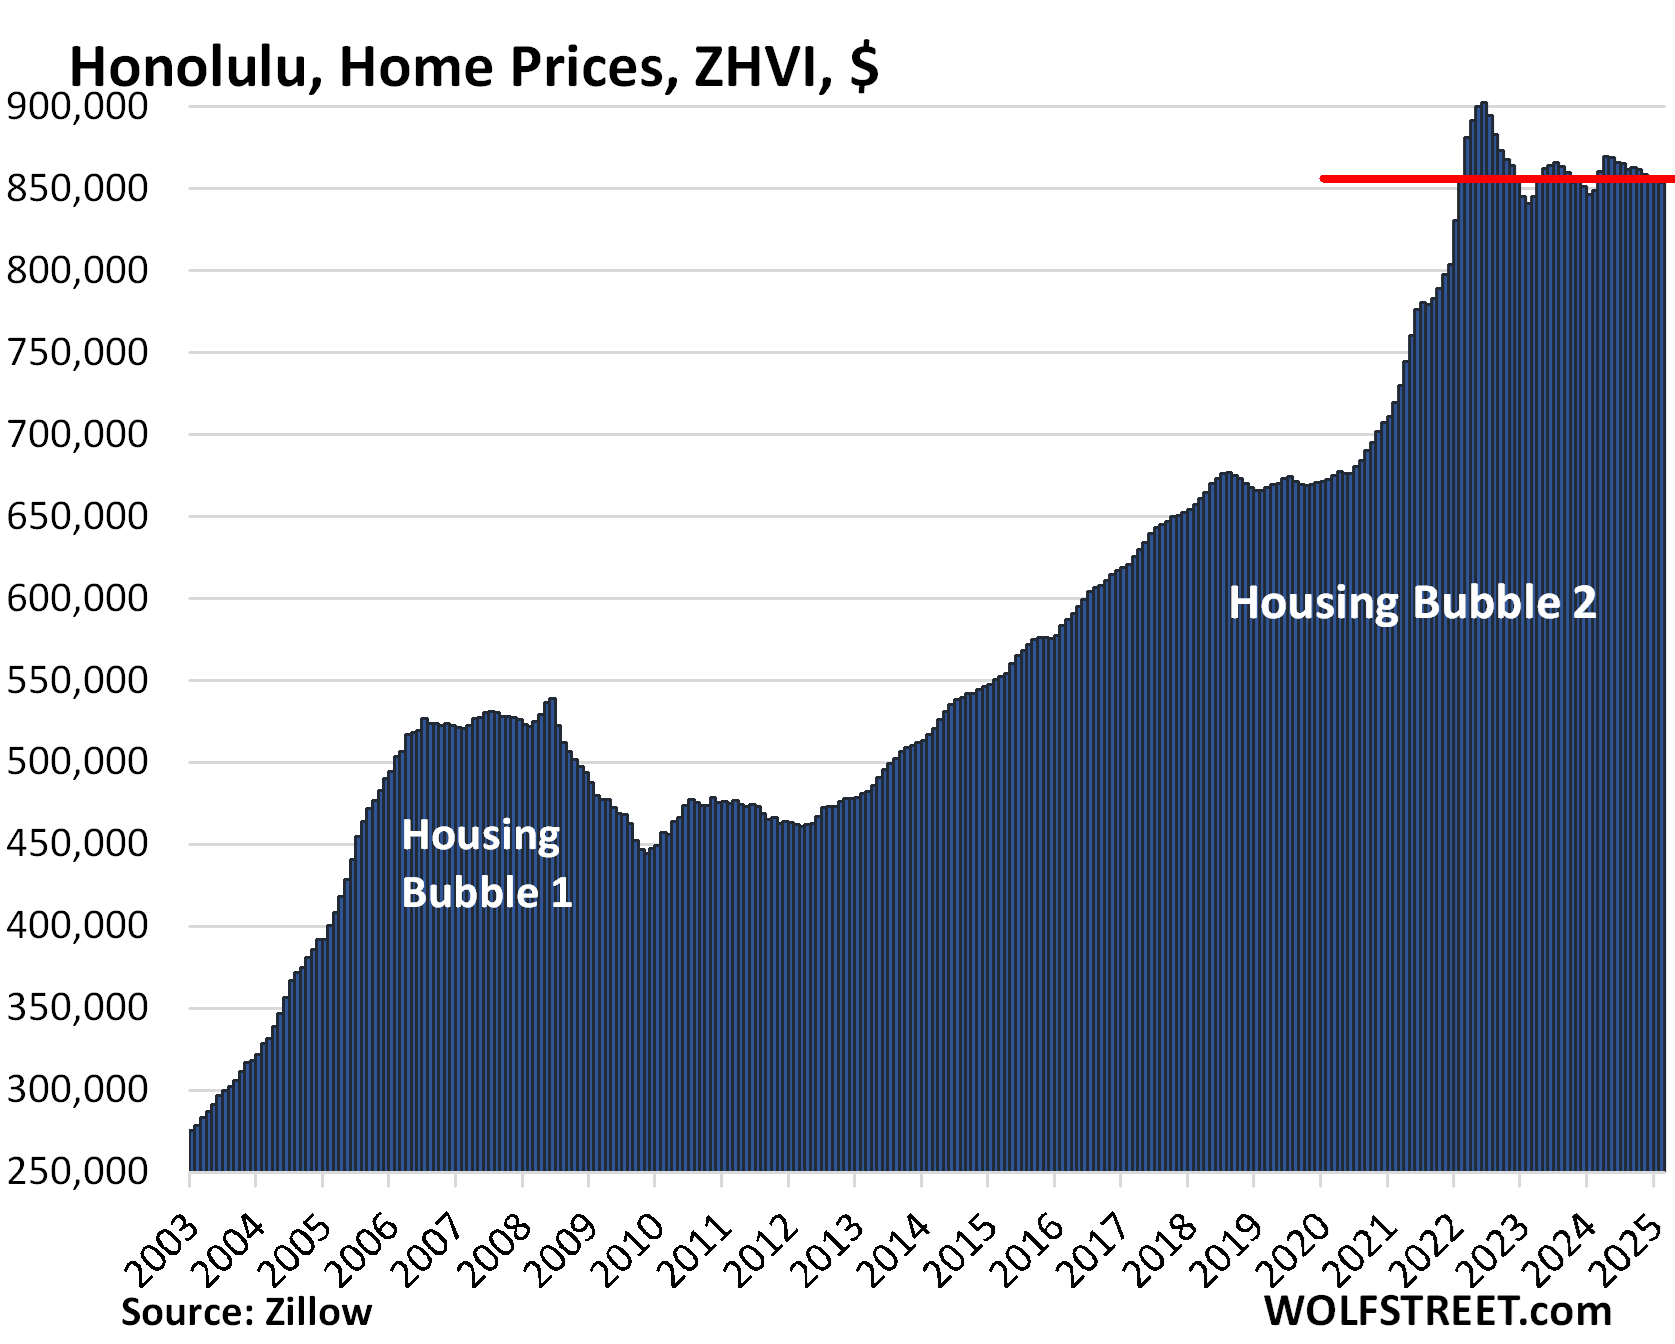
| Honolulu, Home Prices | |||
| From Jun 2022 peak | MoM | YoY | Since 2000 |
| -5.4% | 0.0% | 0.6% | 278% |
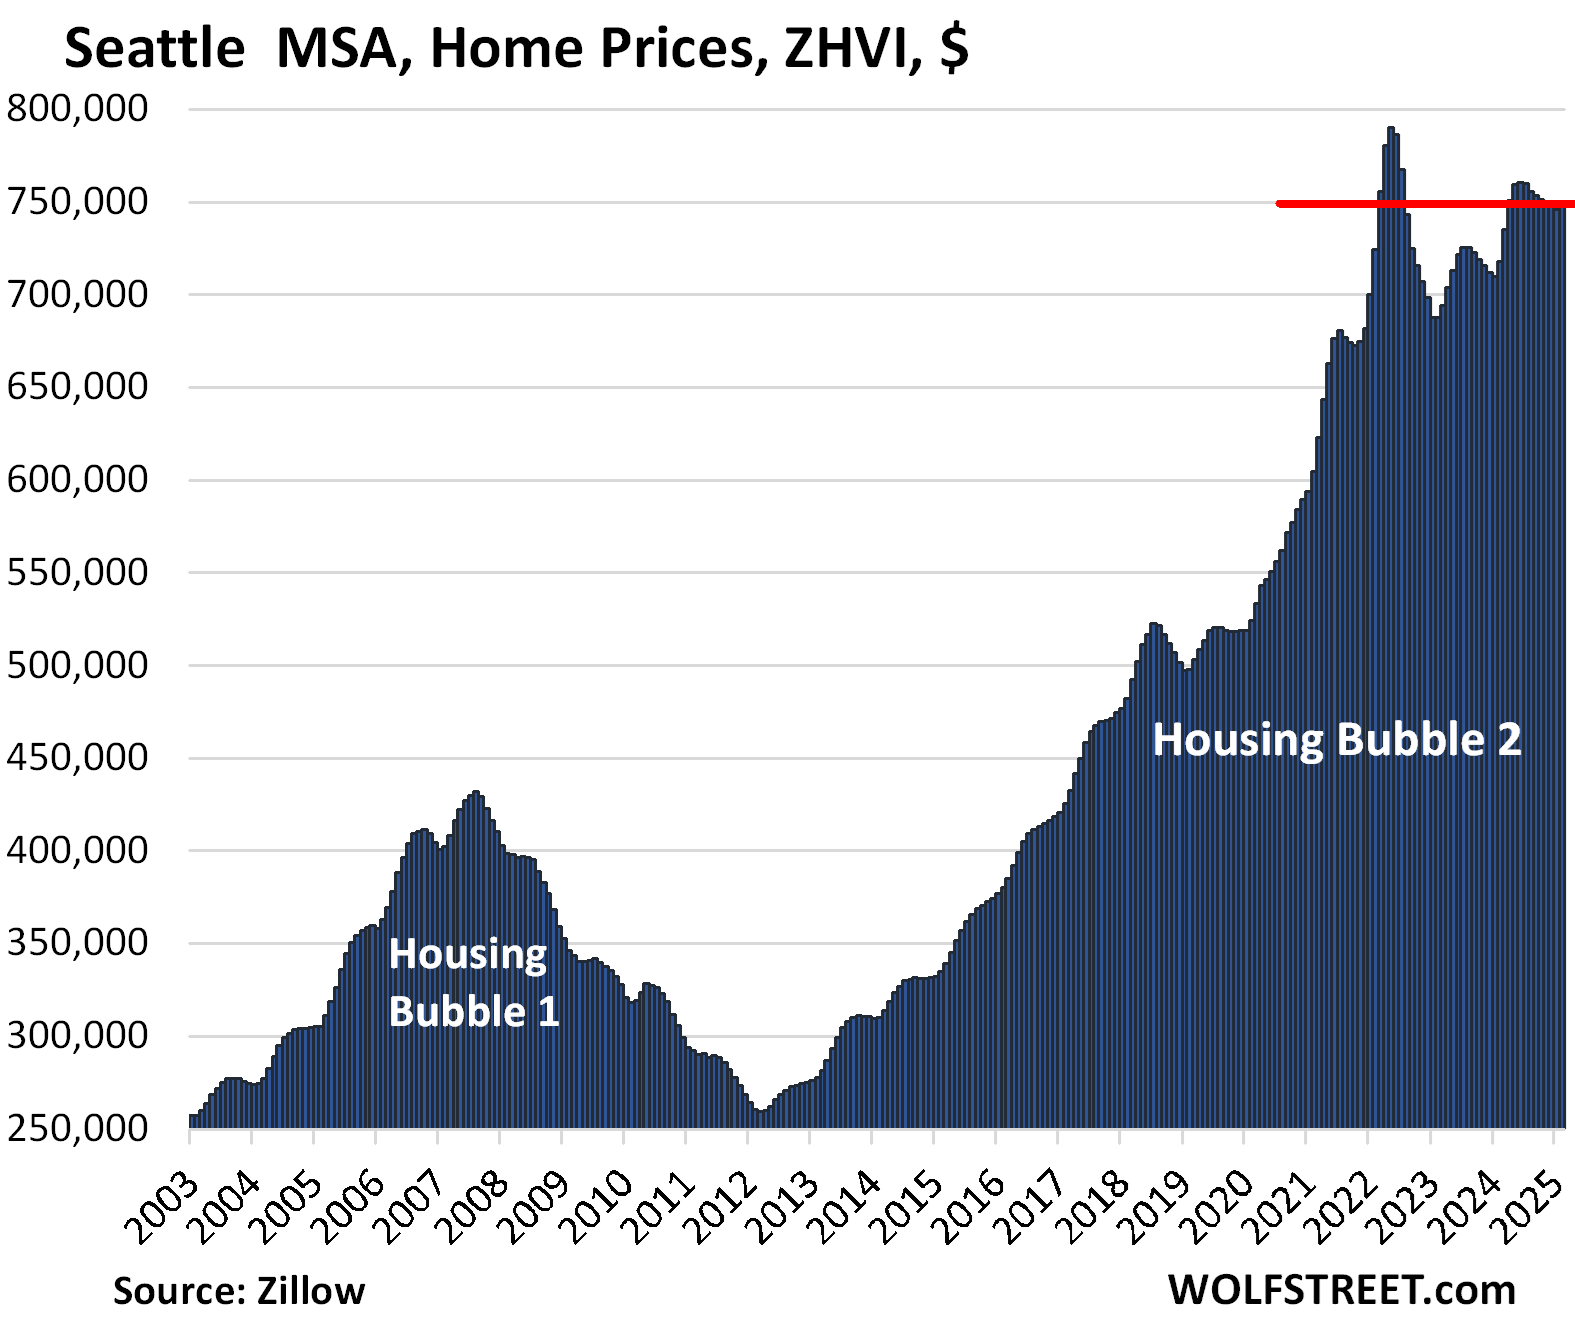
| Seattle MSA, Home Prices | |||
| From May 2022 peak | MoM | YoY | Since 2000 |
| -5.2% | 0.4% | 4.3% | 238% |
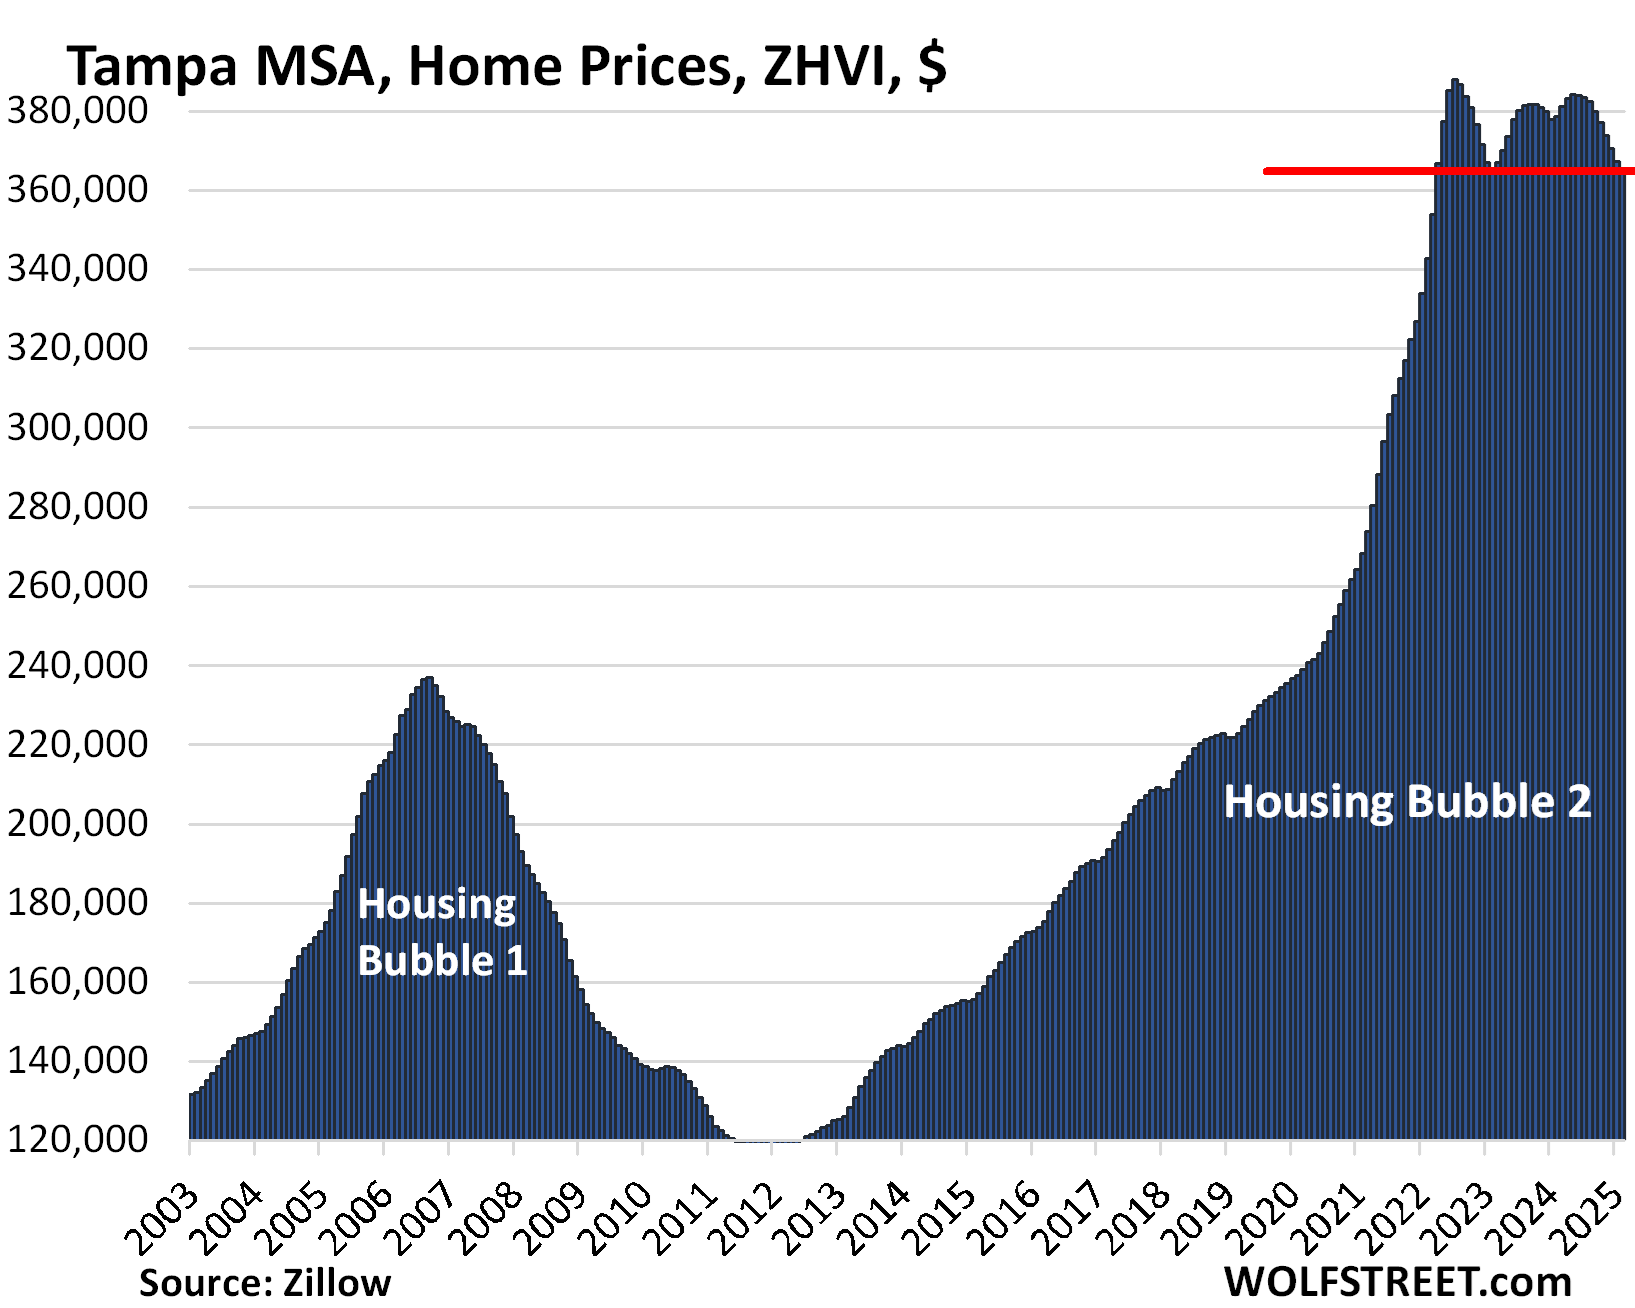
| Tampa MSA, Home Prices | |||
| From Jul 2022 peak | MoM | YoY | Since 2000 |
| -4.9% | -0.4% | -1.5% | 207% |
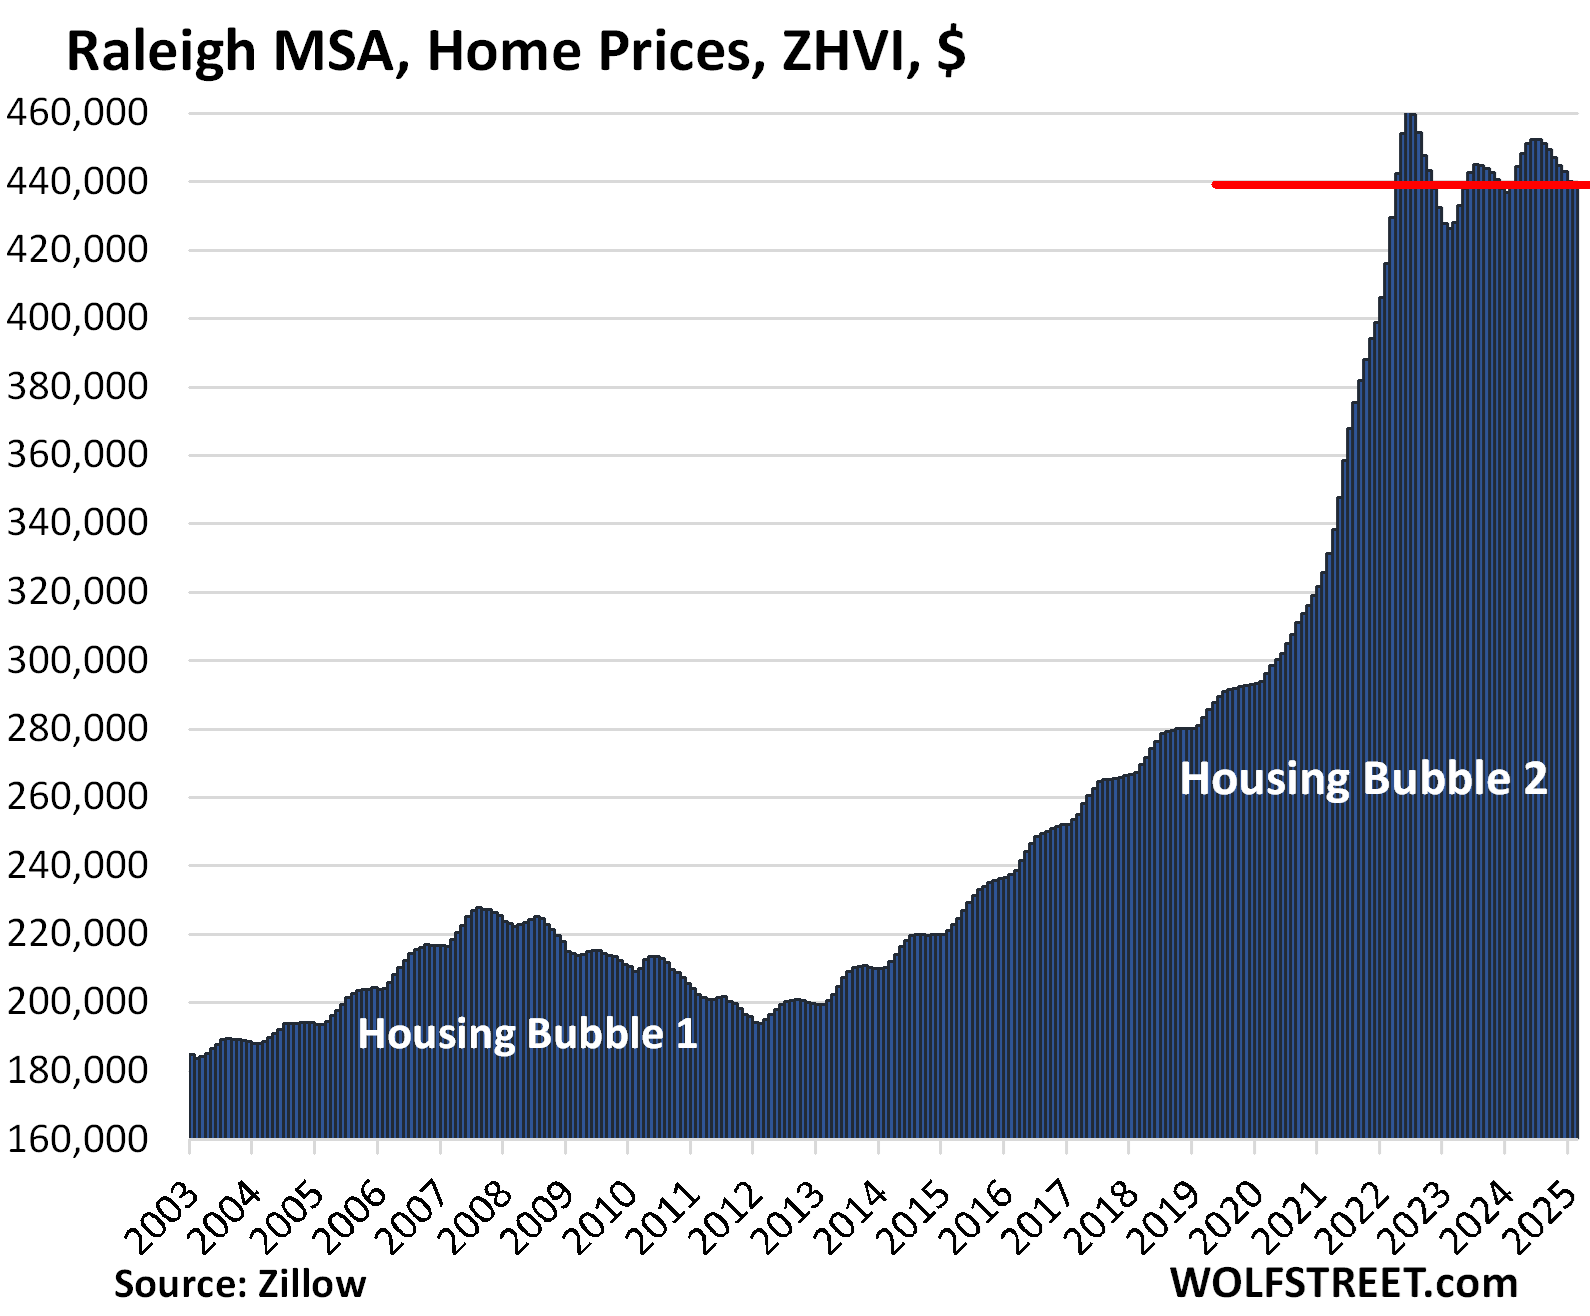
| Raleigh MSA, Home Prices | |||
| From July 2022 peak | MoM | YoY | Since 2000 |
| -4.6% | -0.2% | 0.0% | 155% |
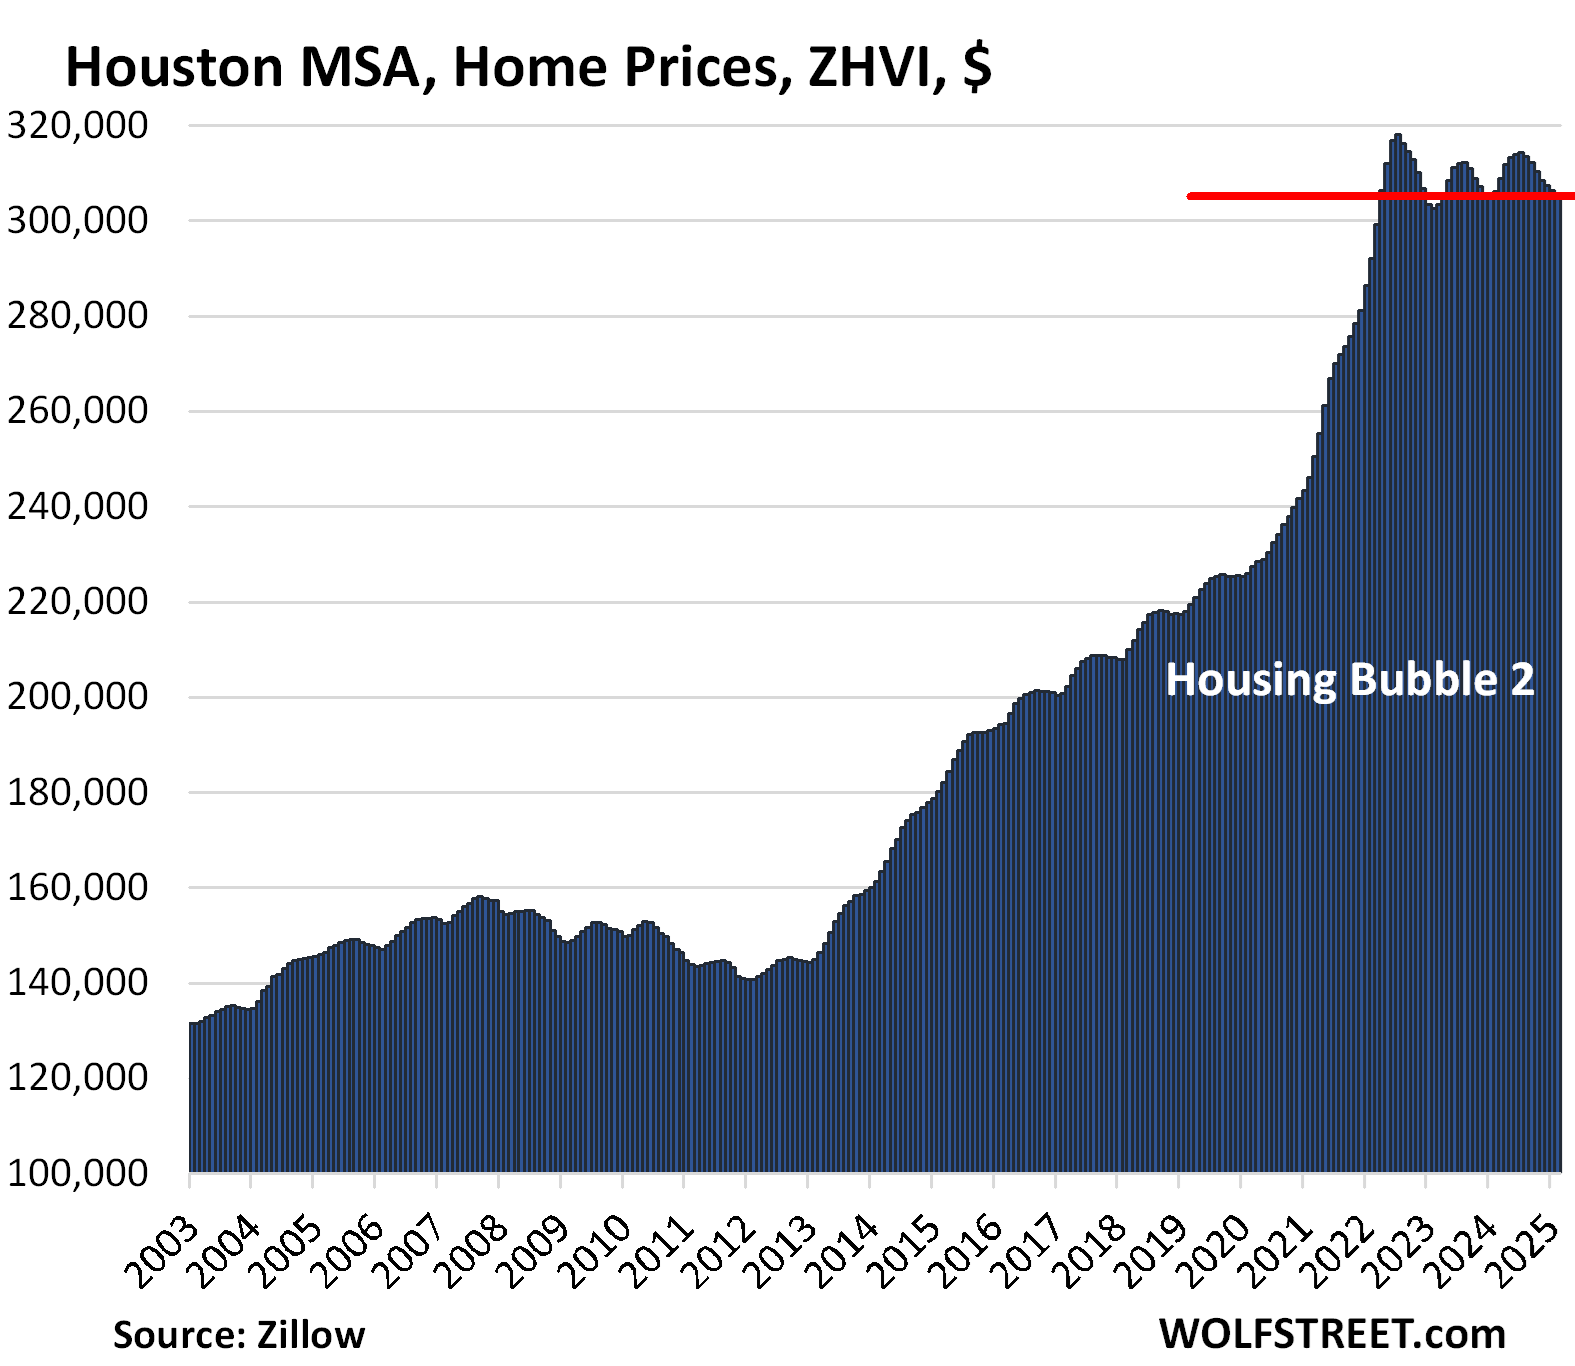
| Houston MSA, Home Prices | |||
| From Jul 2022 peak | MoM | YoY | Since 2000 |
| -3.9% | -0.2% | -0.2% | 148% |
First seen in April 2022.
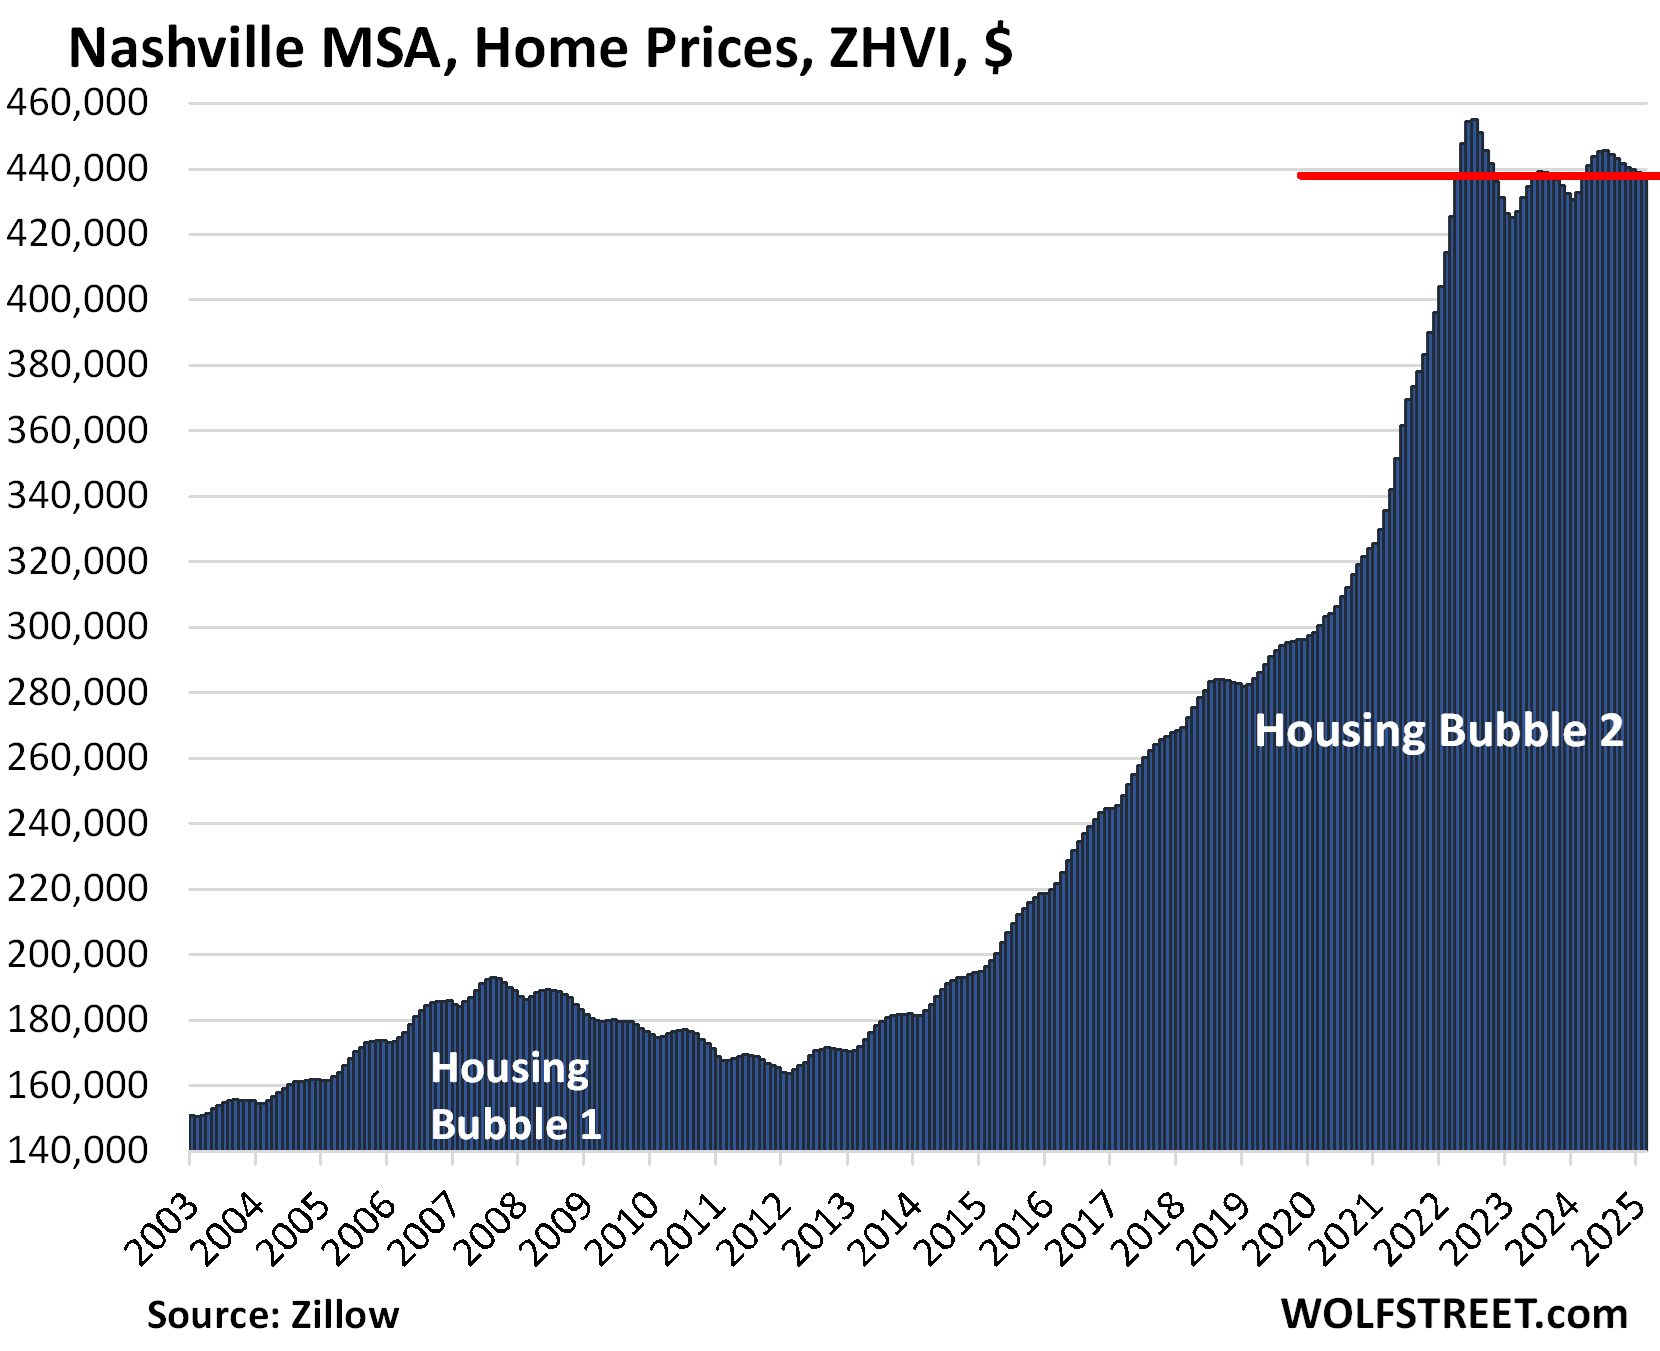
| Nashville MSA, Home Prices | |||
| From July 2022 peak | MoM | YoY | Since 2000 |
| -3.7% | -0.1% | 1.3% | 216% |
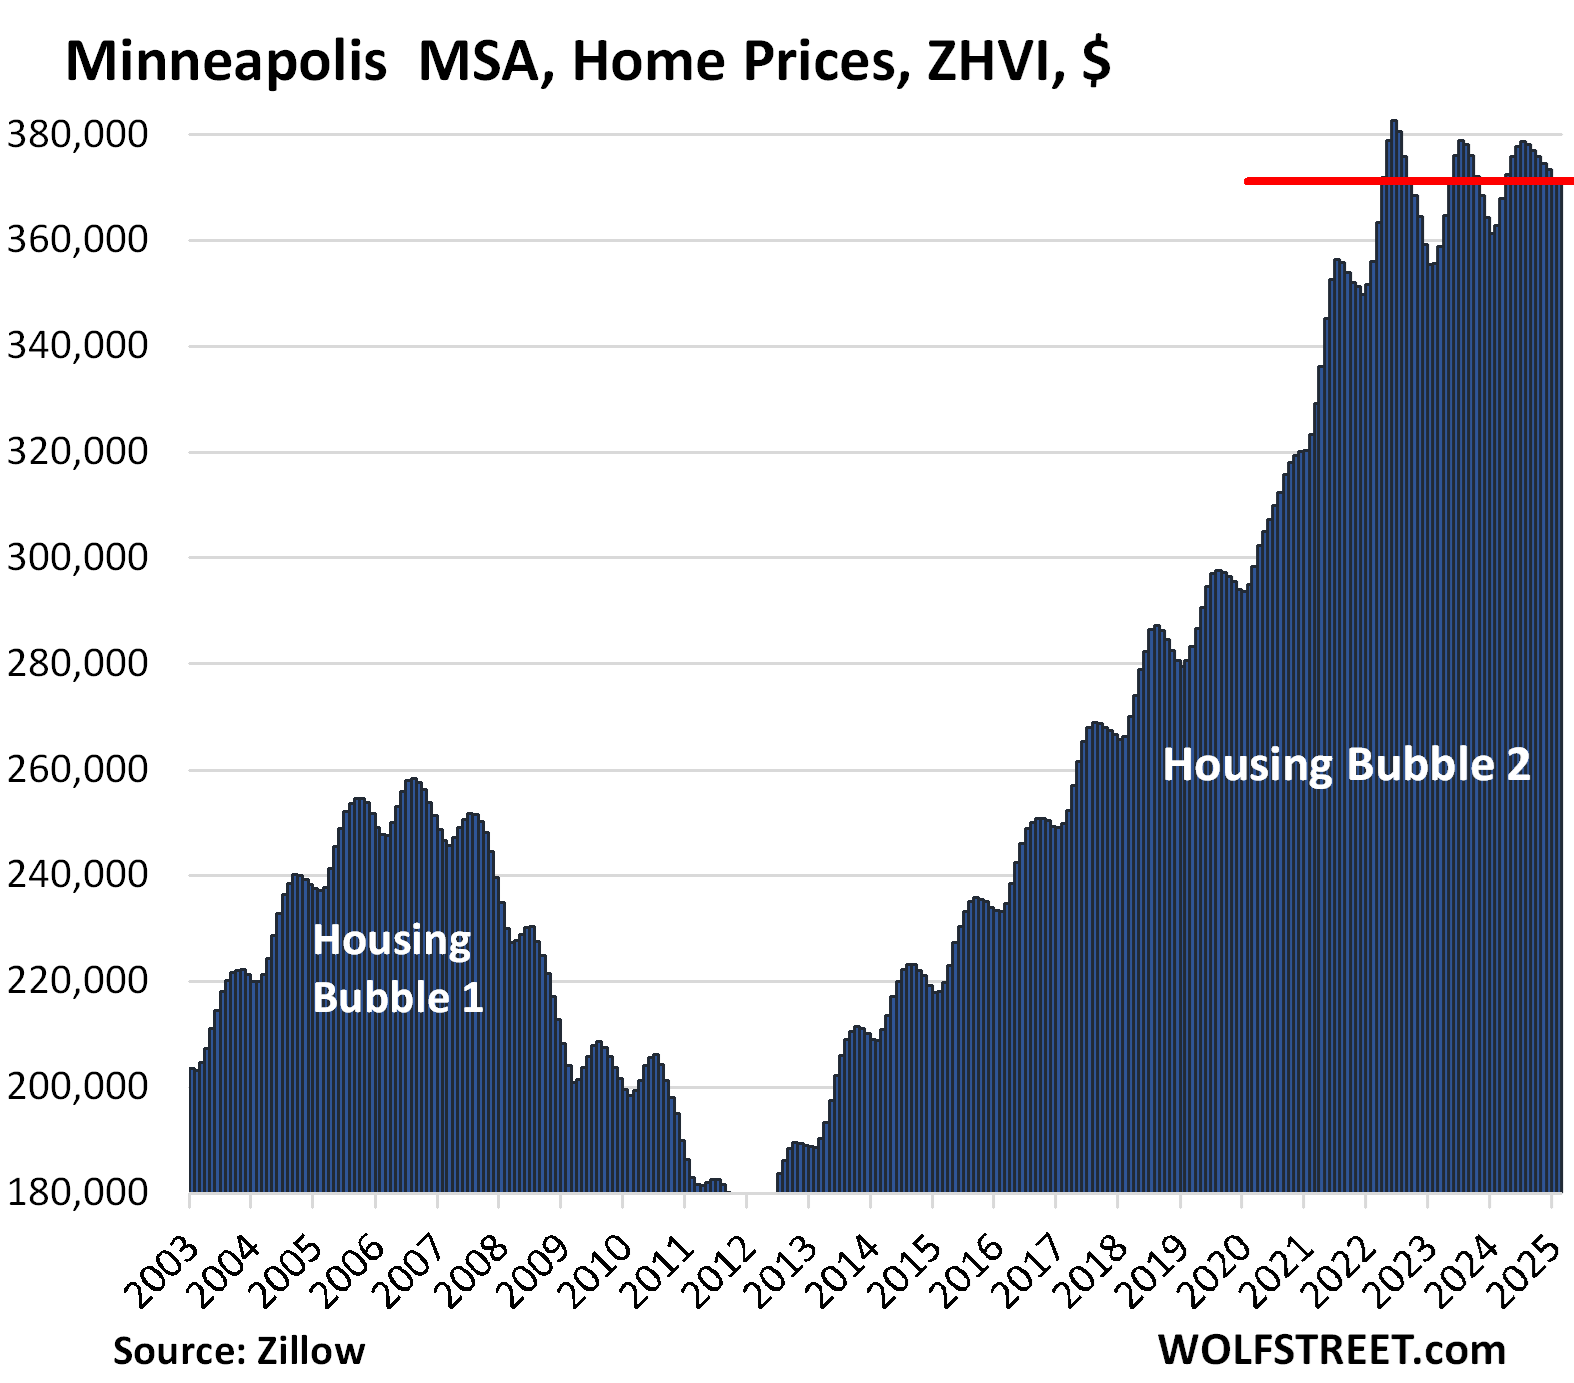
| Minneapolis MSA, Home Prices | |||
| From May 2022 peak | MoM | YoY | Since 2000 |
| -3.0% | -0.1% | 2.4% | 155% |
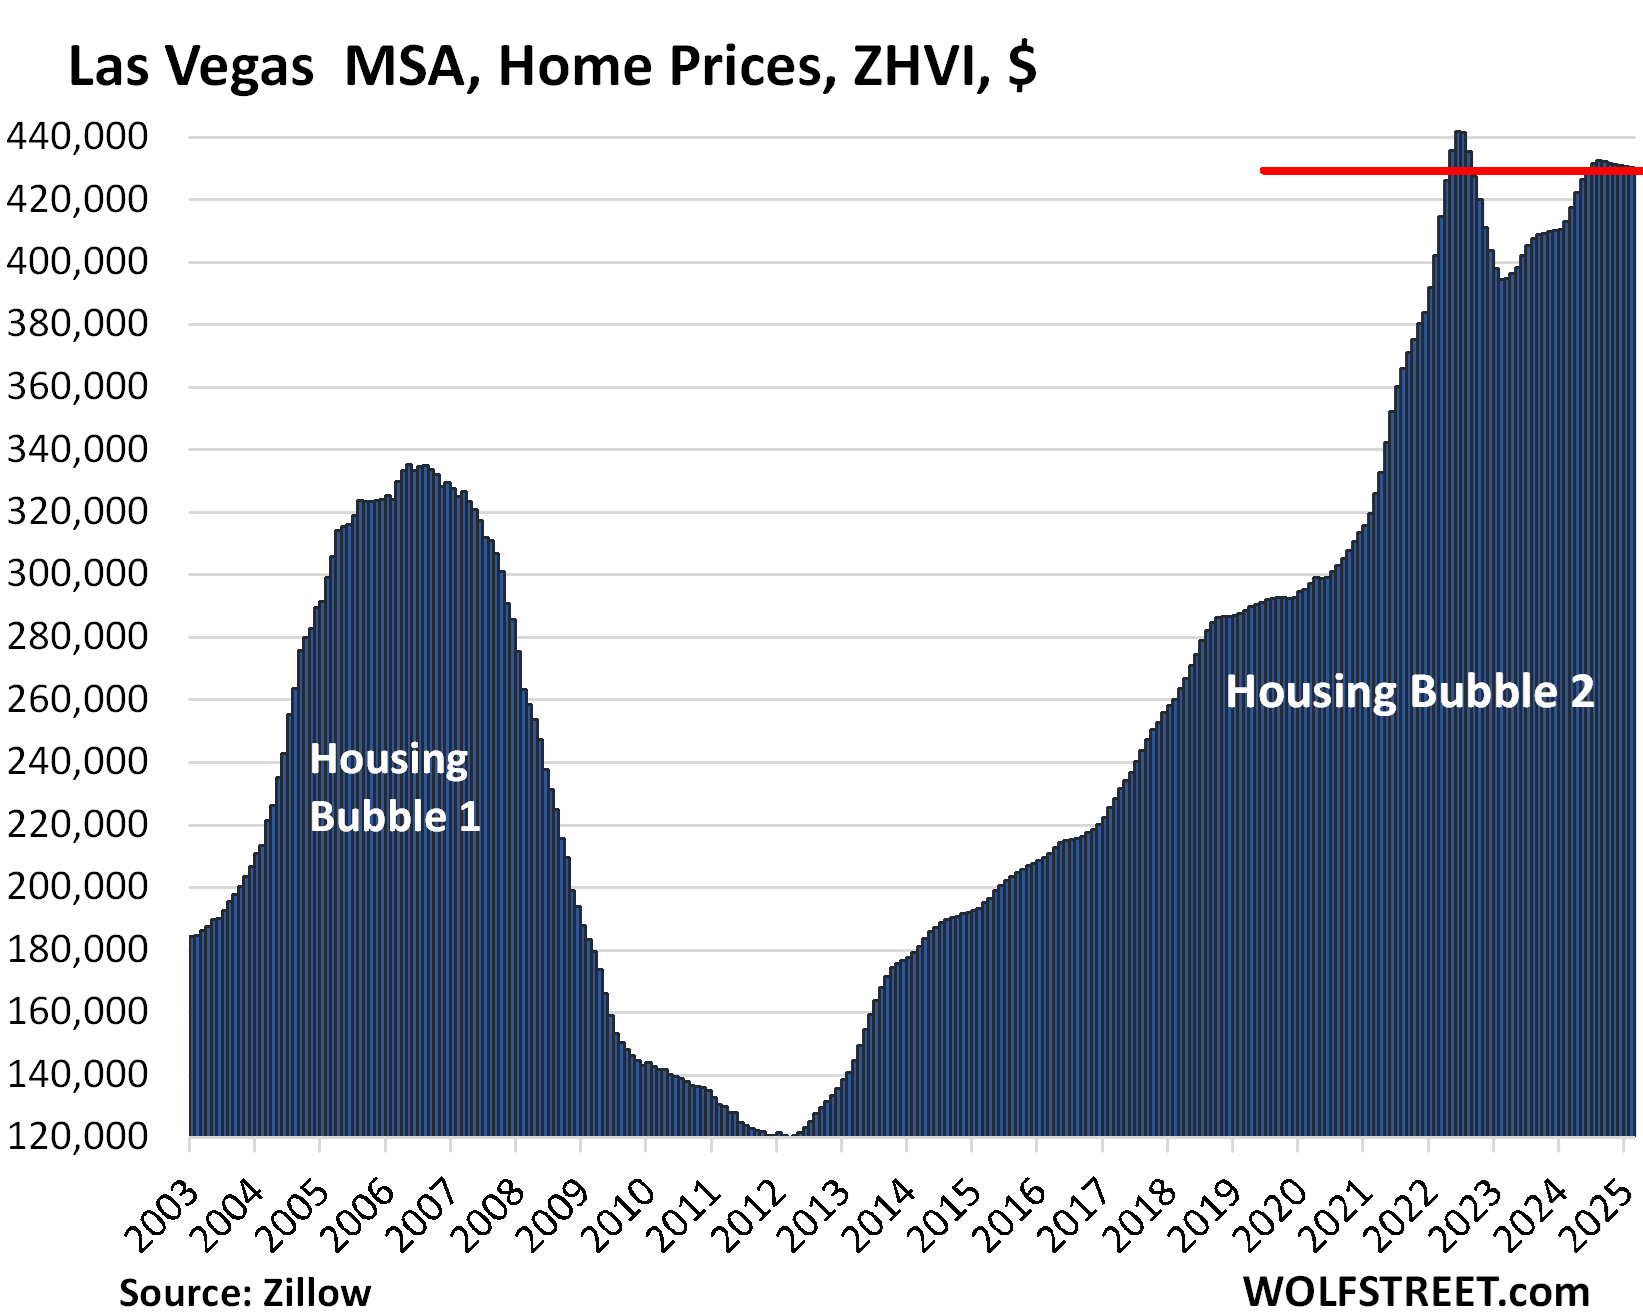
| Las Vegas MSA, Home Prices | |||
| From June 2022 peak | MoM | YoY | Since 2000 |
| -2.6% | -0.1% | 4.2% | 178% |
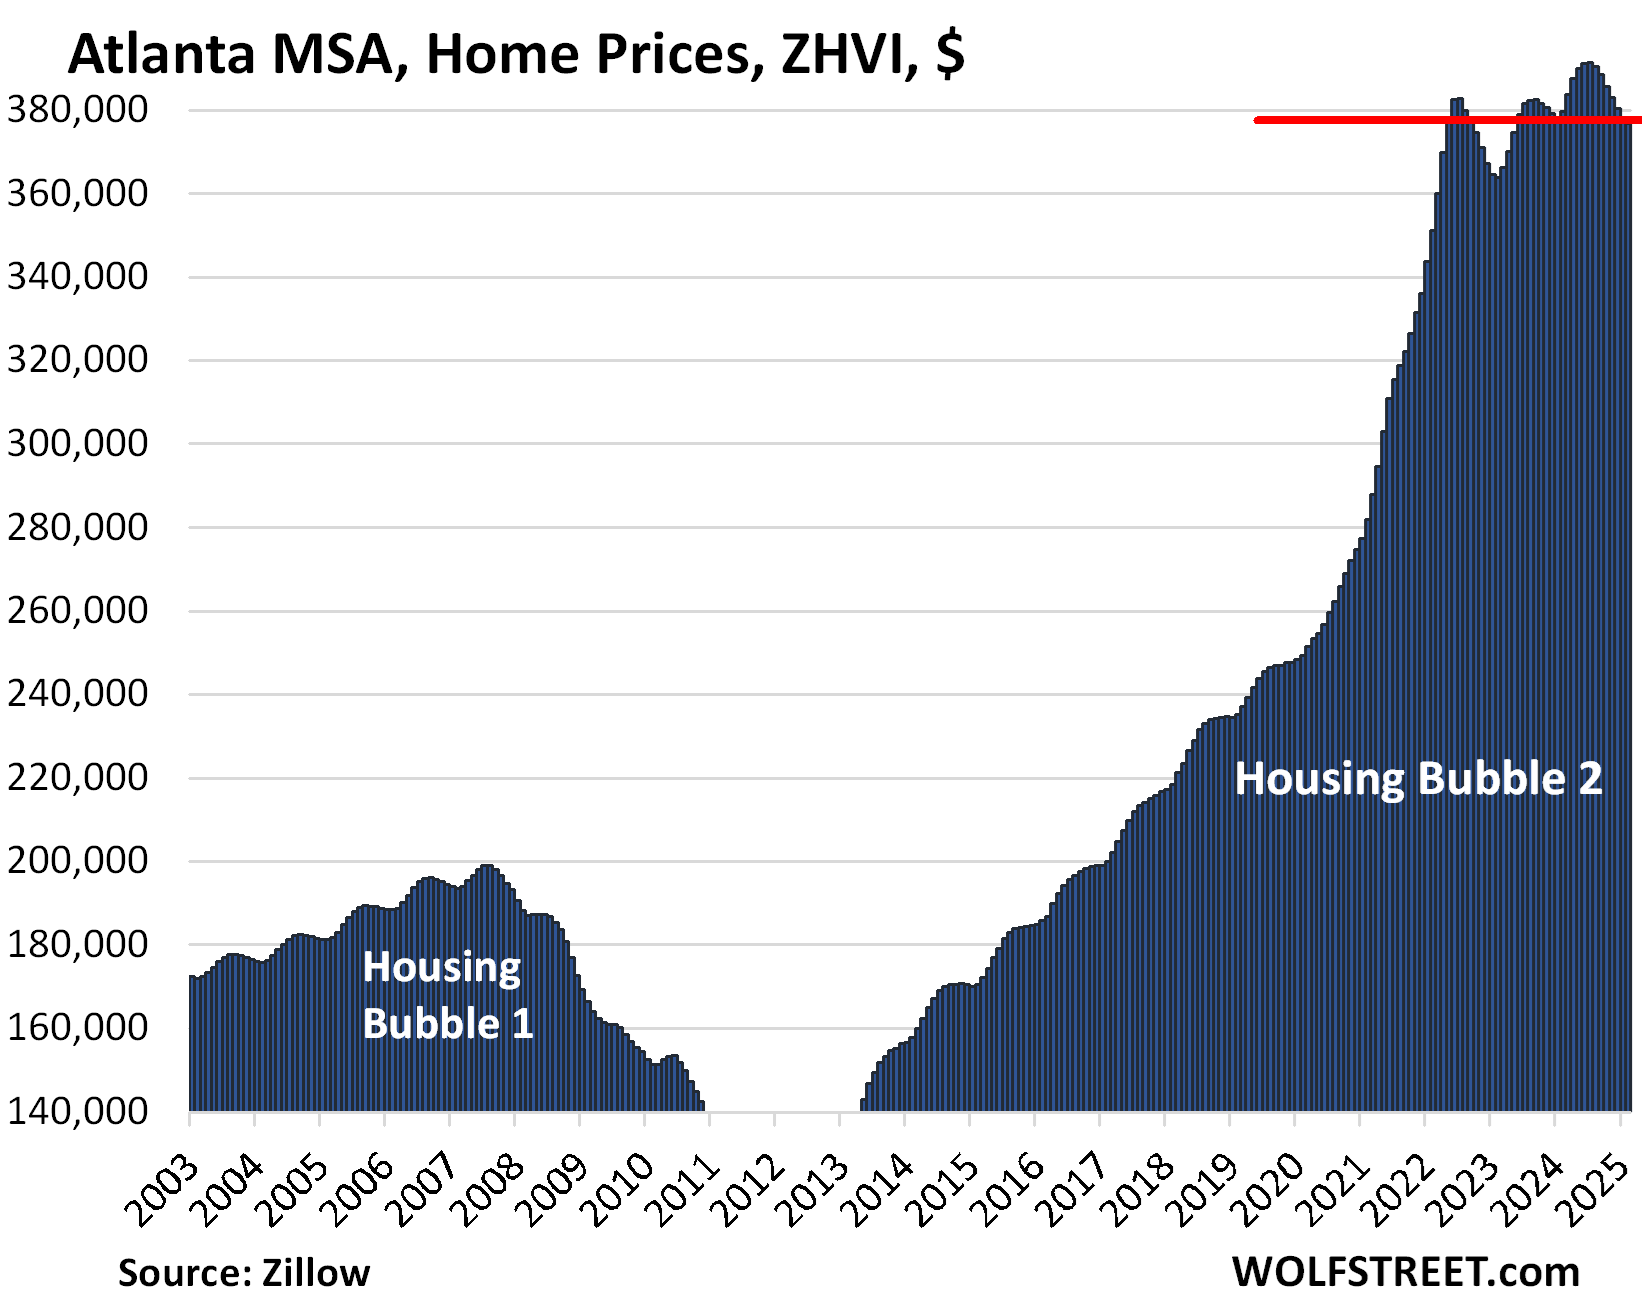
| Atlanta MSA, Home Prices | |||
| From July 2022 | MoM | YoY | Since 2000 |
| -1.6% | -0.3% | -0.7% | 158% |
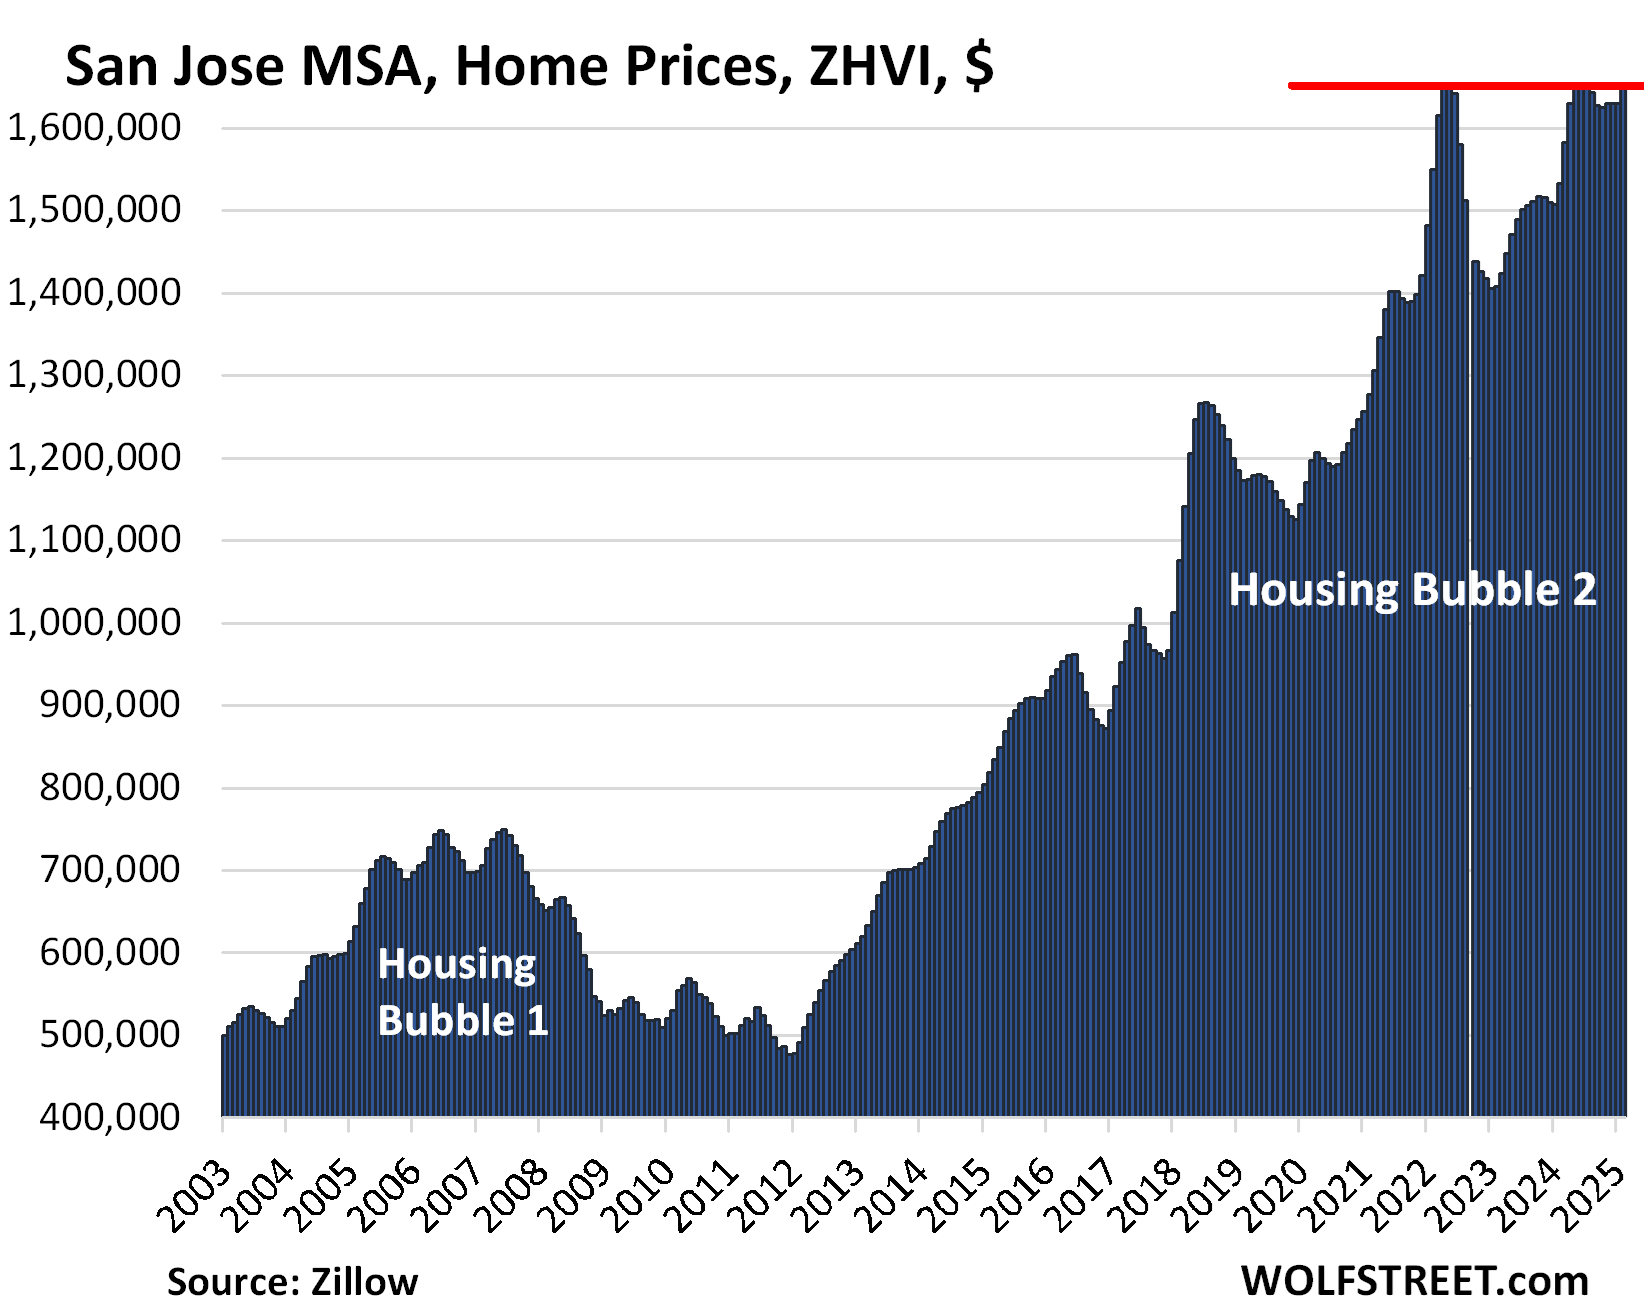
| San Jose MSA, Home Prices | |||
| From May 2022 peak | MoM | YoY | Since 2000 |
| -1.1% | 1.1% | 7.6% | 342% |
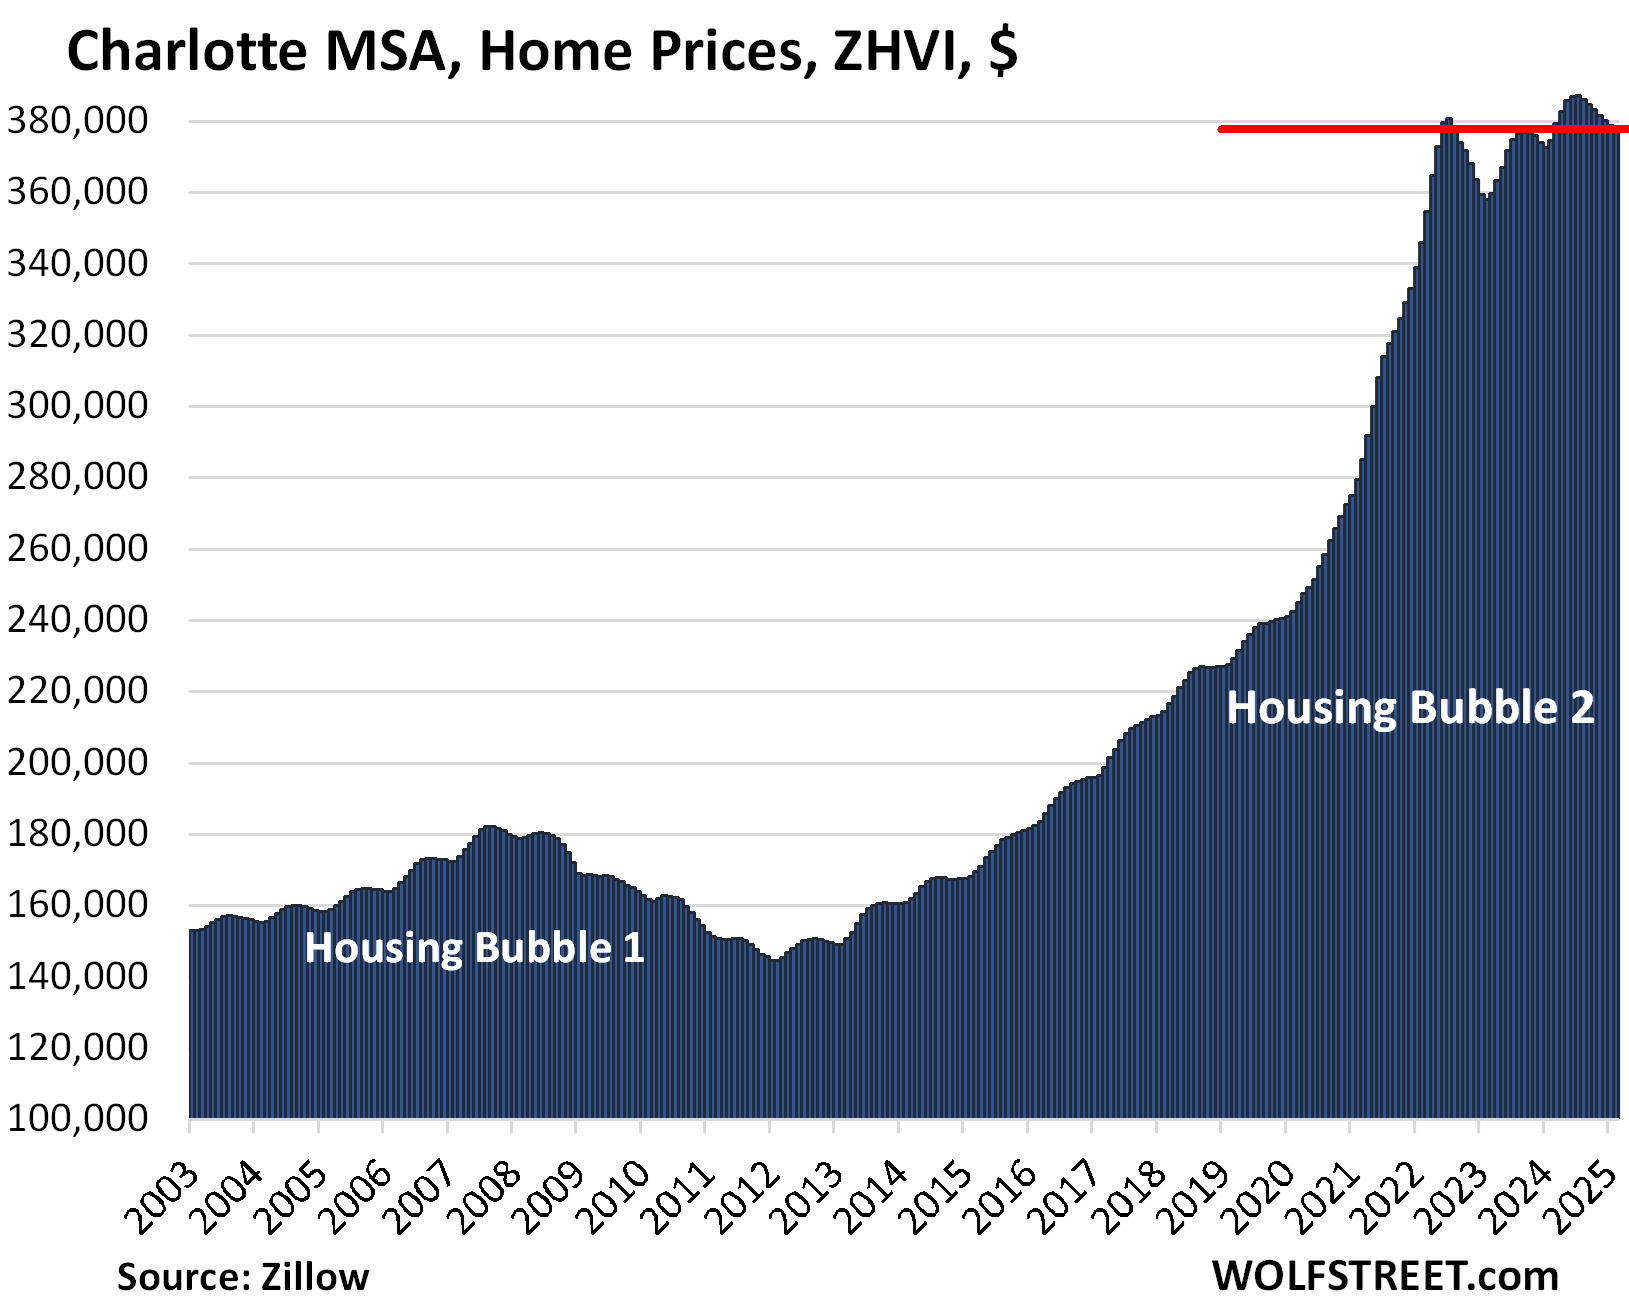
| Charlotte MSA, Home Prices | |||
| From June 2022 | MoM | YoY | Since 2000 |
| -0.7% | -0.2% | 0.9% | 168% |
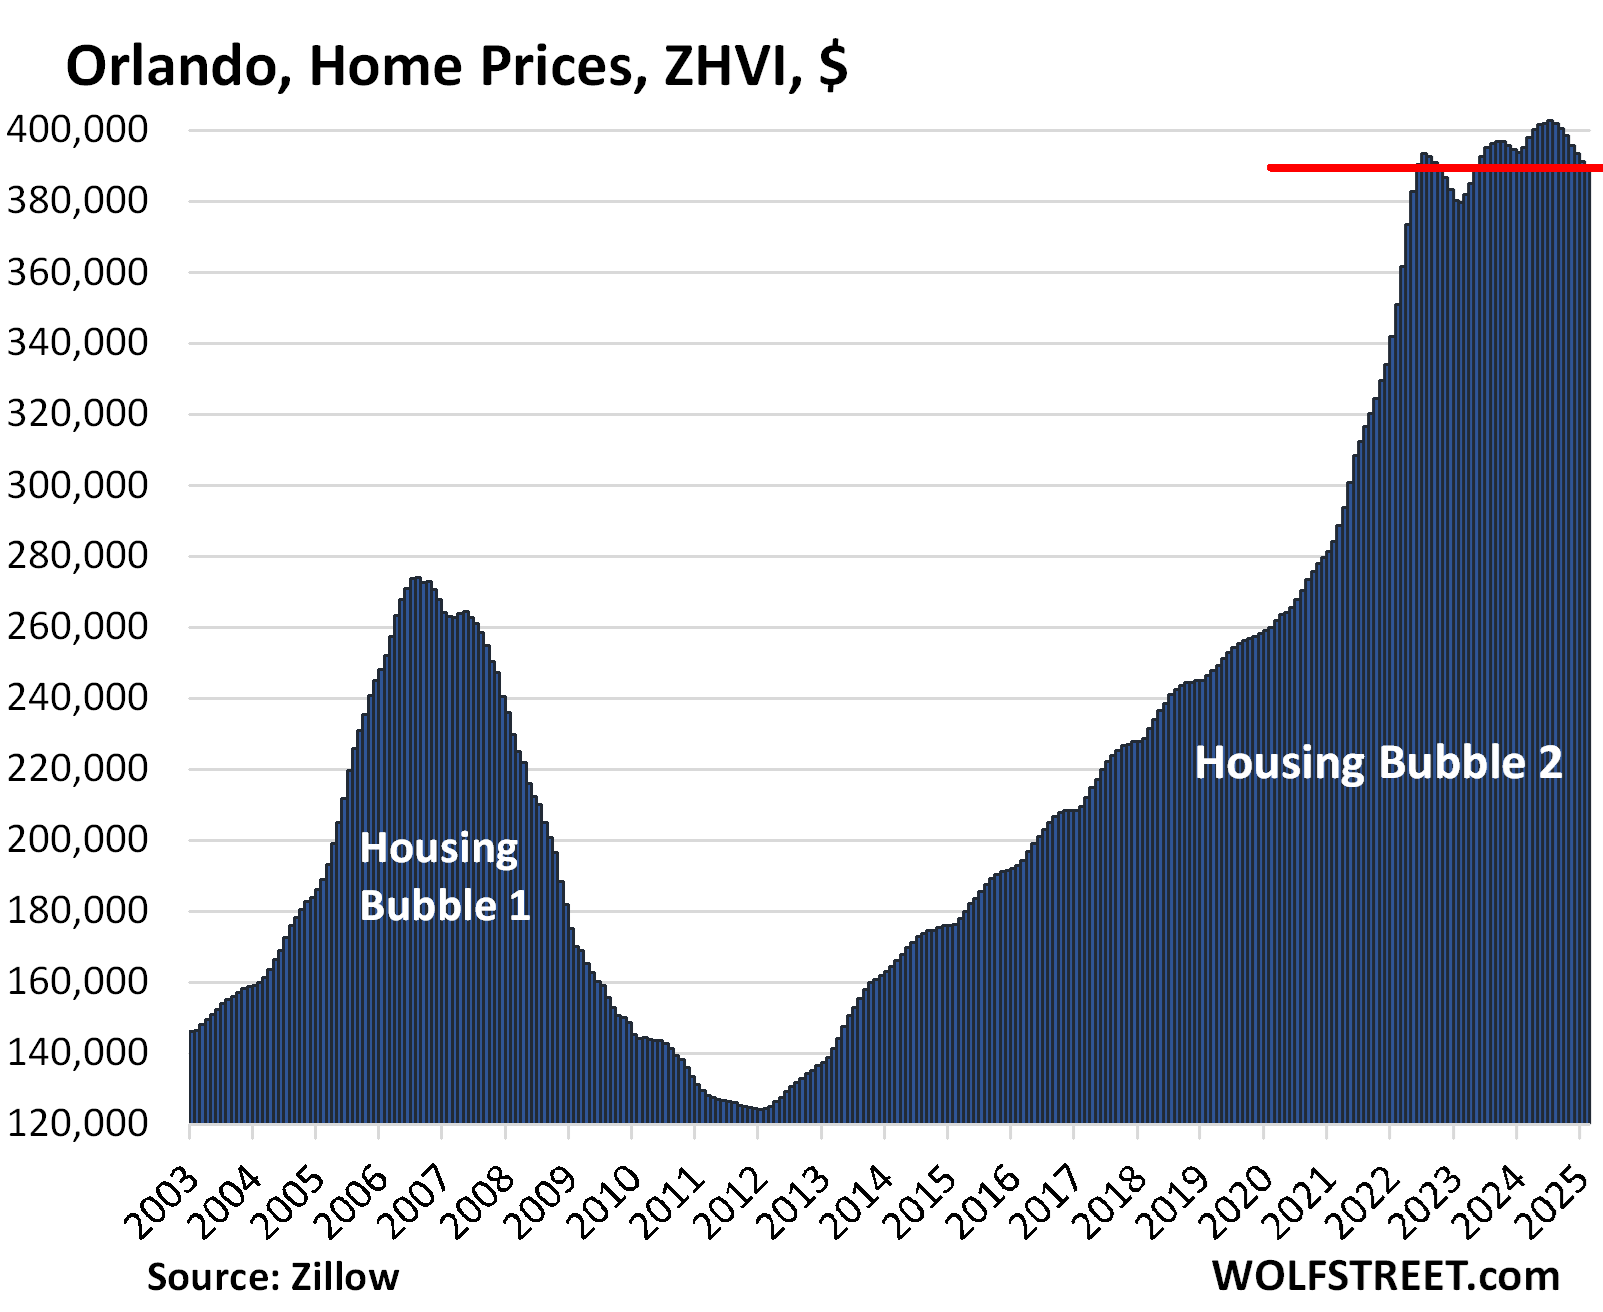
| Orlando MSA, Home Prices | |||
| From June 2022 | MoM | YoY | Since 2000 |
| -0.92% | -0.4% | -1.4% | 231.4% |
The 12 markets that rose after mid-2022 (but some are now sagging):
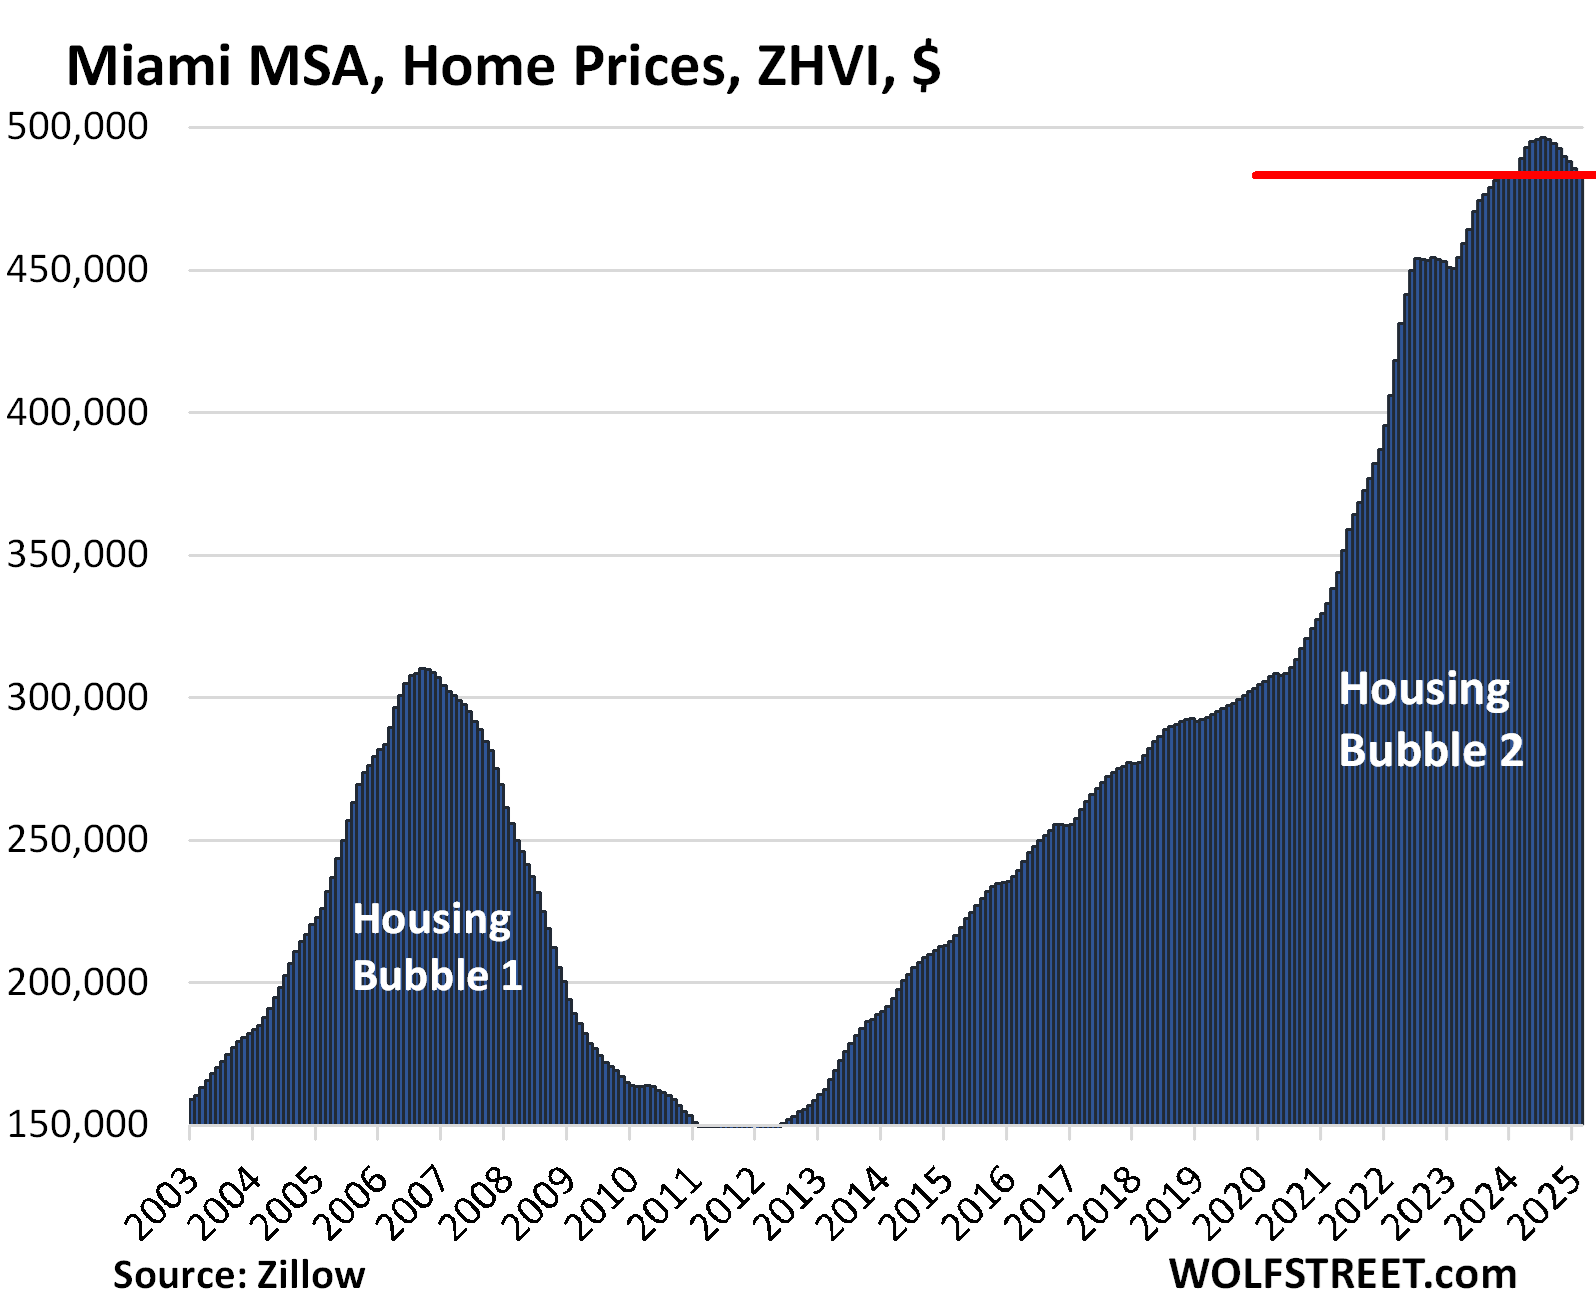
| Miami MSA, Home Prices | ||
| MoM | YoY | Since 2000 |
| -0.4% | -0.2% | 325.6% |
Miami prices have dropped enough to where they’re not down year-over-year.
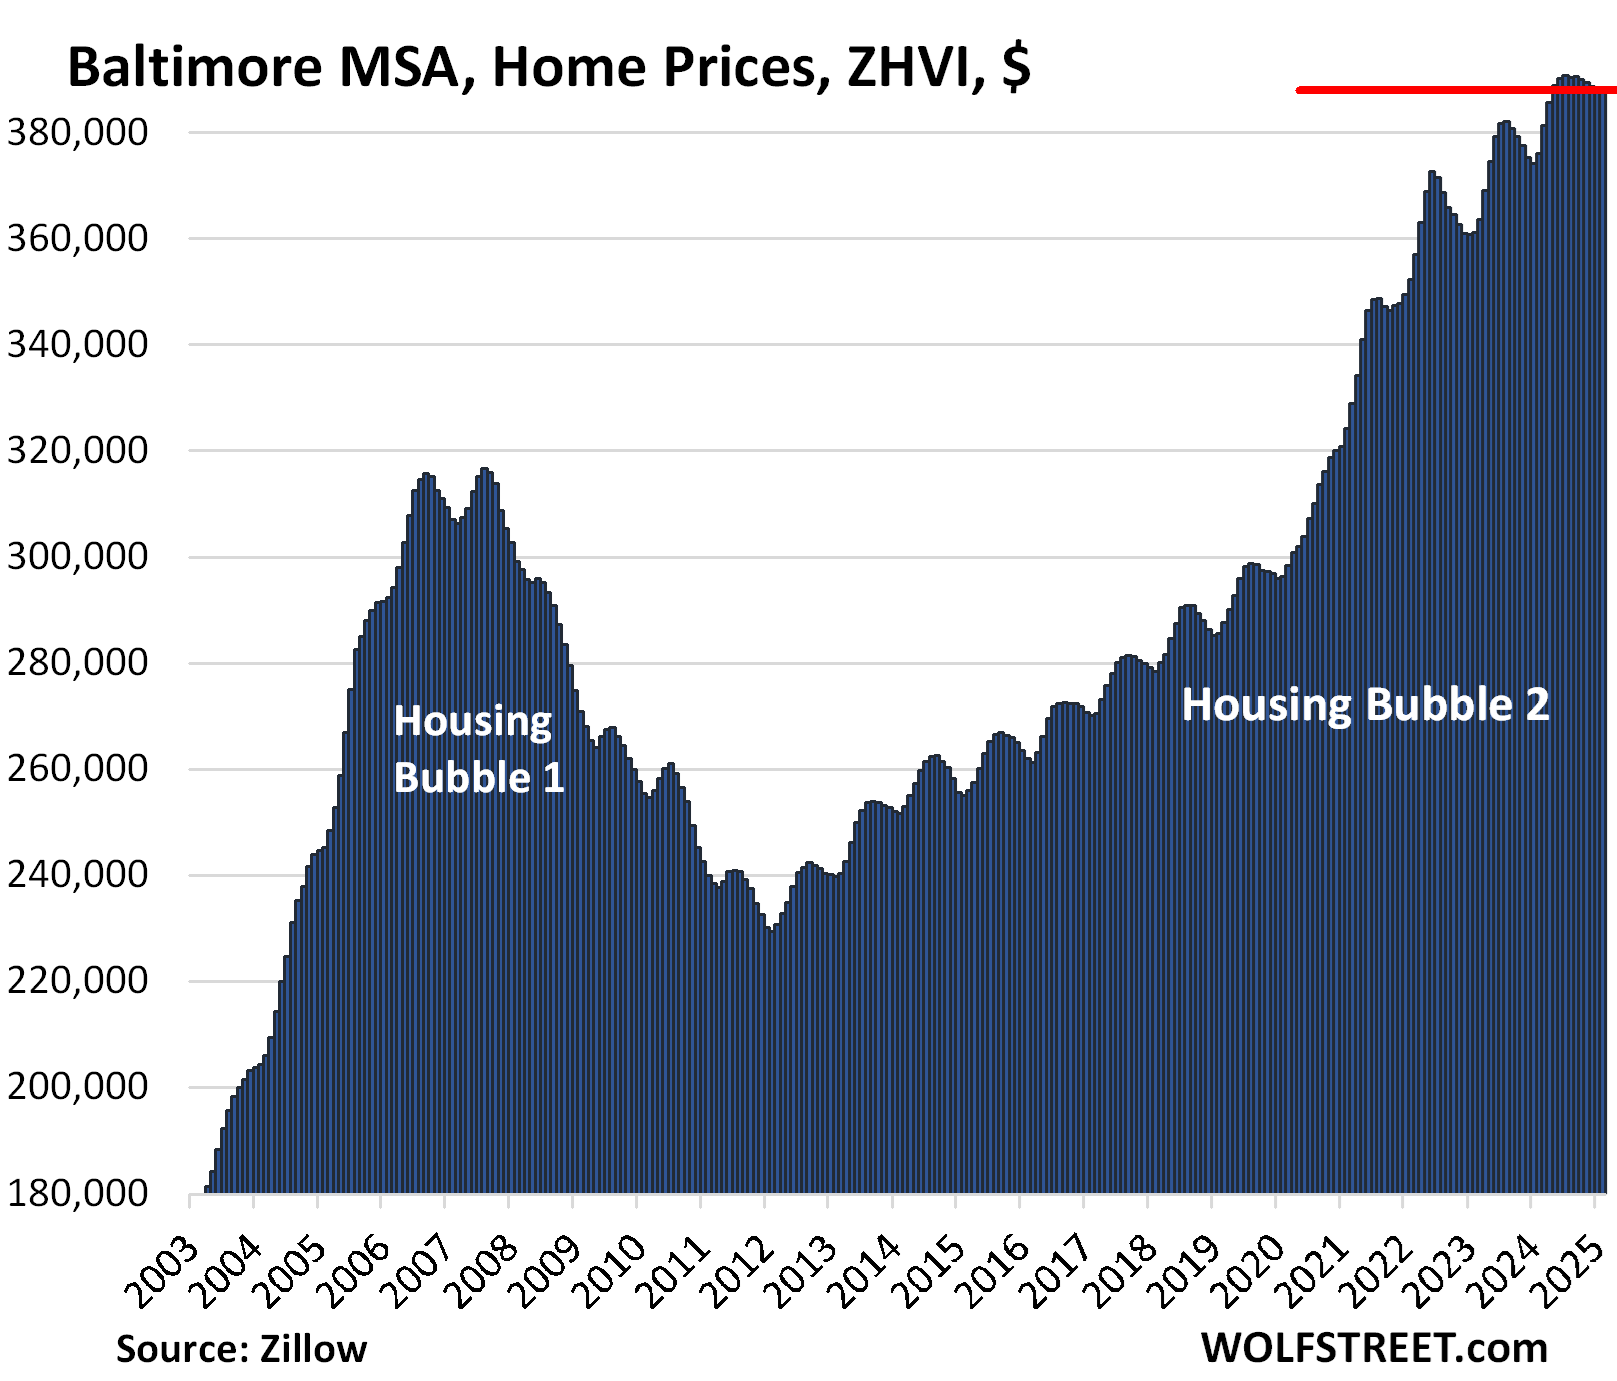
| Baltimore MSA, Home Prices | |||
| MoM | YoY | Since 2000 | |
| 0.0% | 3.1% | 173% | |
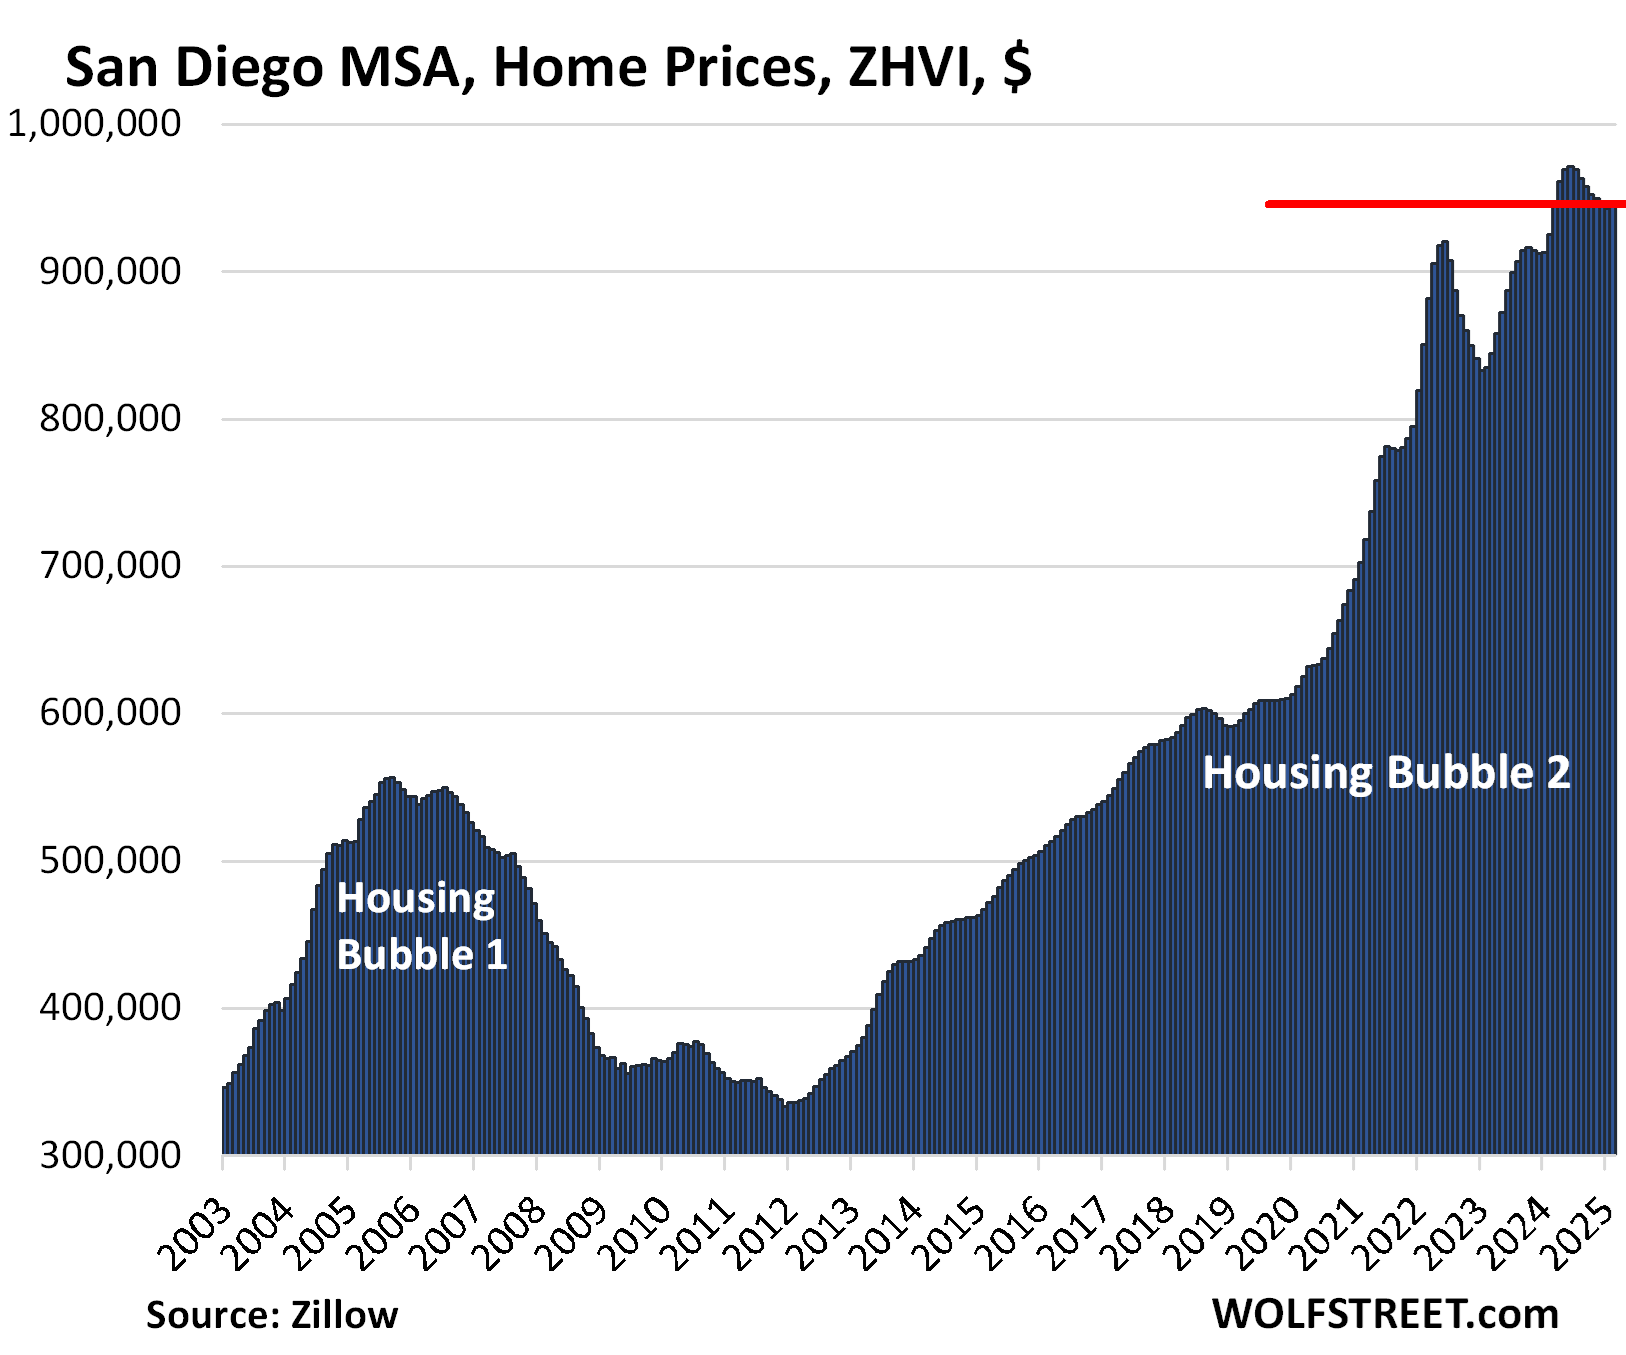
| San Diego MSA, Home Prices | ||
| MoM | YoY | Since 2000 |
| 0.3% | 2.3% | 332% |
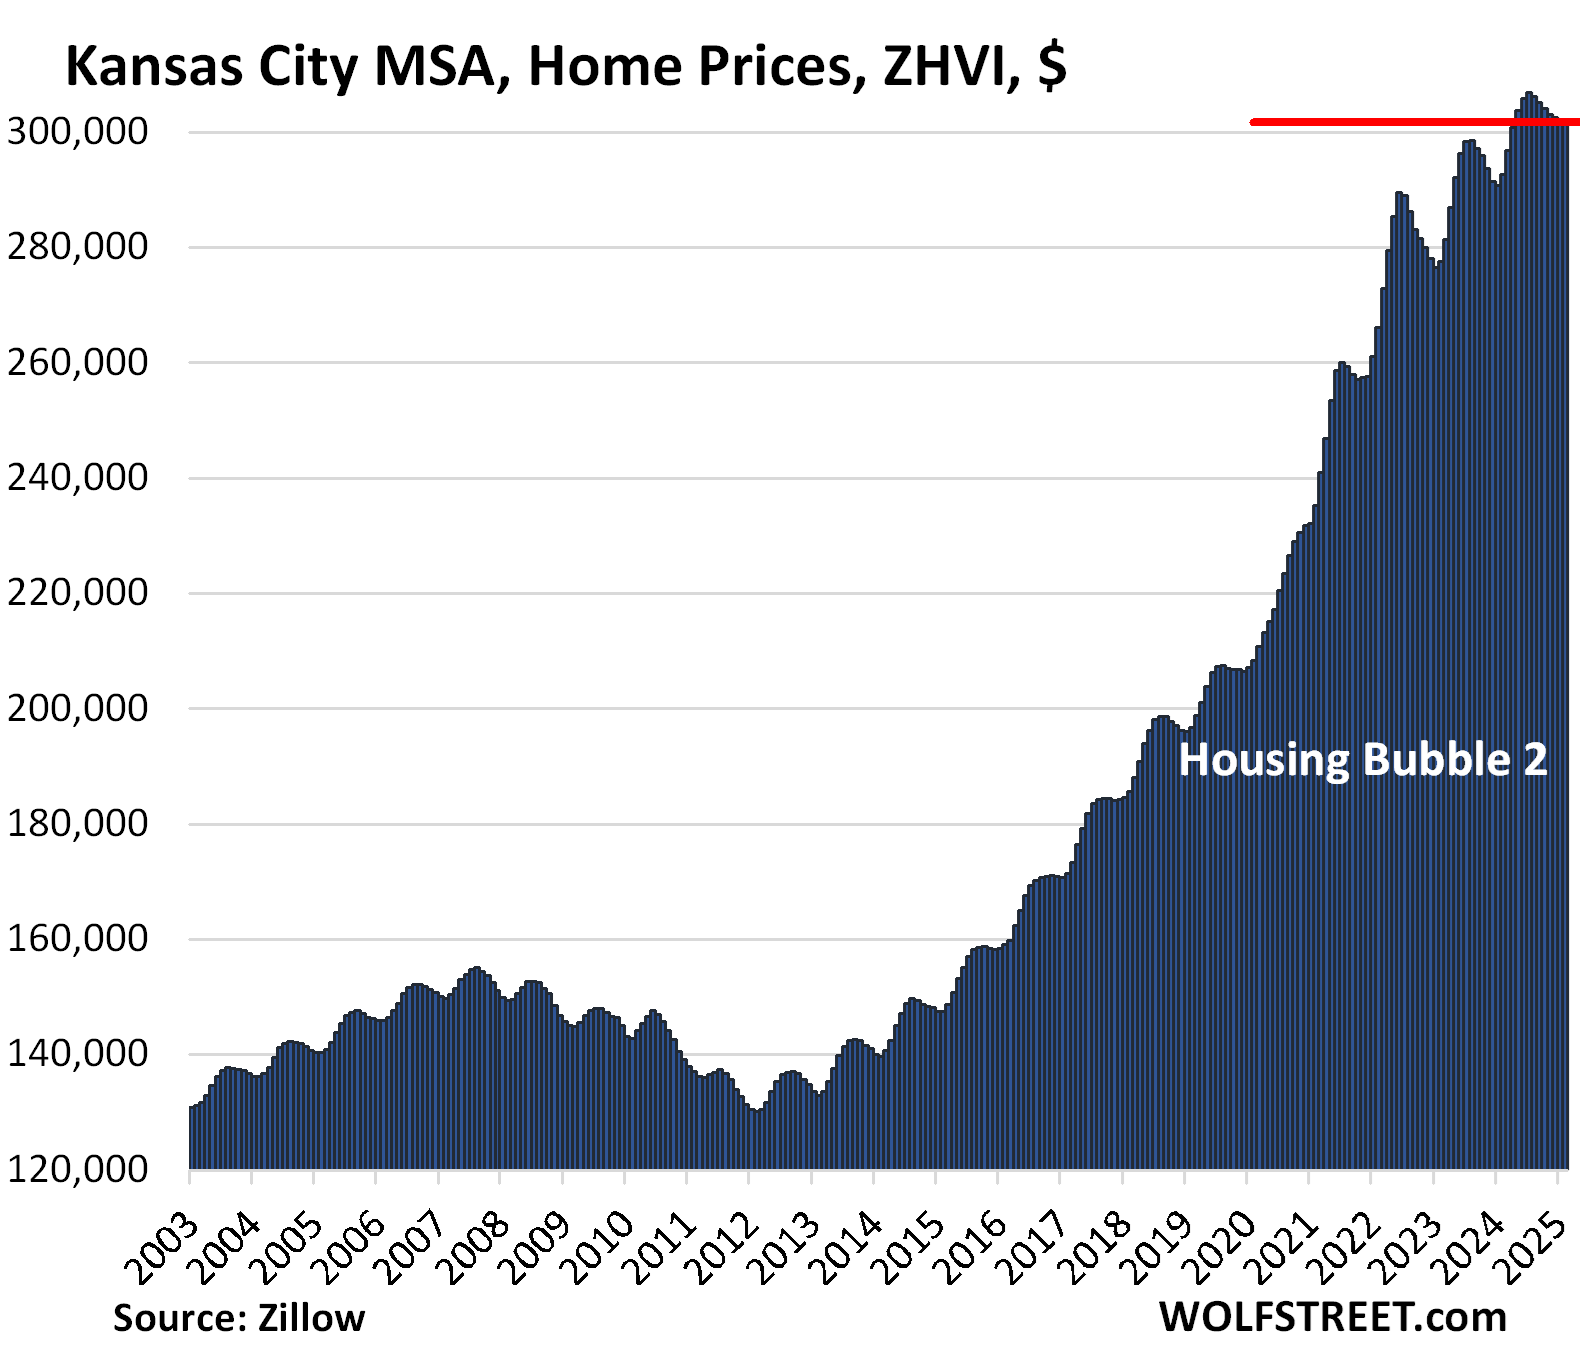
| Kansas City MSA, Home Prices | ||
| MoM | YoY | Since 2000 |
| 0.1% | 3.1% | 175% |
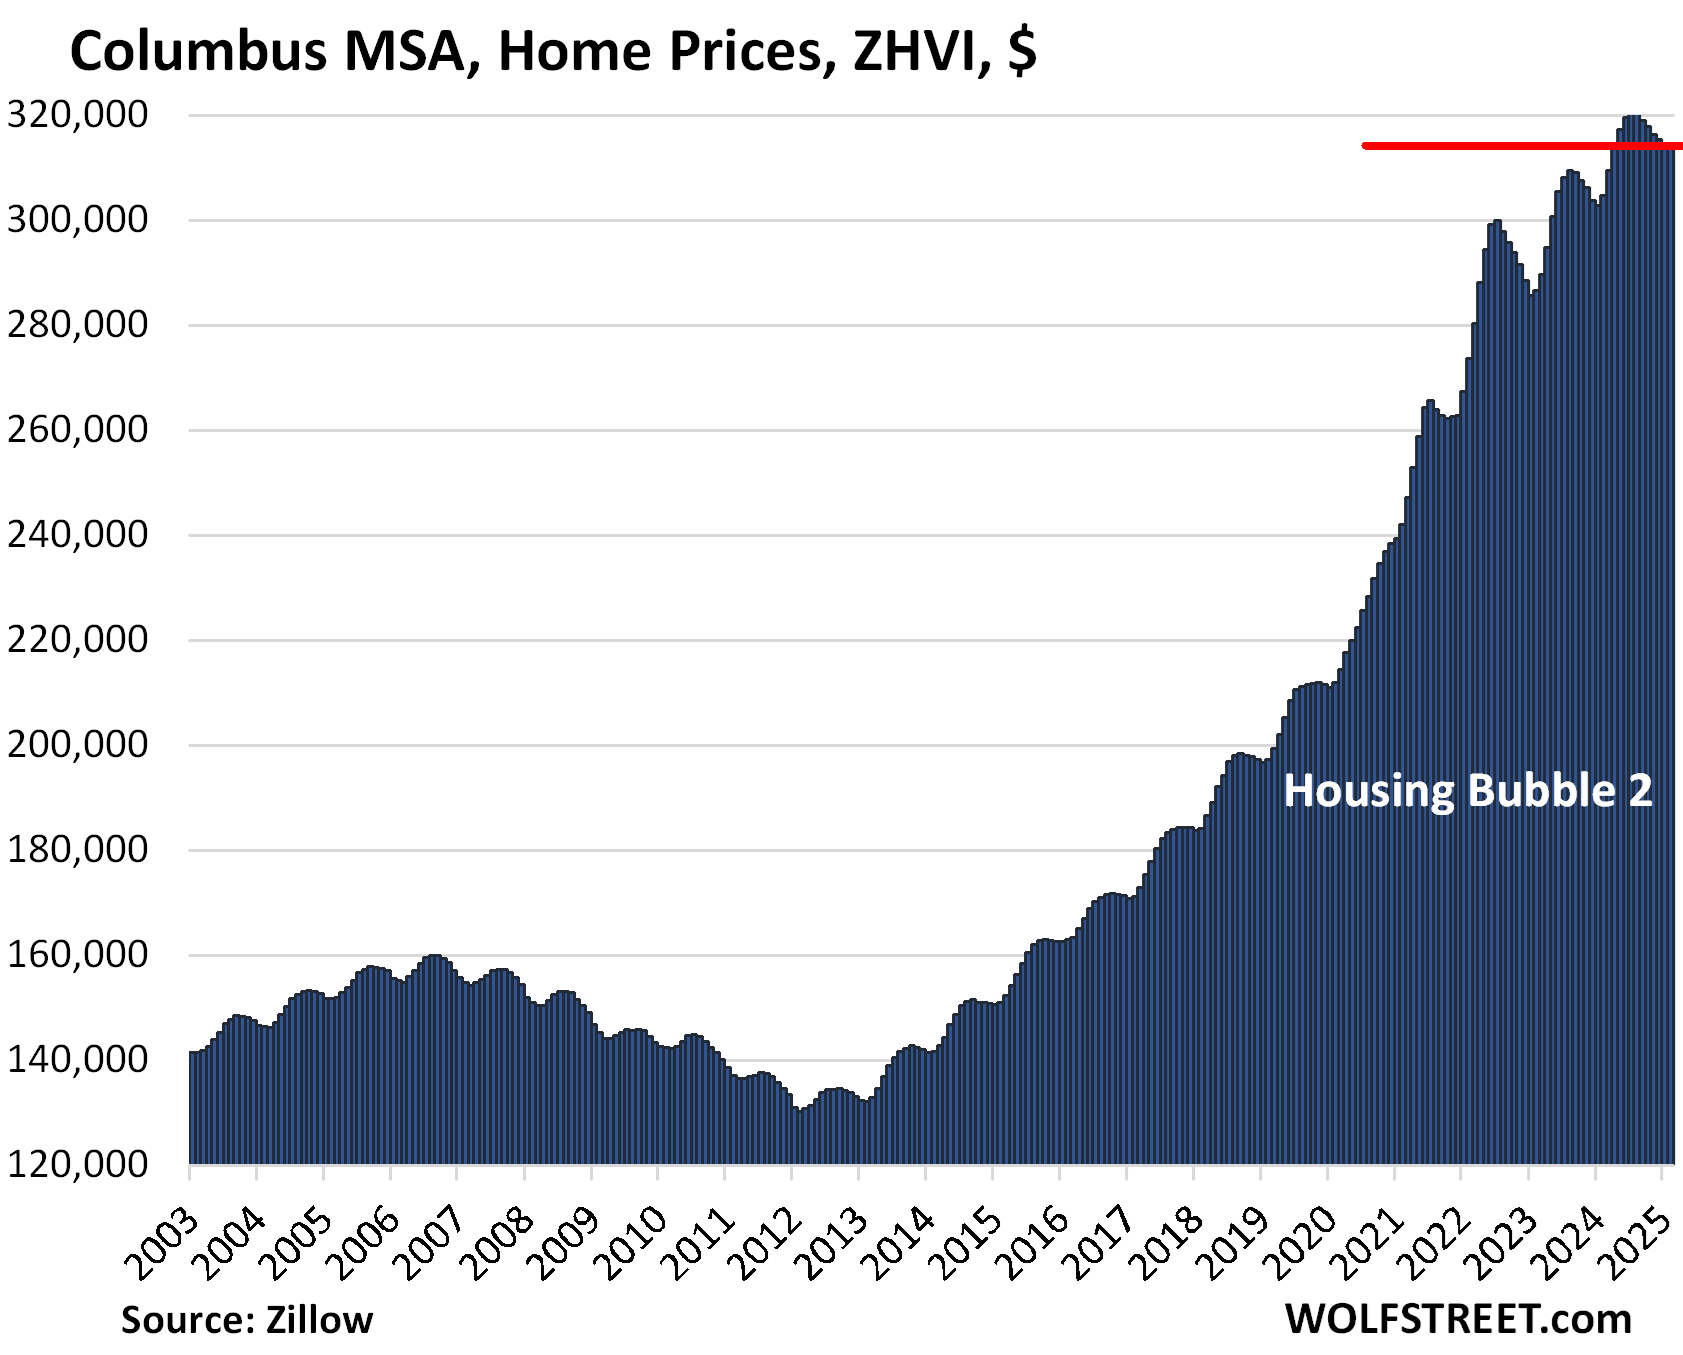
| Columbus MSA, Home Prices | ||
| MoM | YoY | Since 2000 |
| 0.0% | 3.1% | 152% |
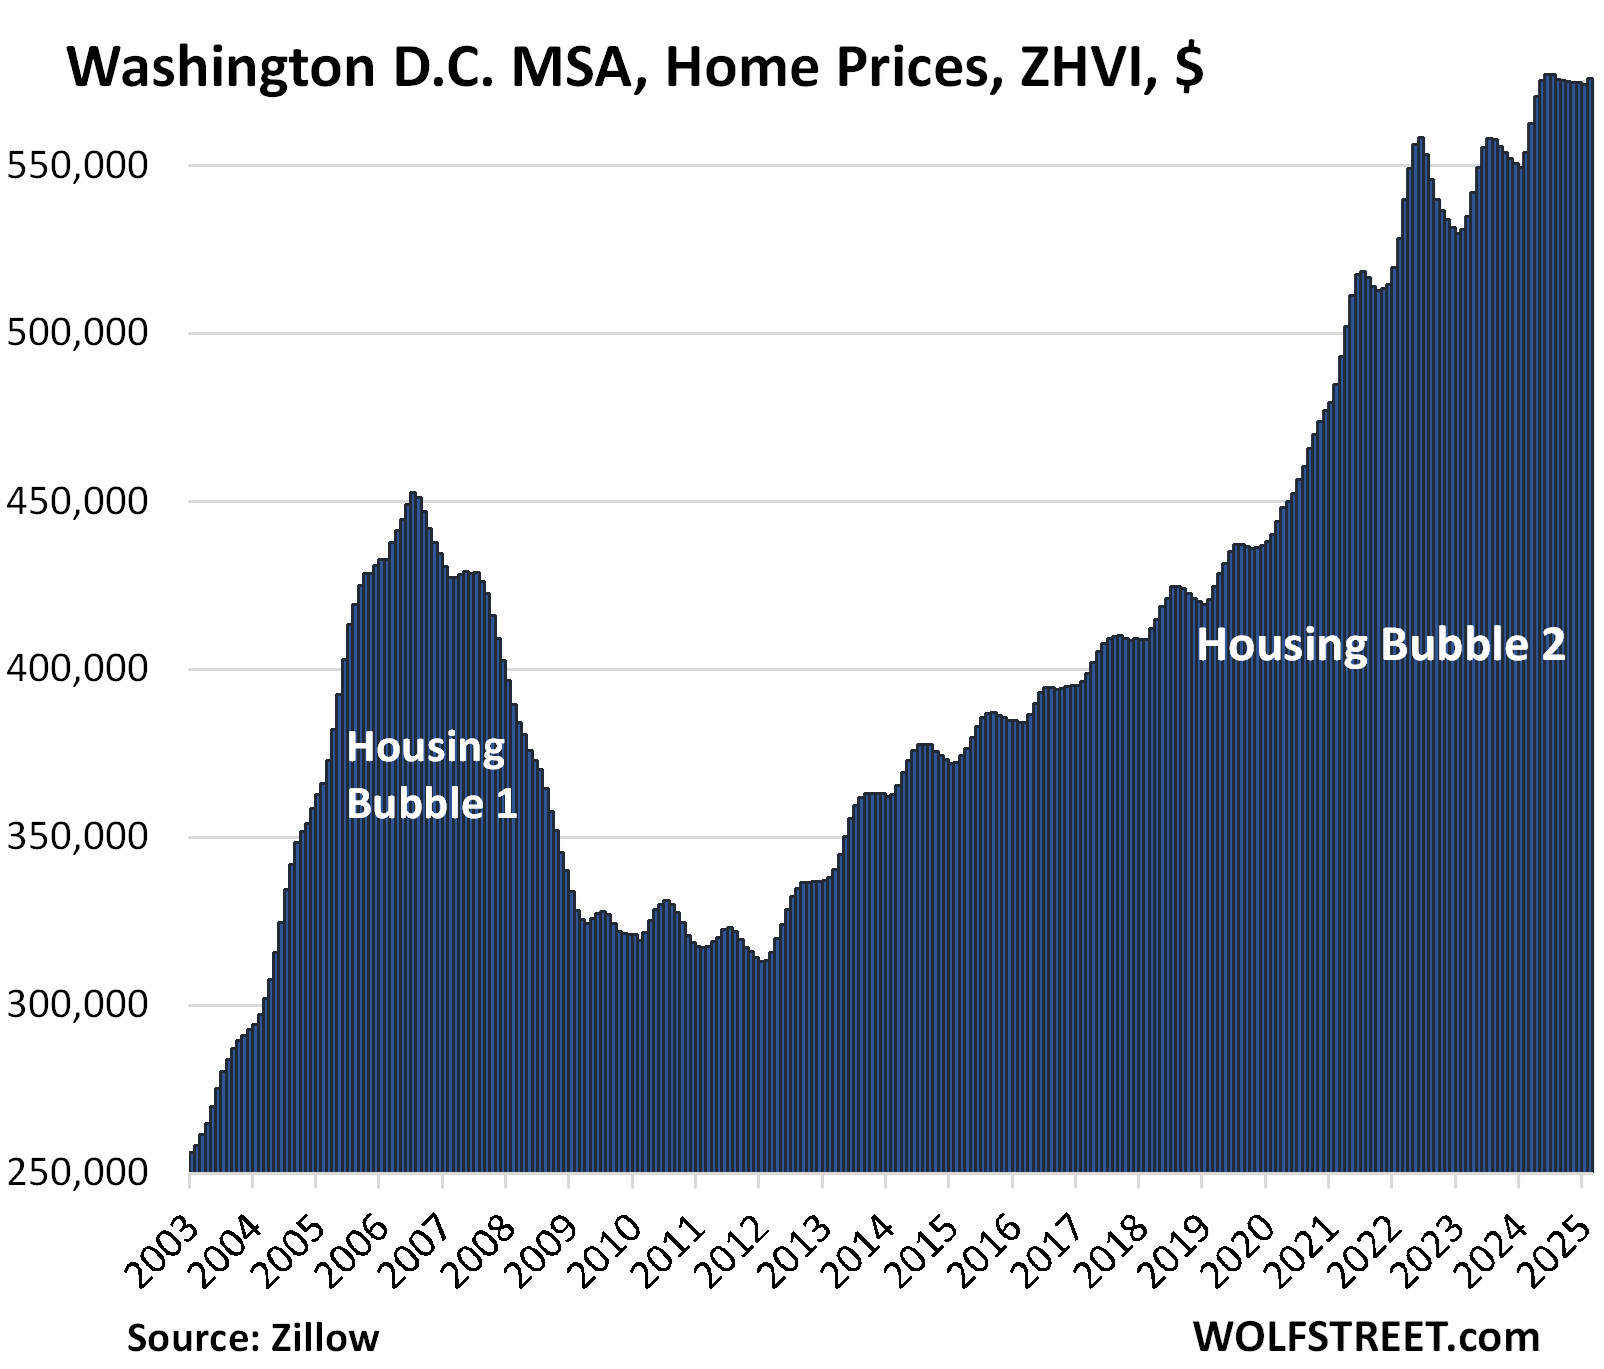
| Washington D.C. MSA, Home Prices | ||
| MoM | YoY | Since 2000 |
| 0.3% | 4.0% | 216% |
The vast and diverse metro includes Washington D.C. and parts of Maryland, Virginia, and West Virginia.
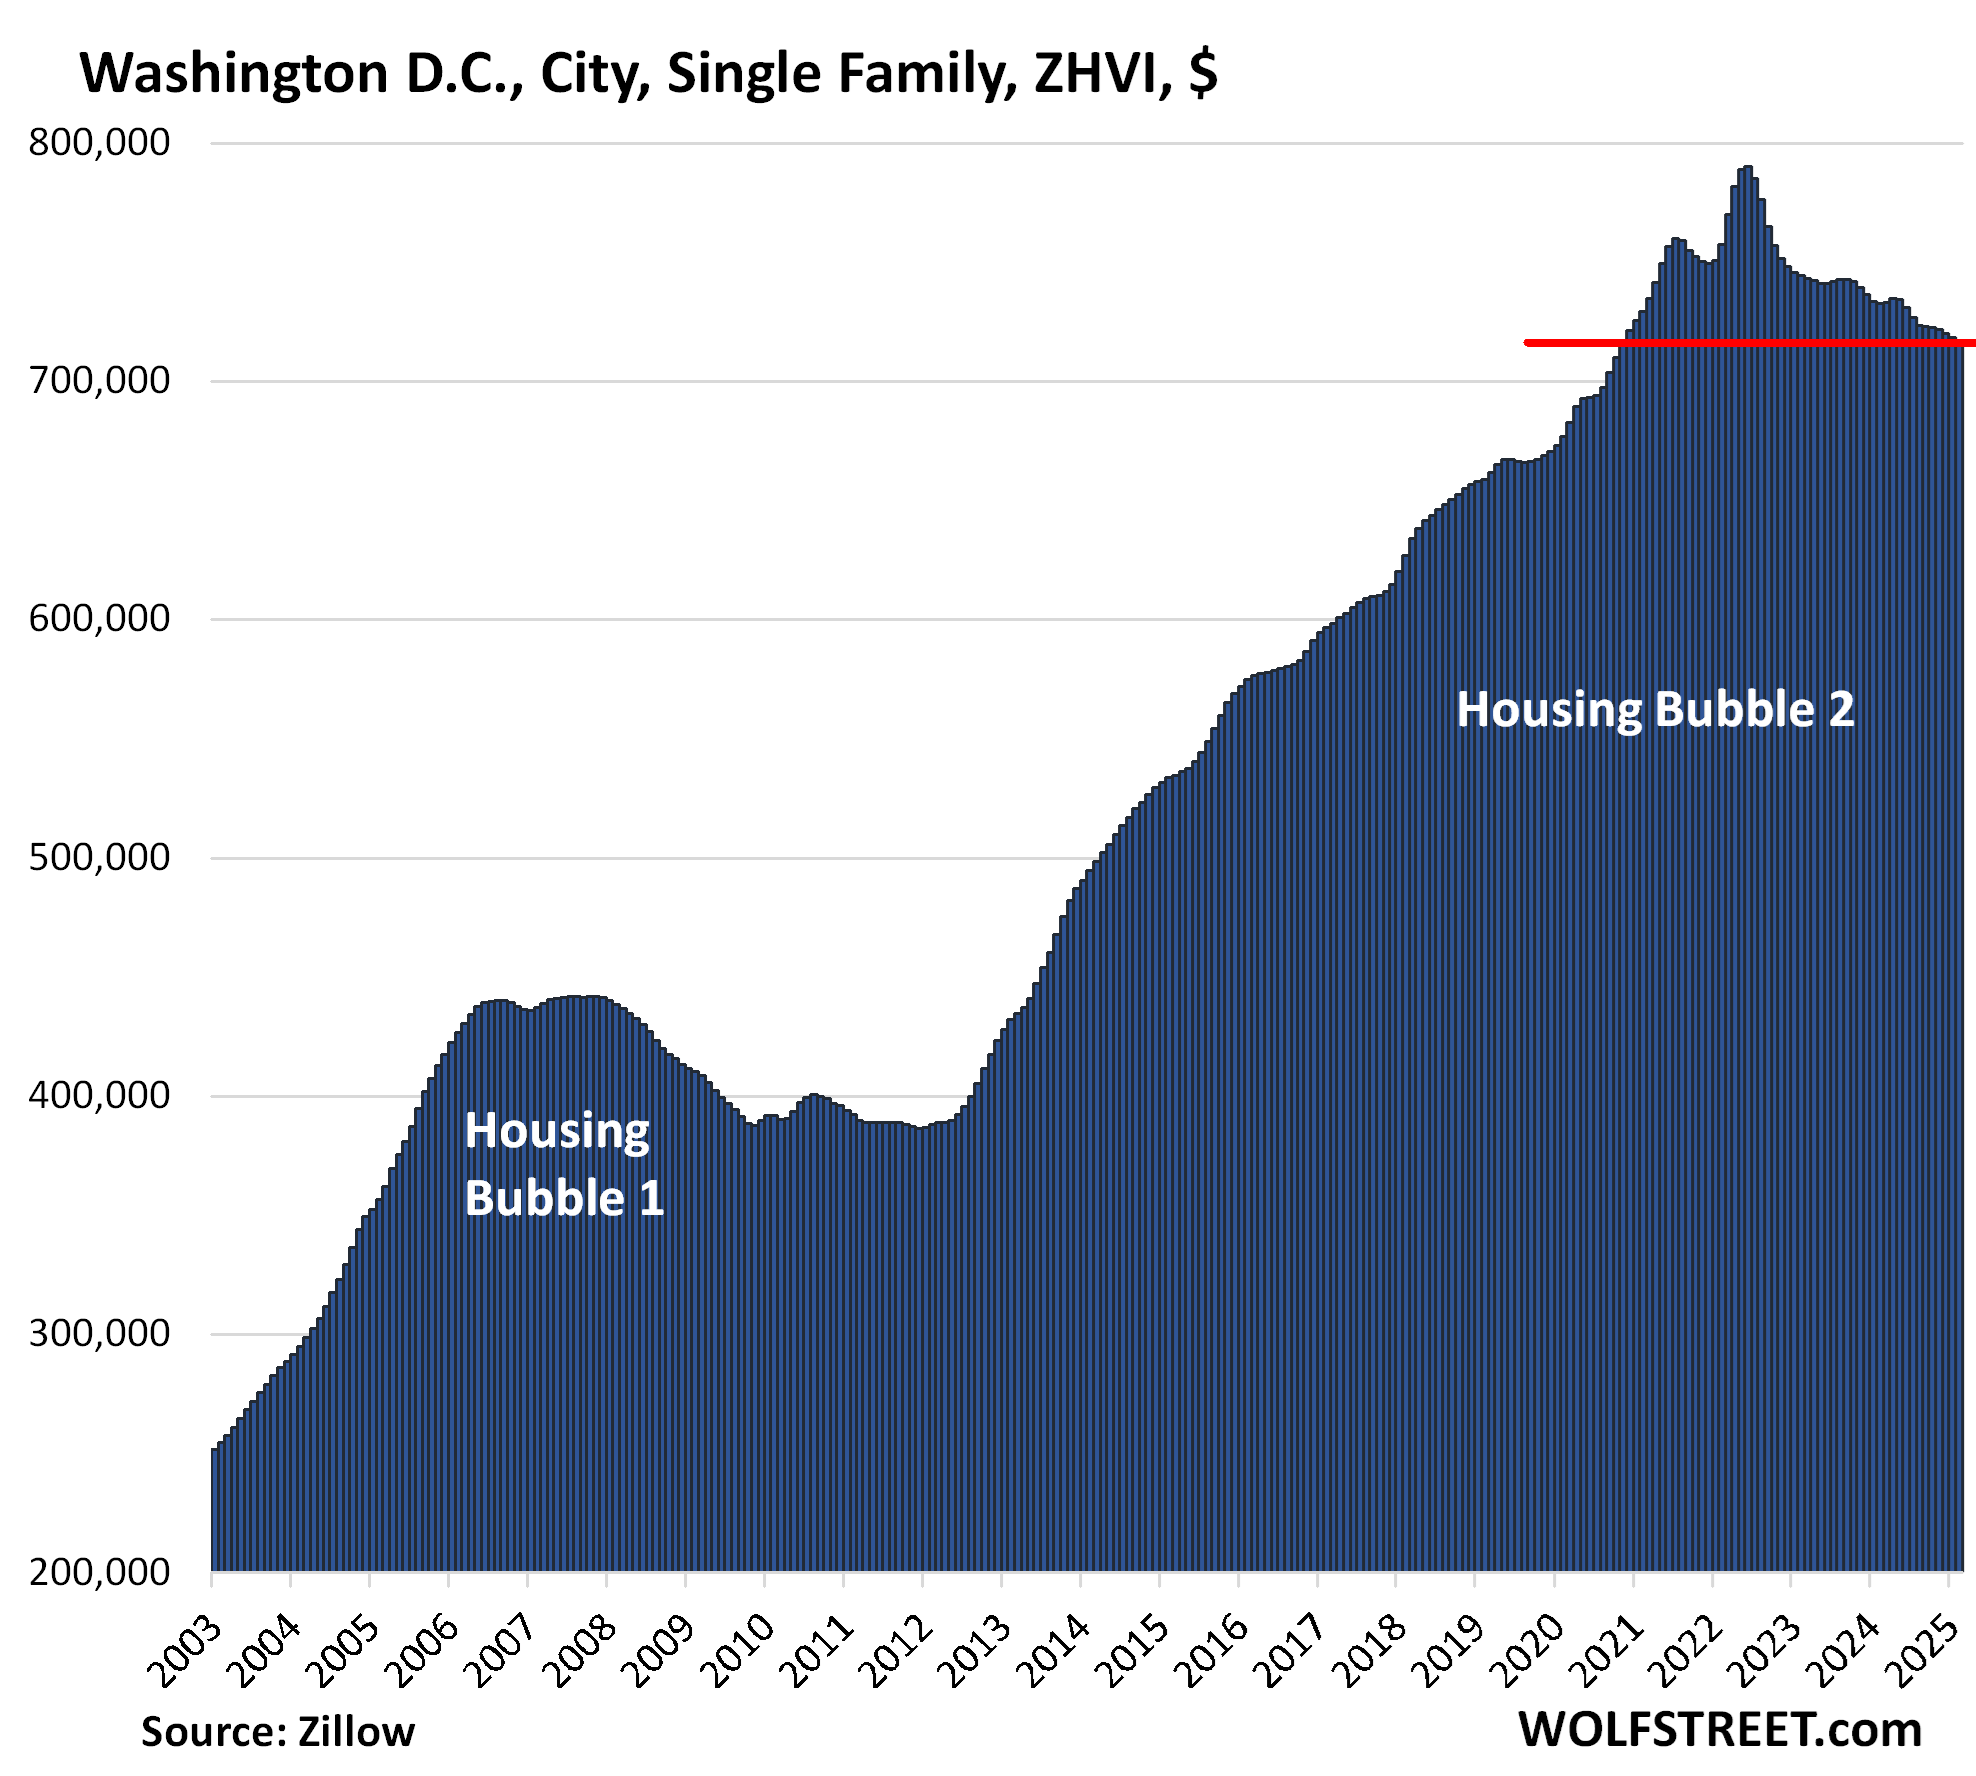
But in the city of Washington D.C., prices of single-family houses, seasonally adjusted, have dropped by 9.1% from the peak, and by 2.1% year-over-year, to the lowest level since November 2020.
The example of Washington D.C. and the D.C. MSA shows how the dynamics can differ when narrowing down to the city itself:
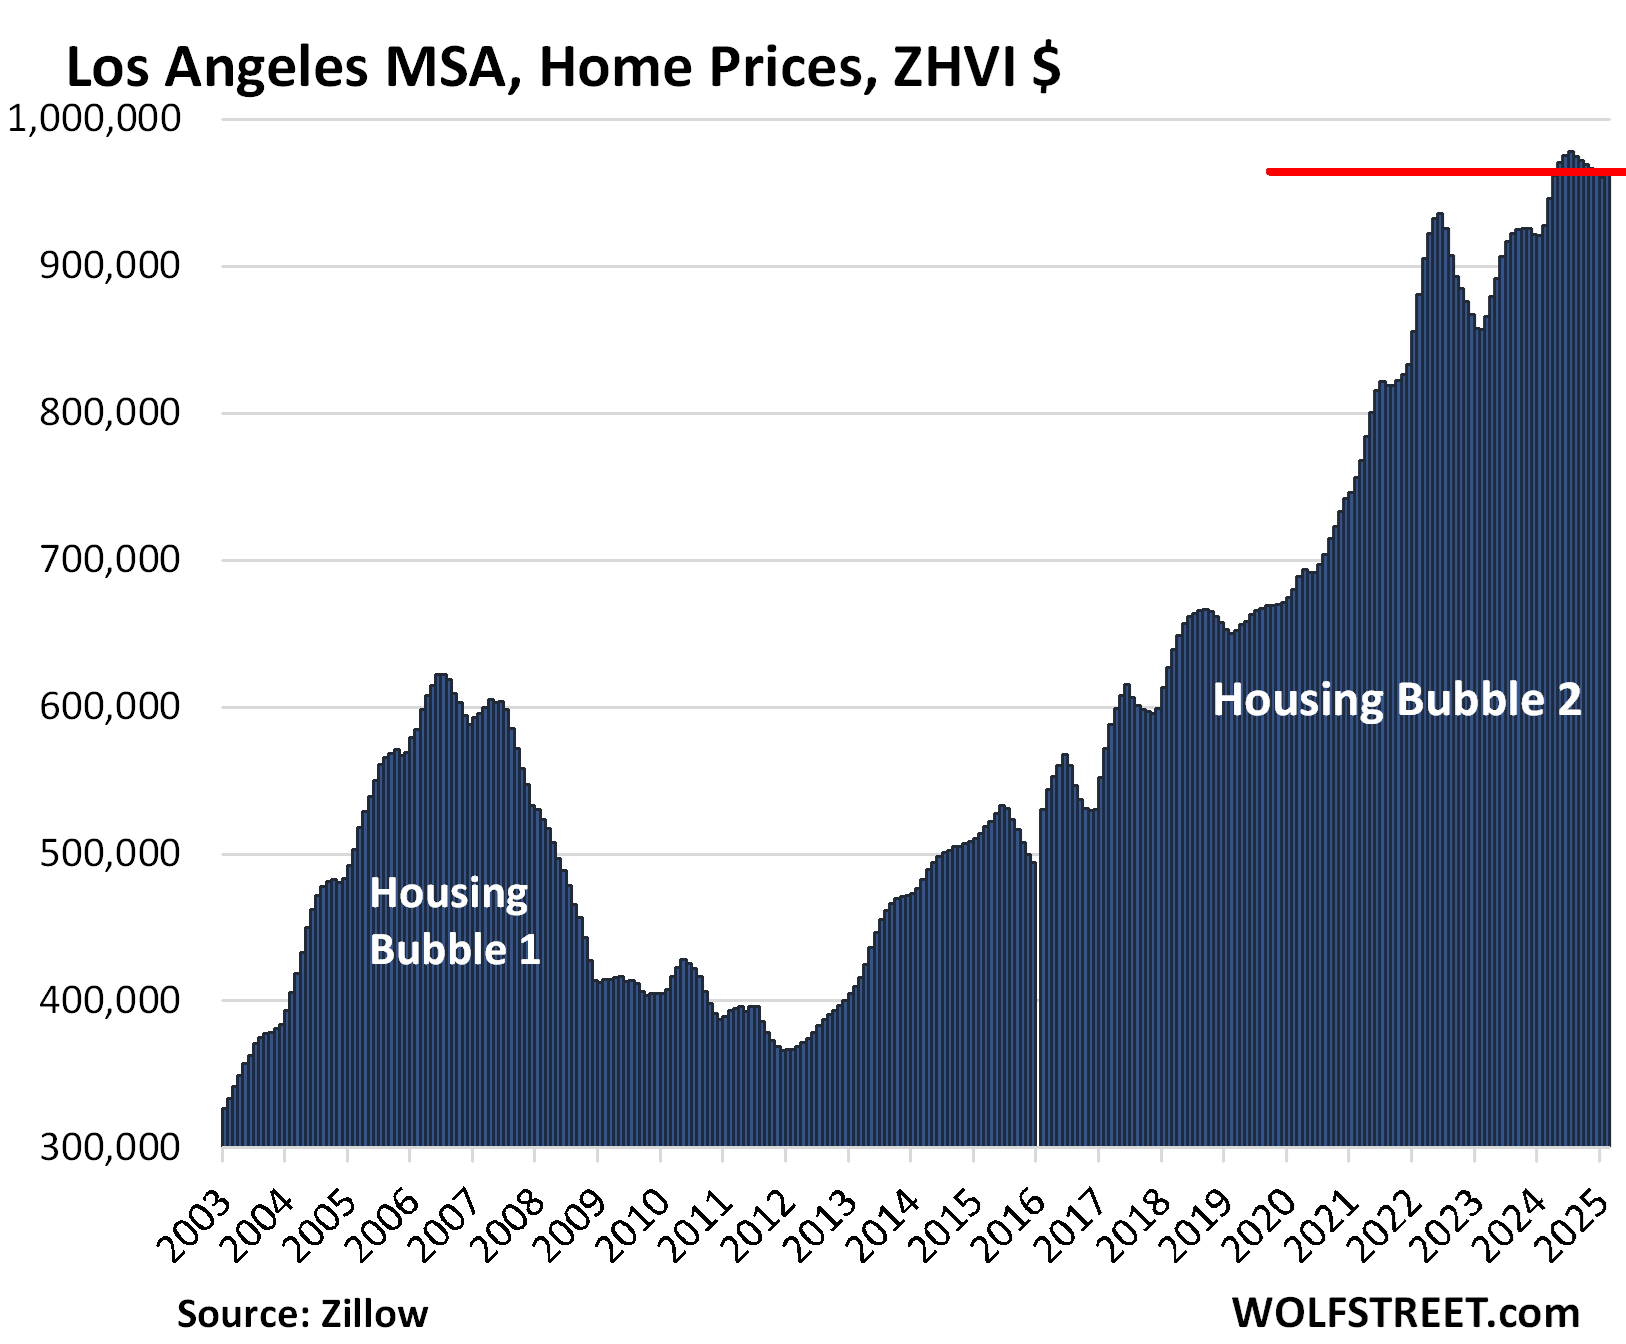
| Los Angeles MSA, Home Prices | ||
| MoM | YoY | Since 2000 |
| 0.4% | 3.9% | 329% |
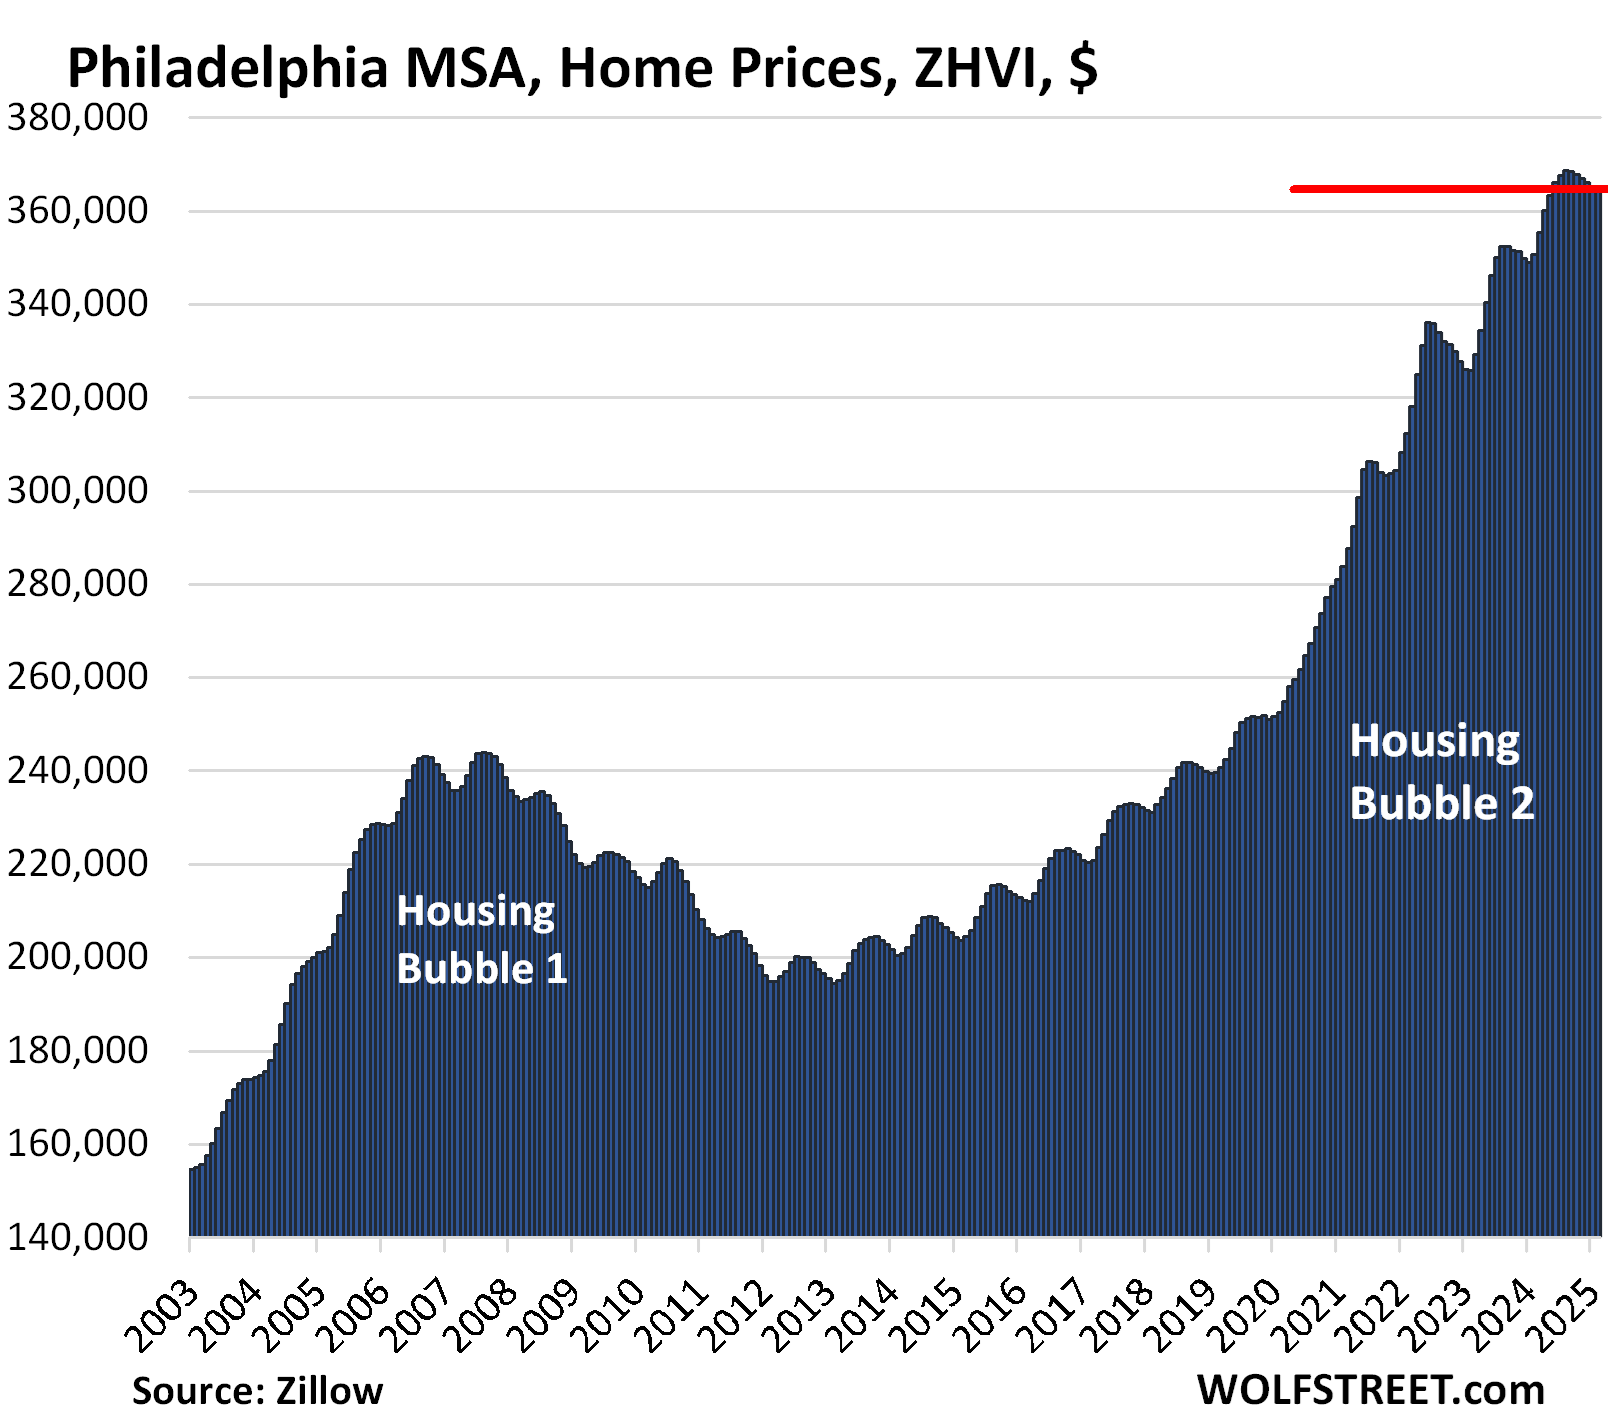
| Philadelphia MSA, Home Prices | ||
| MoM | YoY | Since 2000 |
| 0.0% | 4.1% | 199% |
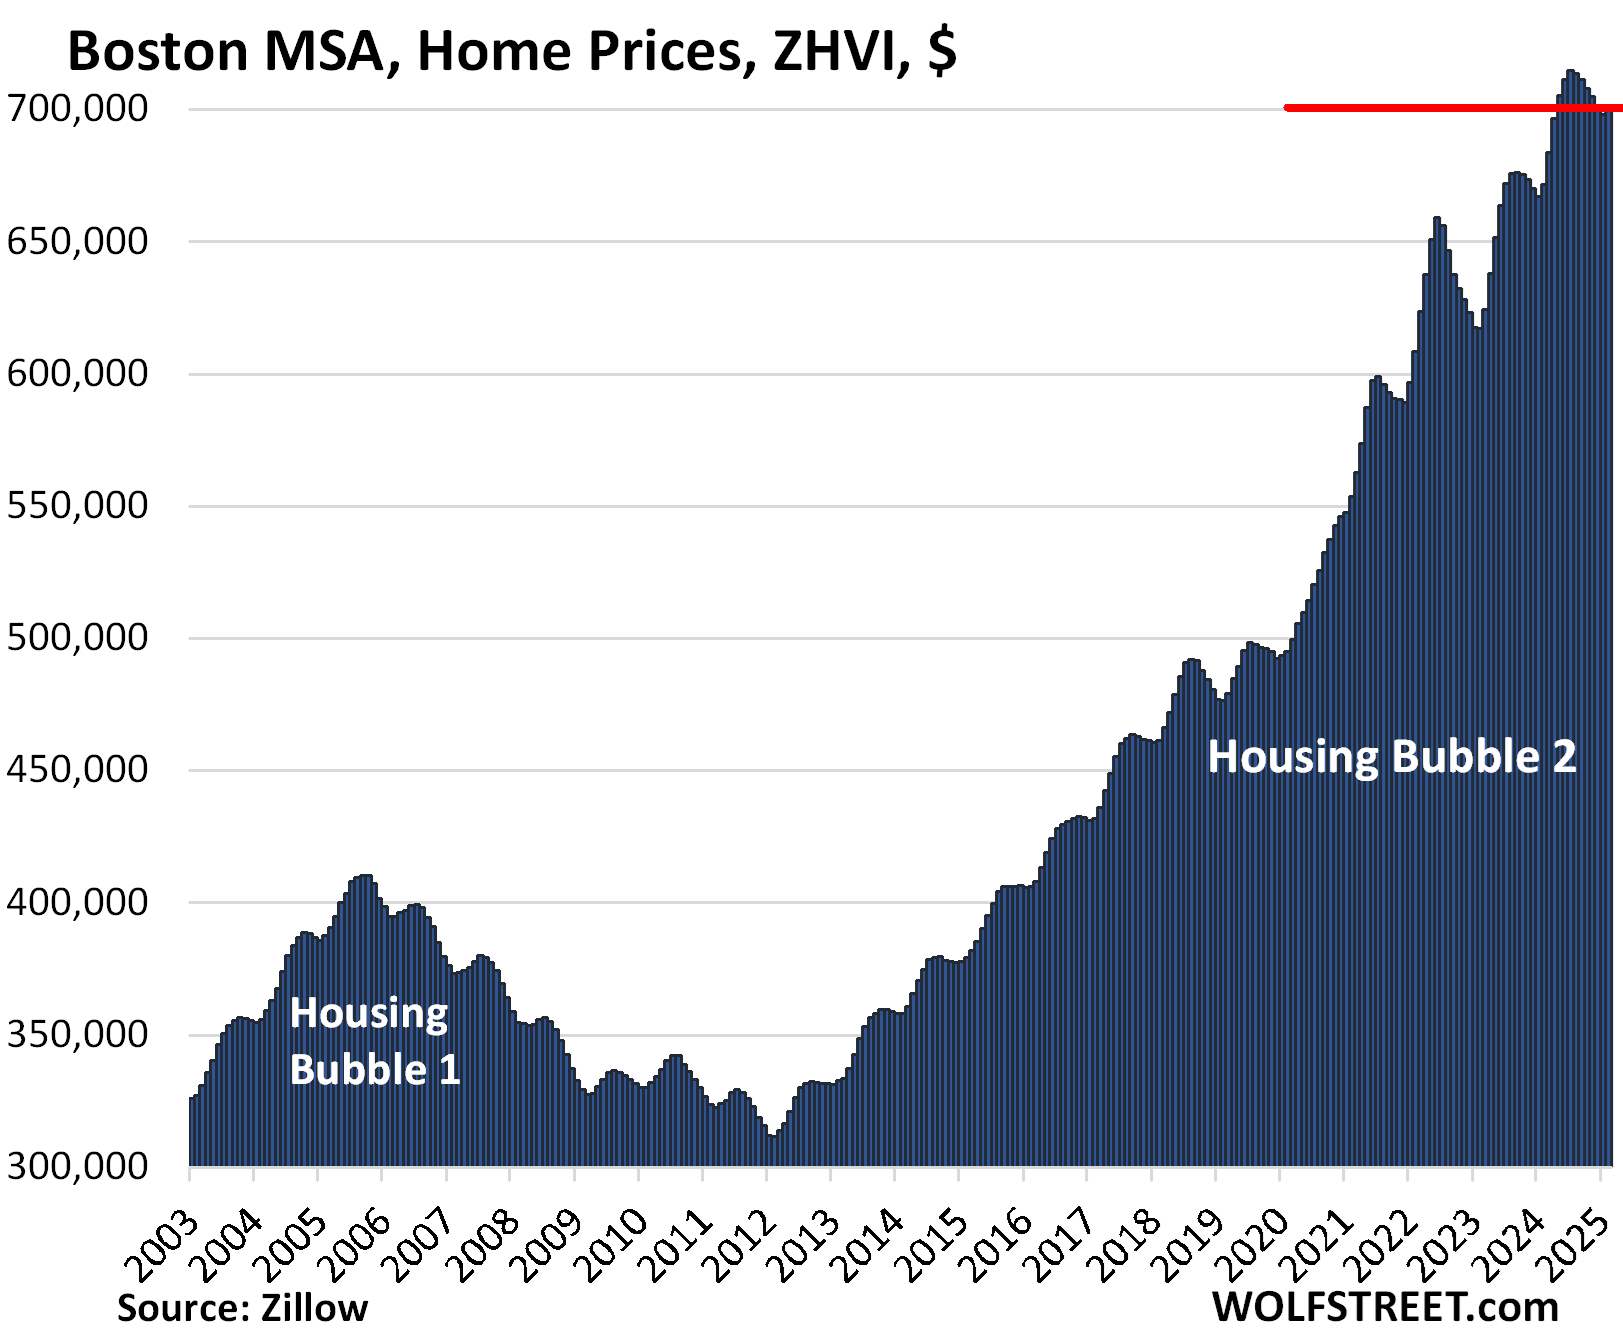
| Boston MSA, Home Prices | ||
| MoM | YoY | Since 2000 |
| 0.2% | 4.2% | 223% |
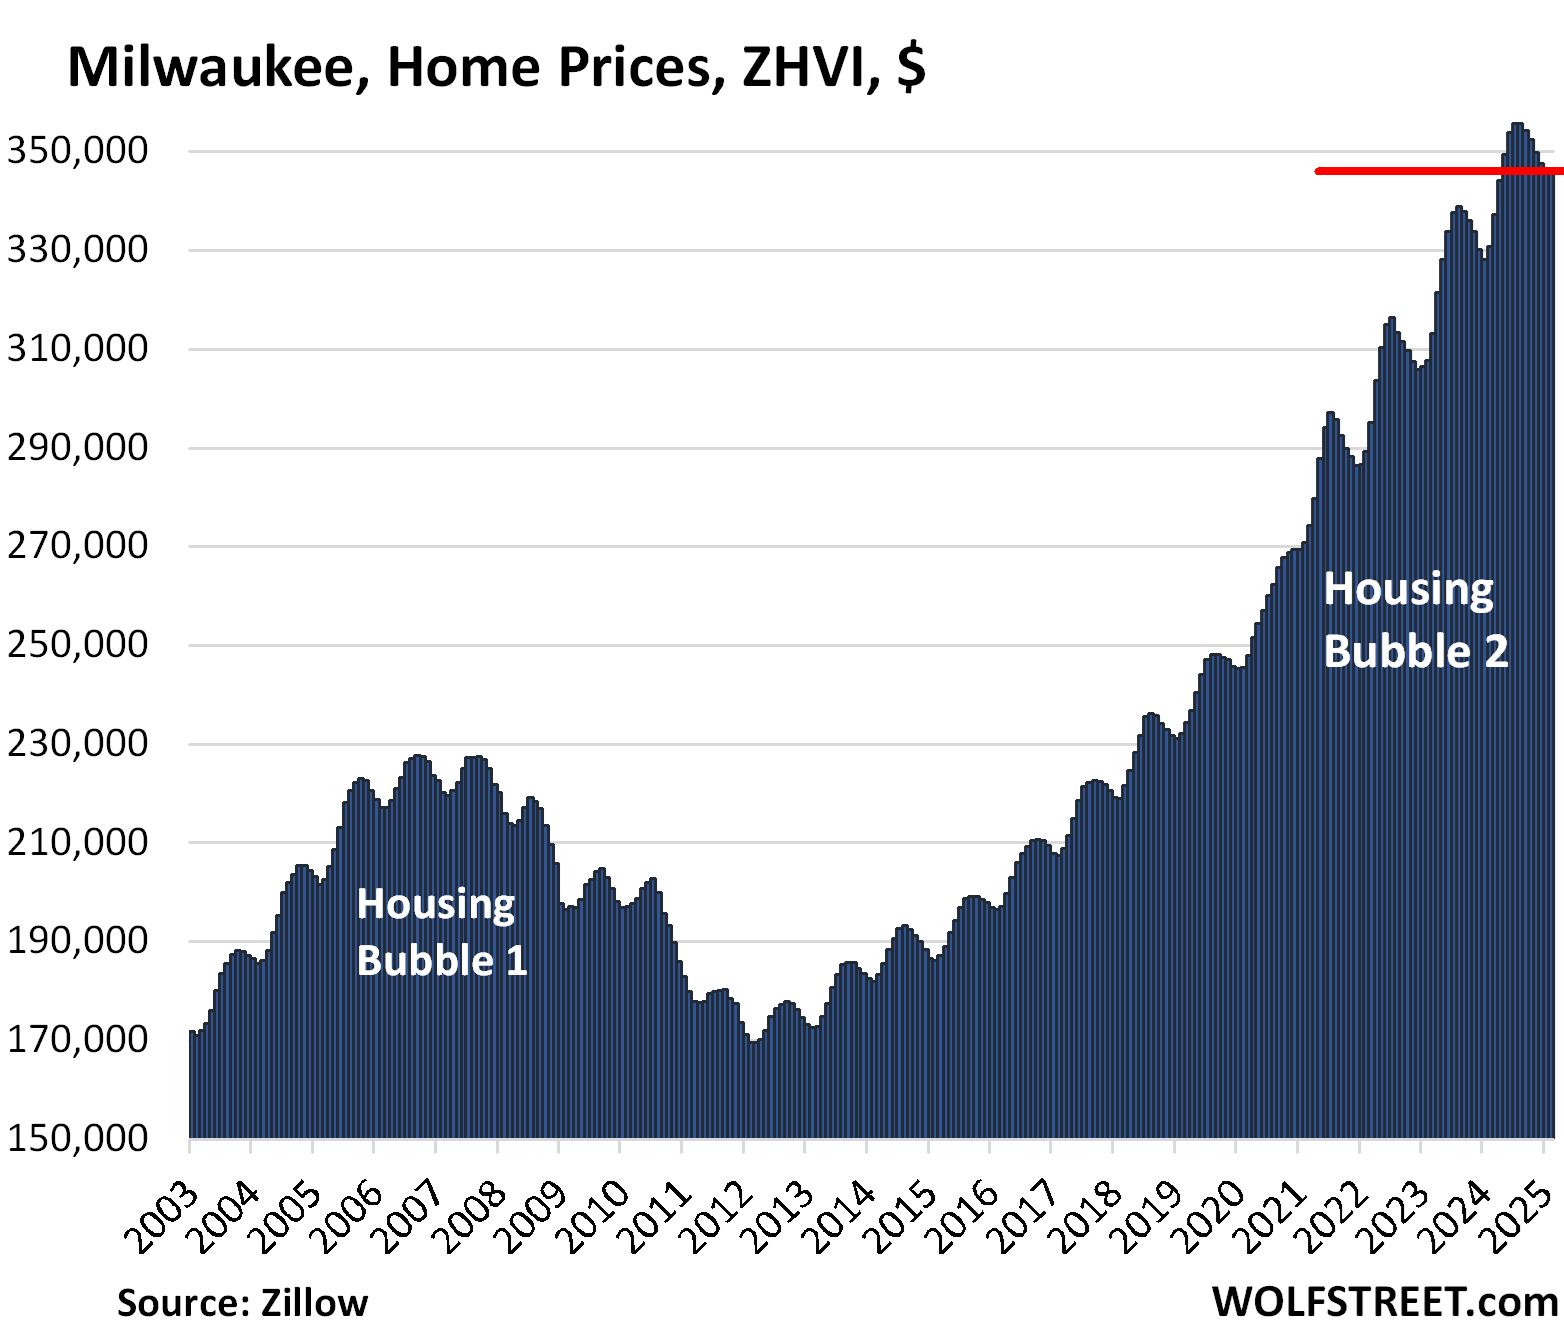
| Milwaukee MSA, Home Prices | ||
| MoM | YoY | Since 2000 |
| 0.0% | 4.7% | 141.3% |
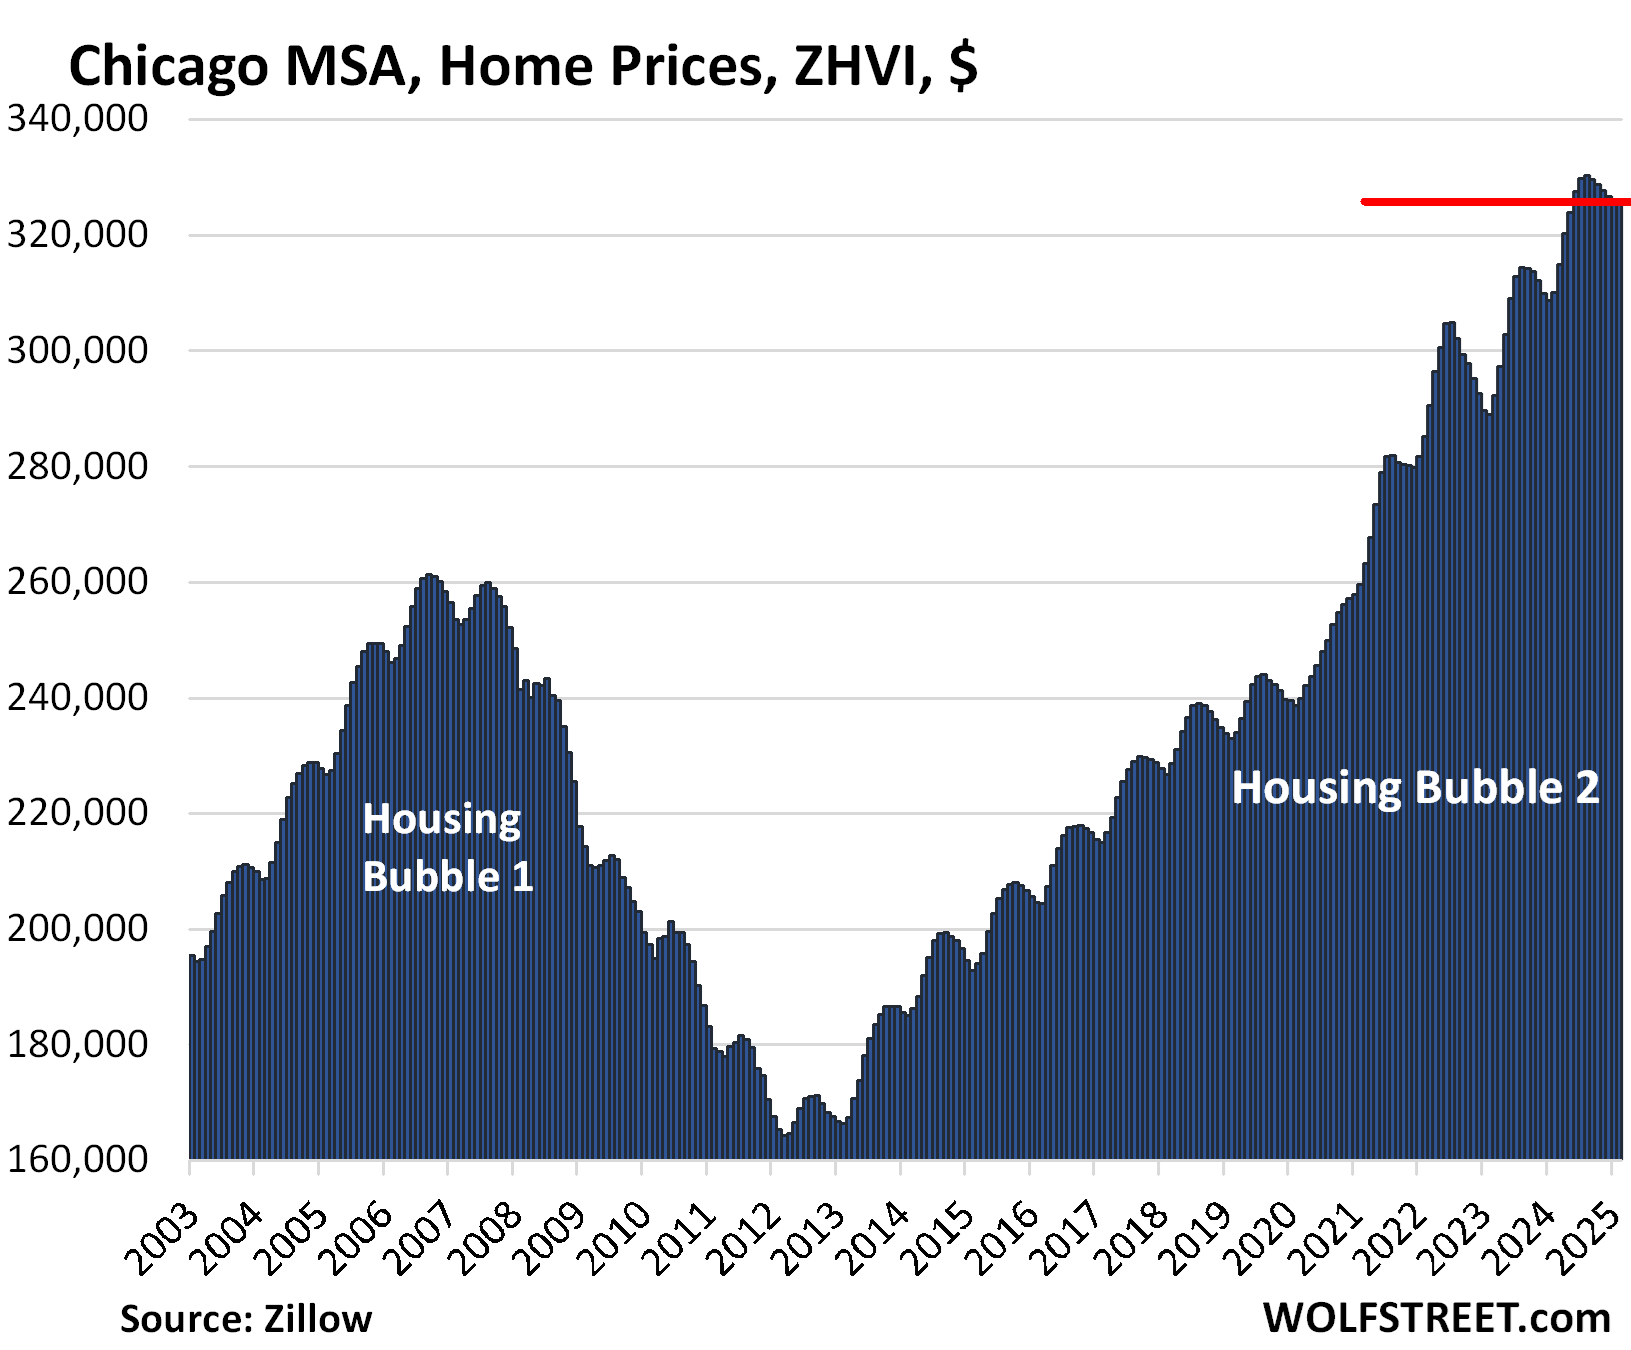
| Chicago MSA, Home Prices | ||
| MoM | YoY | Since 2000 |
| 0.1% | 5.1% | 111% |
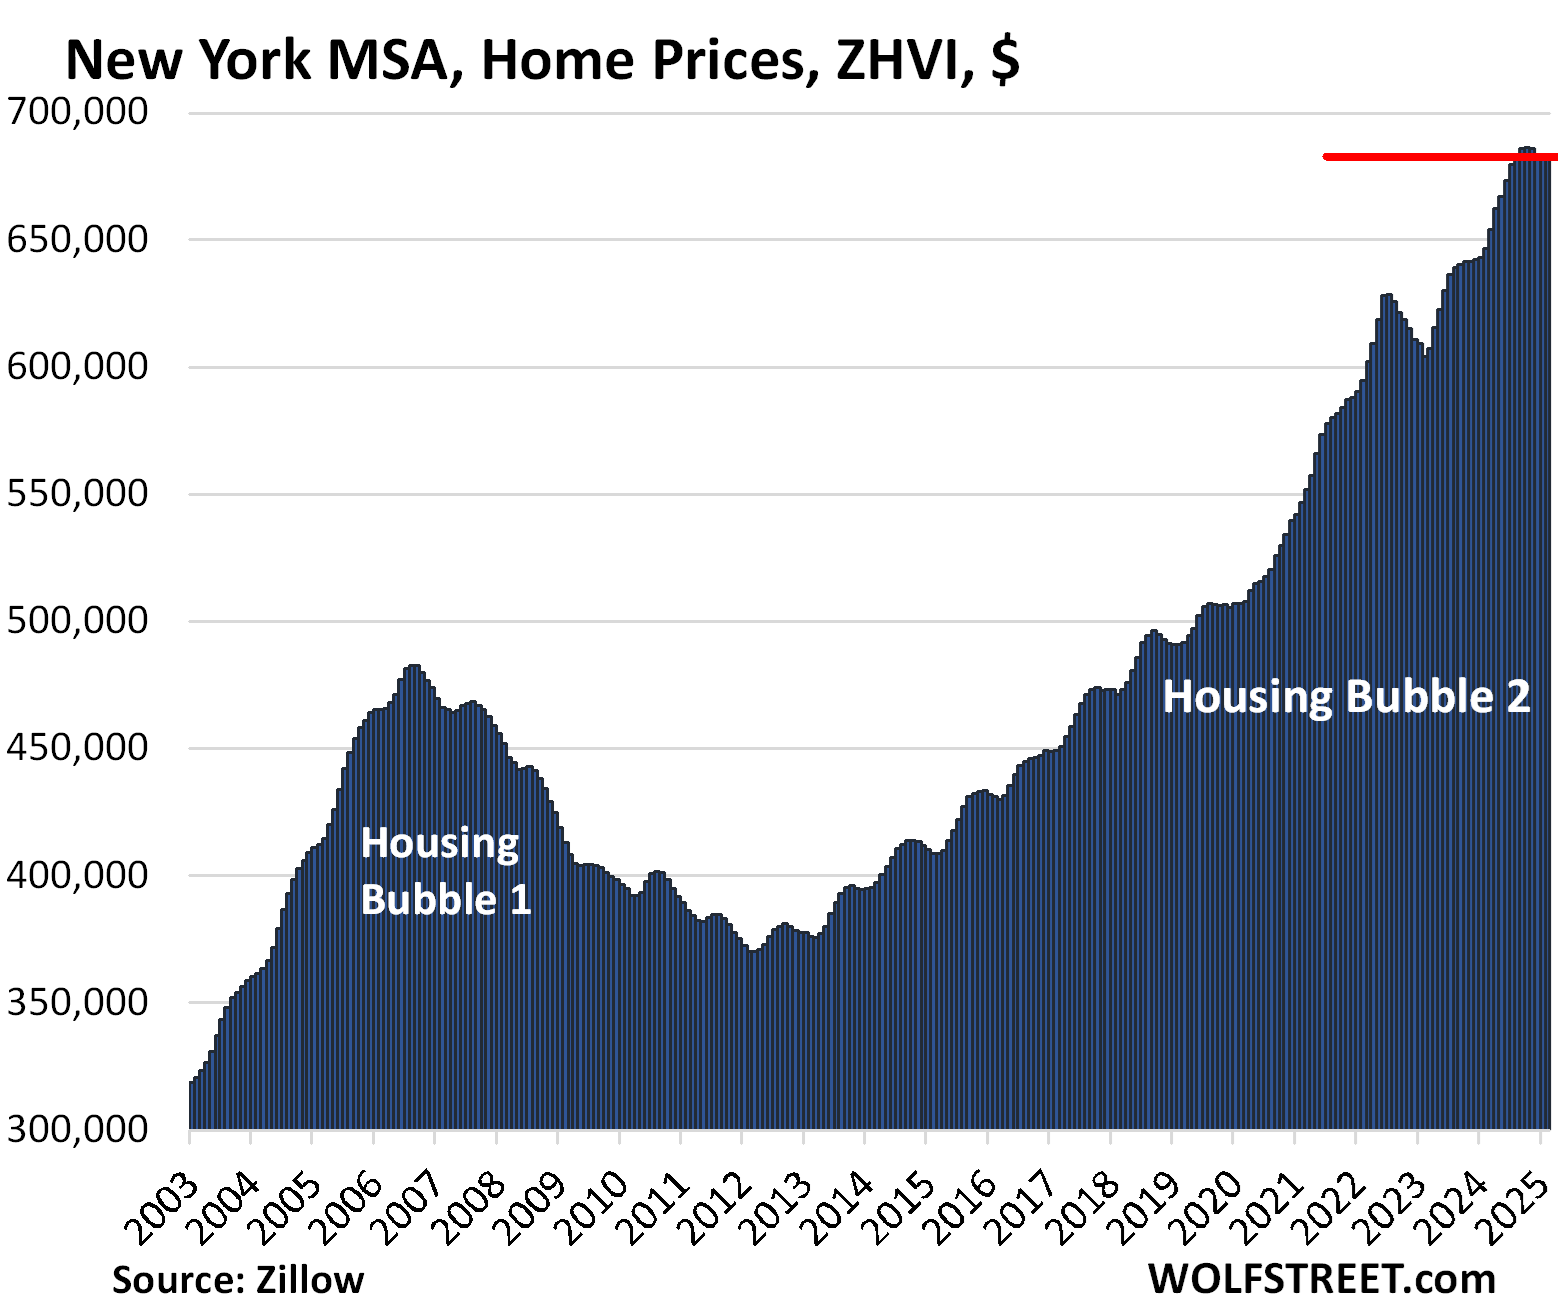
| New York MSA, Home Prices | ||
| MoM | YoY | Since 2000 |
| 0.1% | 5.6% | 210% |
Enjoy reading WOLF STREET and want to support it? You can donate. I appreciate it immensely. Click on the mug to find out how:

![]()
The post The Most Splendid Housing Bubbles in America, Feb 2025: The Price Drops & Gains of 33 Largest Costliest Housing Markets appeared first on Energy News Beat.
“}]]
Energy News Beat