[[{“value”:”
National year-over-year price gain shrinks to 0.7%. Now 18 of 33 metros have YoY price drops: San Diego, Austin, Tampa, Miami, San Francisco, San Antonio, Dallas, Phoenix, Orlando, Atlanta, Denver, Raleigh, Houston, Birmingham, Charlotte… YoY gains shrink in Los Angeles, Boston, Chicago, New York, Philadelphia, Columbus…
By Wolf Richter for WOLF STREET.
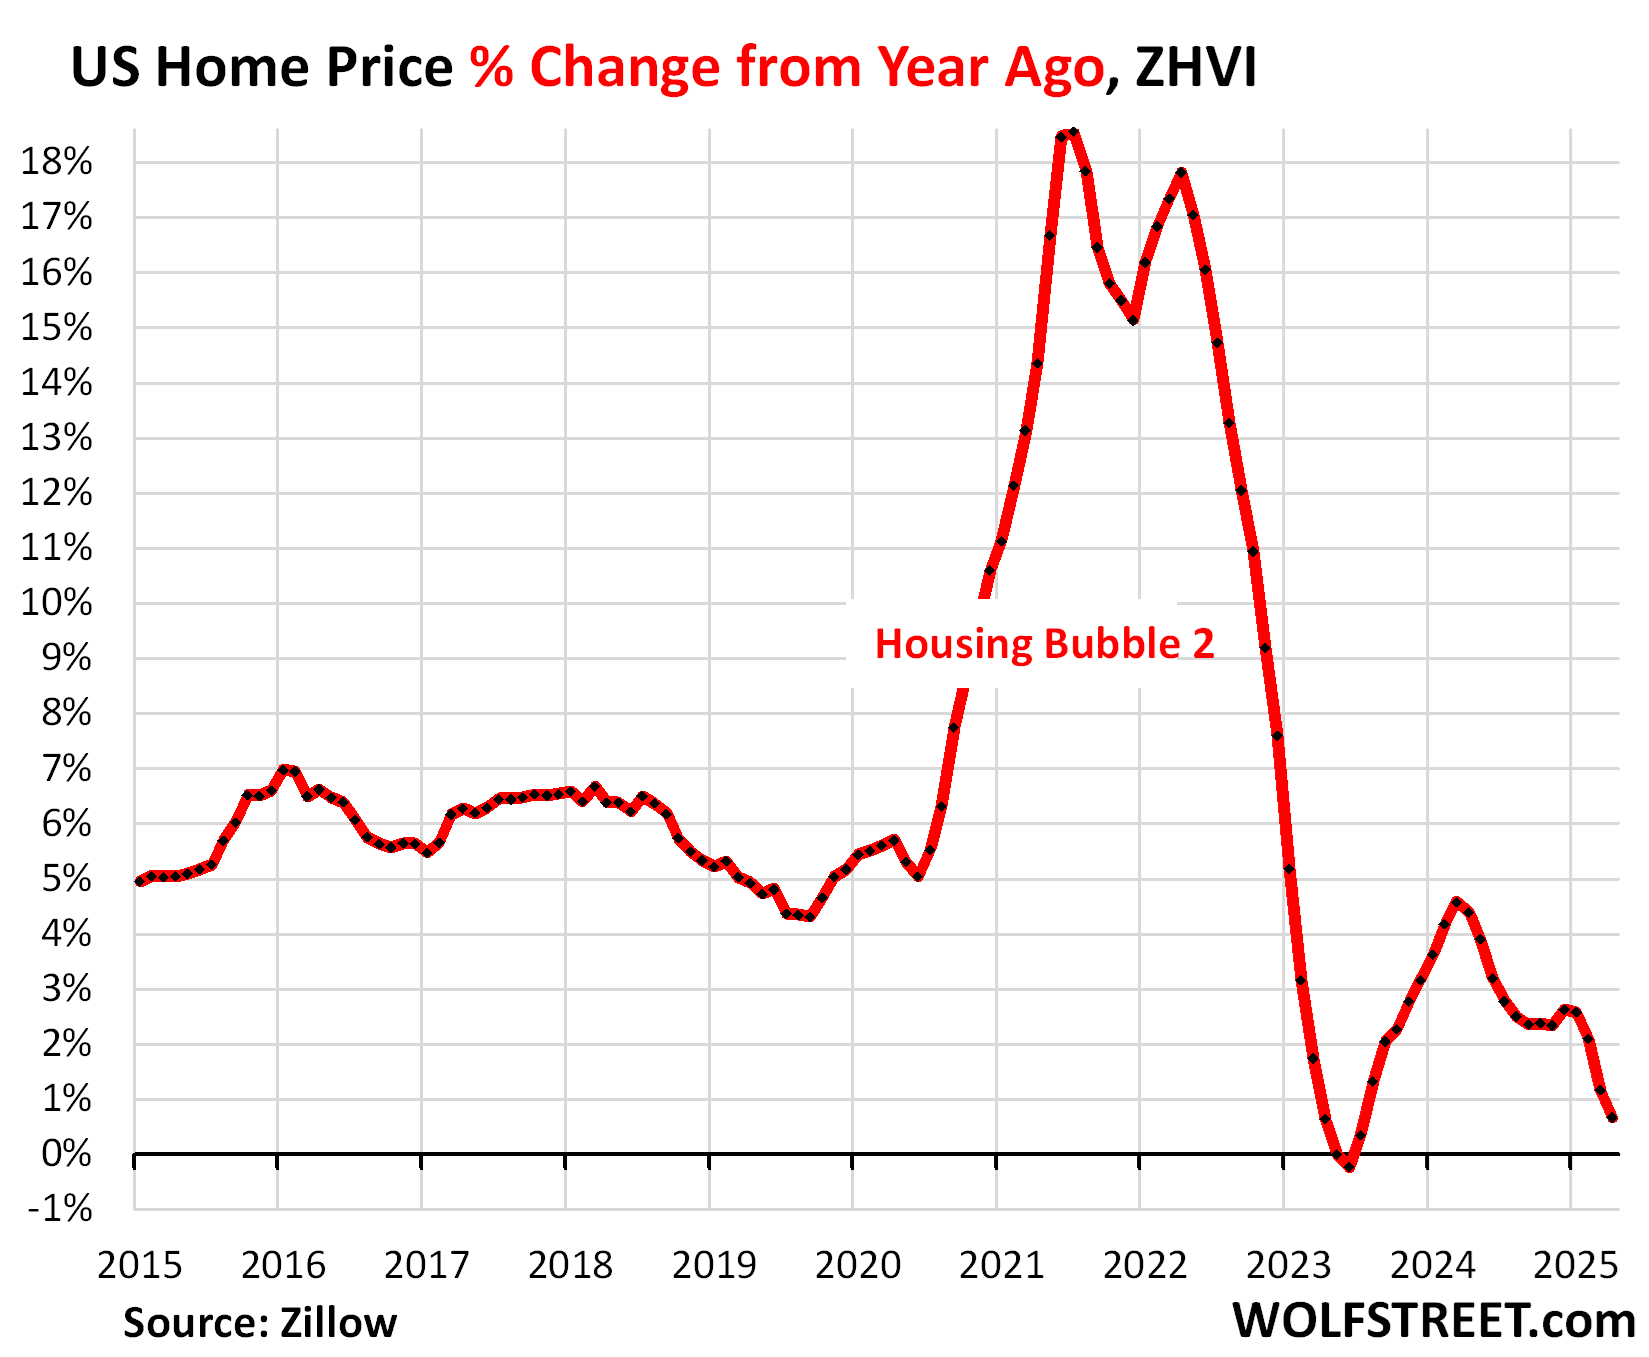
This is spring selling season when home prices in many markets rise sharply after declining during the winter, and they did so a year ago, and two years ago. But in April, prices of single-family mid-tier houses, condos, and co-ops across the US rose only 0.65% from the prior month, much less than in April 2024 (+1.15%) and in April 2023 (+1.34%). And in March, they rose only 0.21% from the prior month, much less than in March 2024 (+1.14%) and in March 2024 (+0.75%). A similar pattern played out in February.
This much smaller month-to-month price increase in April caused the year-over-year price gain in homes across the US to get whittled down to just 0.65%, continuing the trend of lower year-over-year gains.
In 18 of our 33 large and expensive housing markets, prices are already down year-over-year. And a bunch of them are in fairly steep declines from their respective peaks. Even in San Diego, prices declined year-over-year as active listings ballooned by 70% year-over-year while demand has plunged.
The growing list of Down Year-over-Year.
Similar scenarios played out in the 33 Metropolitan Statistical Areas (MSA) here: Month-to-month gains in April – if any – were smaller than a year earlier. And the group here whose prices declined year-over-year expanded in April to 18 (from 14 in March, and from 7 in February).
Year-over-year declines in April:
- Austin: -5.1%
- Tampa: -5.0%
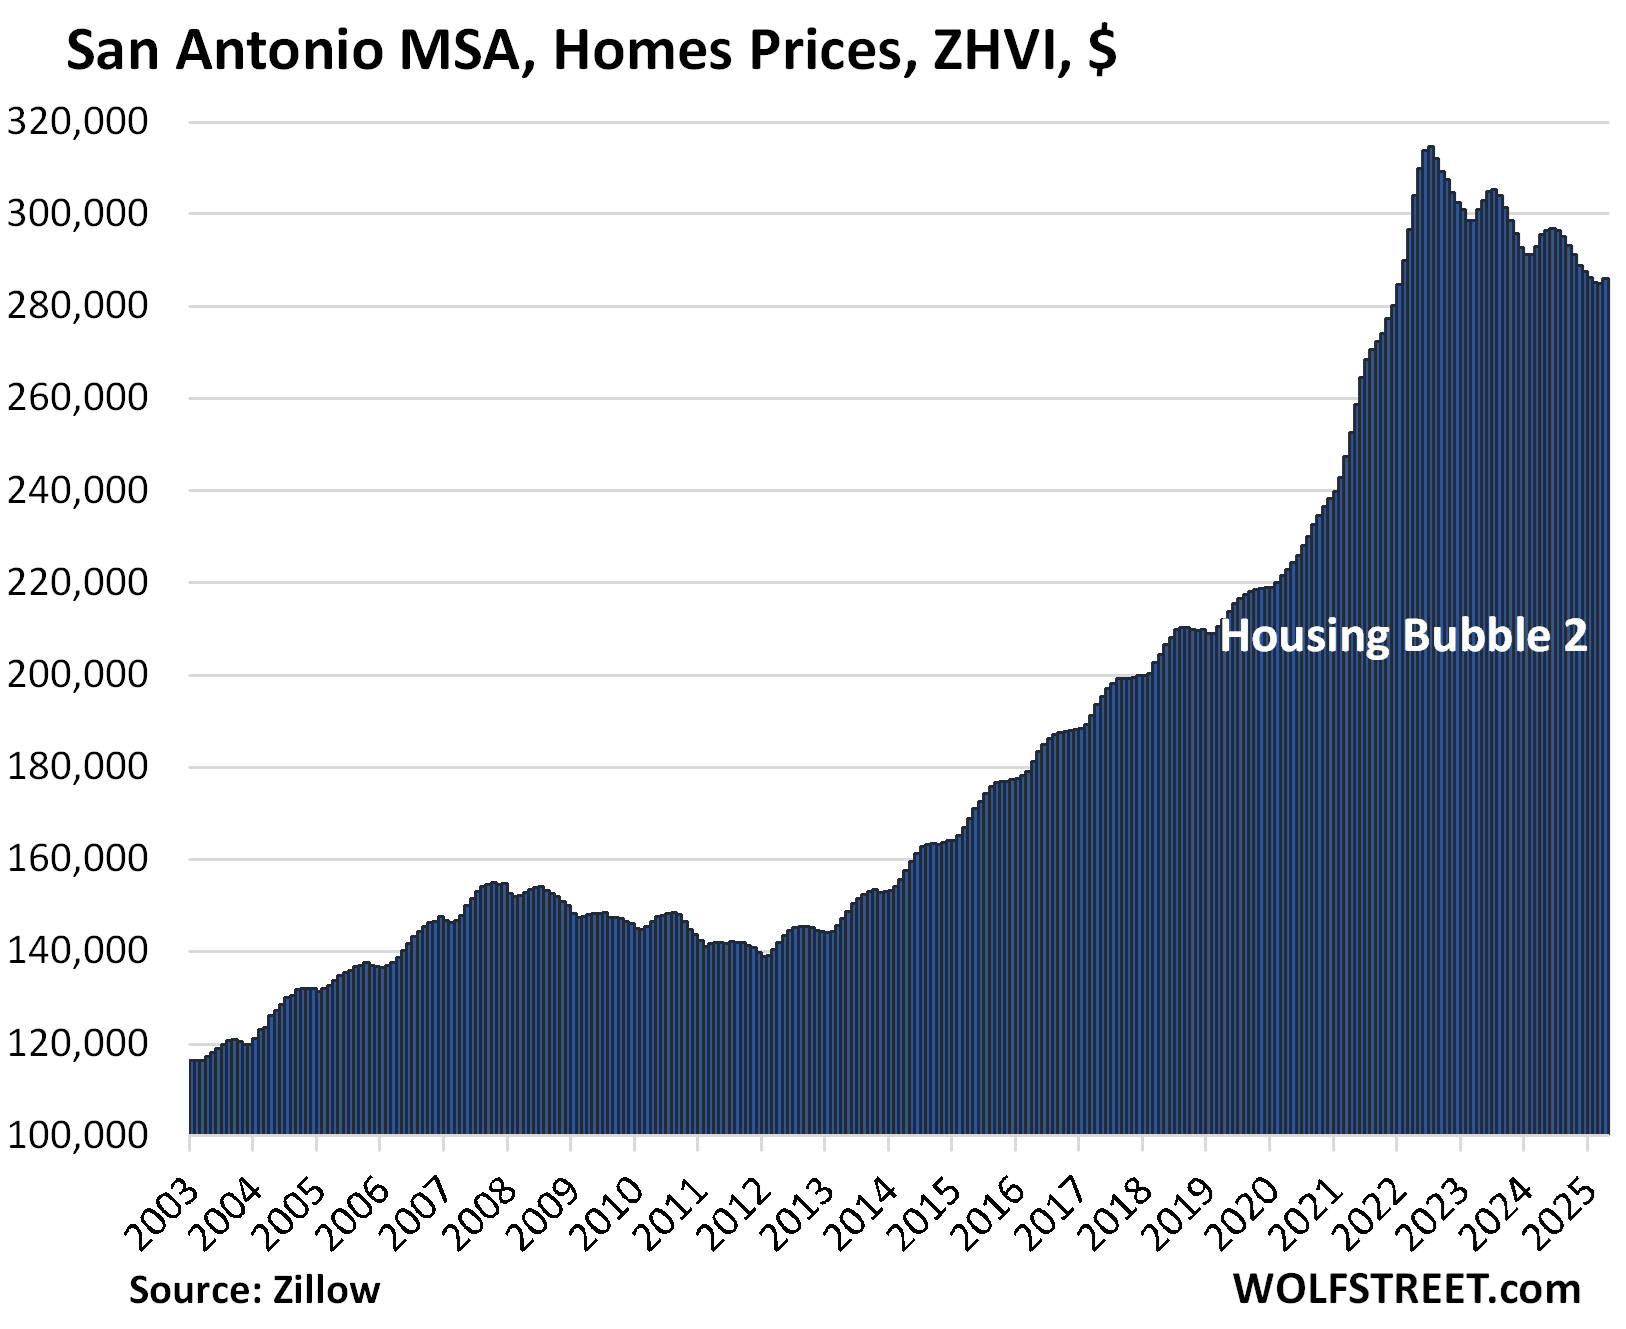
- San Antonio: -3.2%
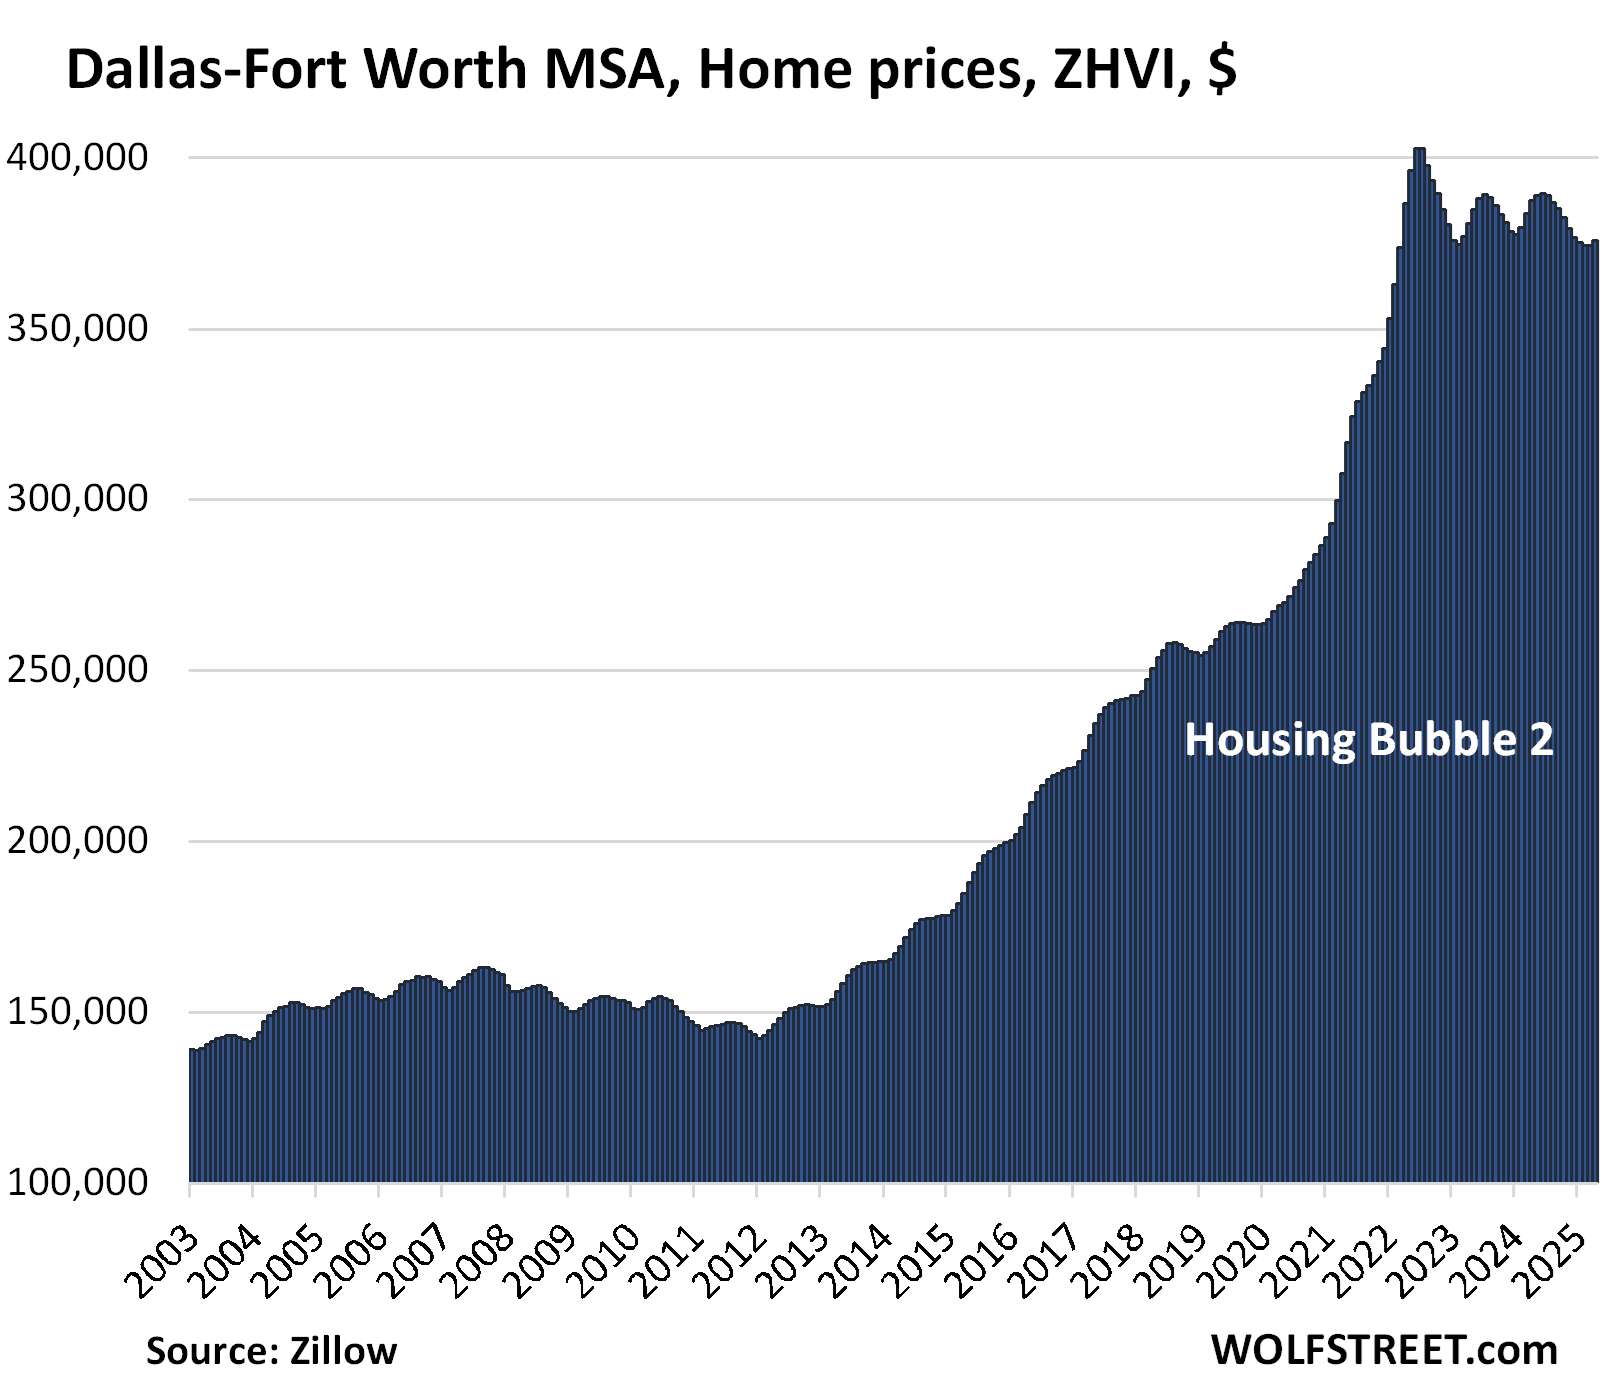
- Dallas: -3.0%
- Phoenix: -2.8%
- Orlando: -2.7%
- Atlanta: -2.3%
- Miami: -2.3%
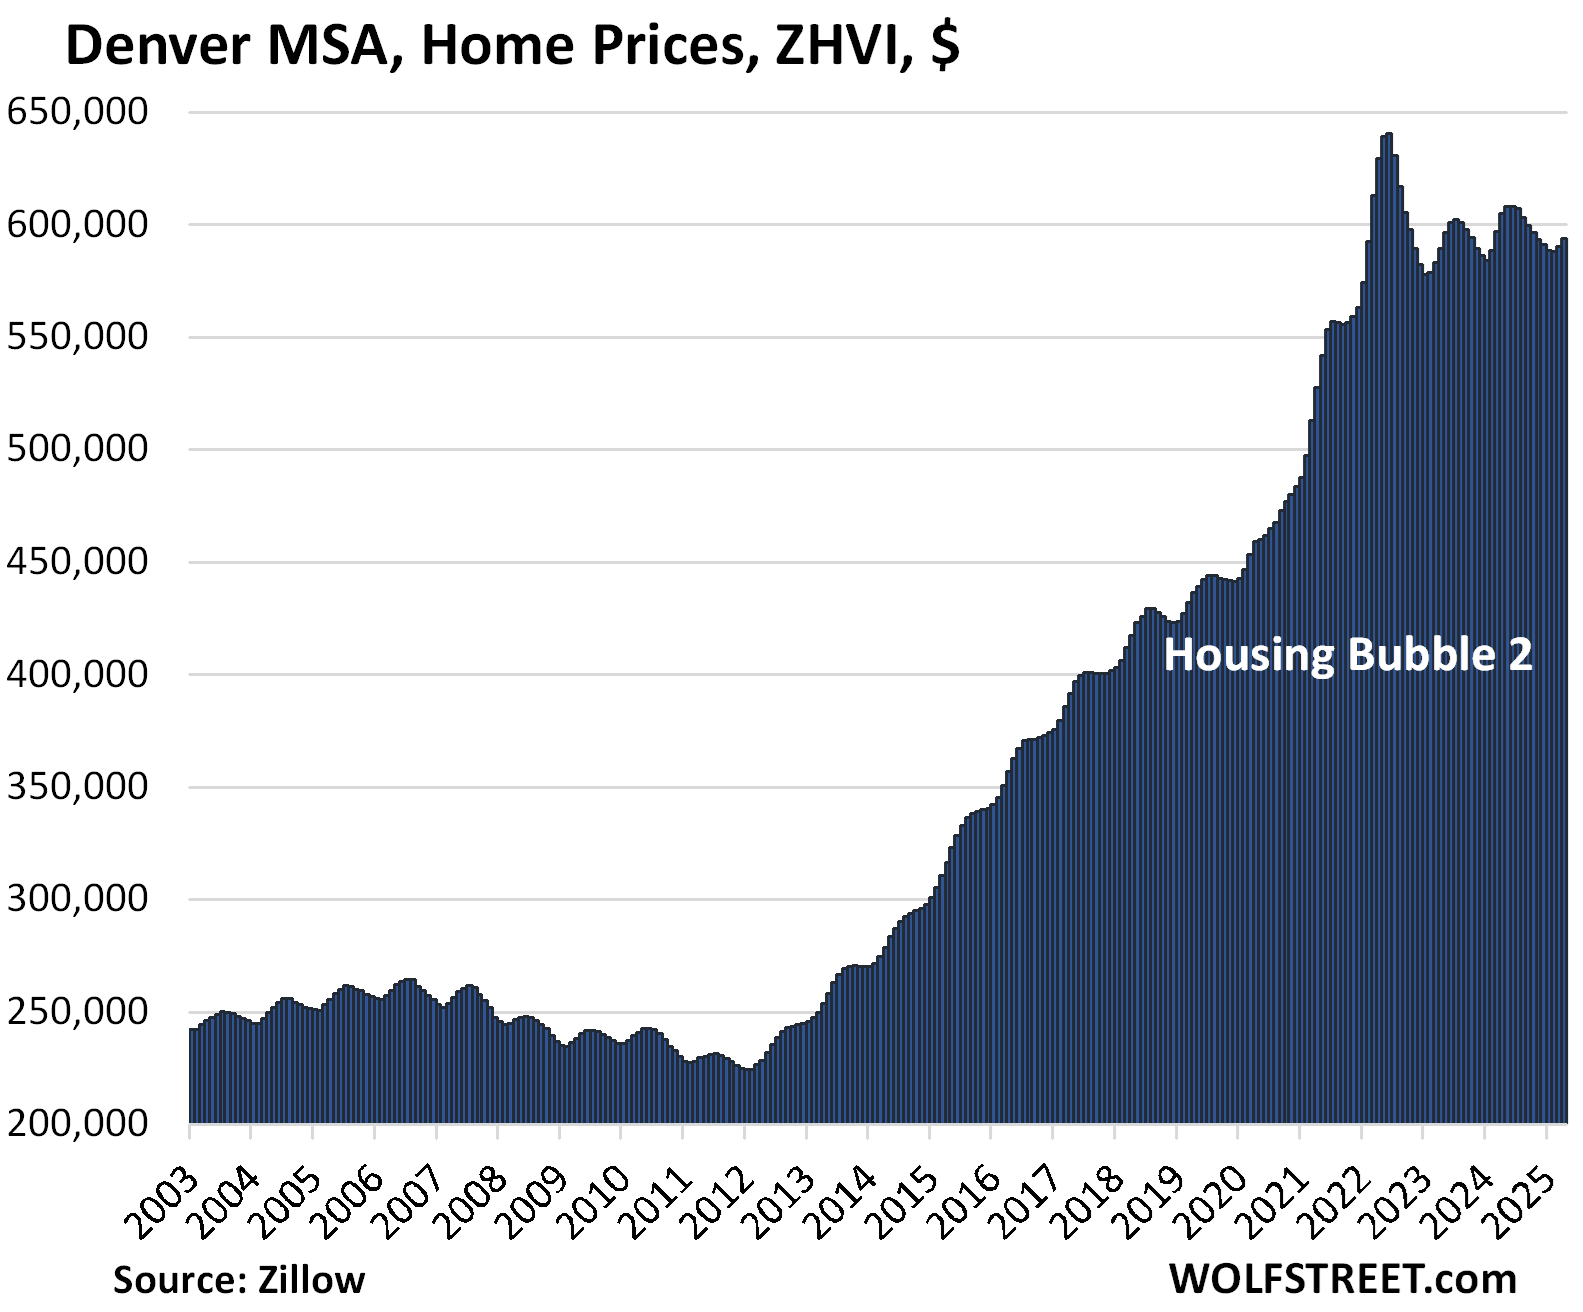
- Denver: -1.8%
- Honolulu: -1.6%
- Raleigh: -1.4%
- Houston: -1.4%
- San Francisco: -1.2%
- San Diego: -0.9%
- Charlotte: -0.6%
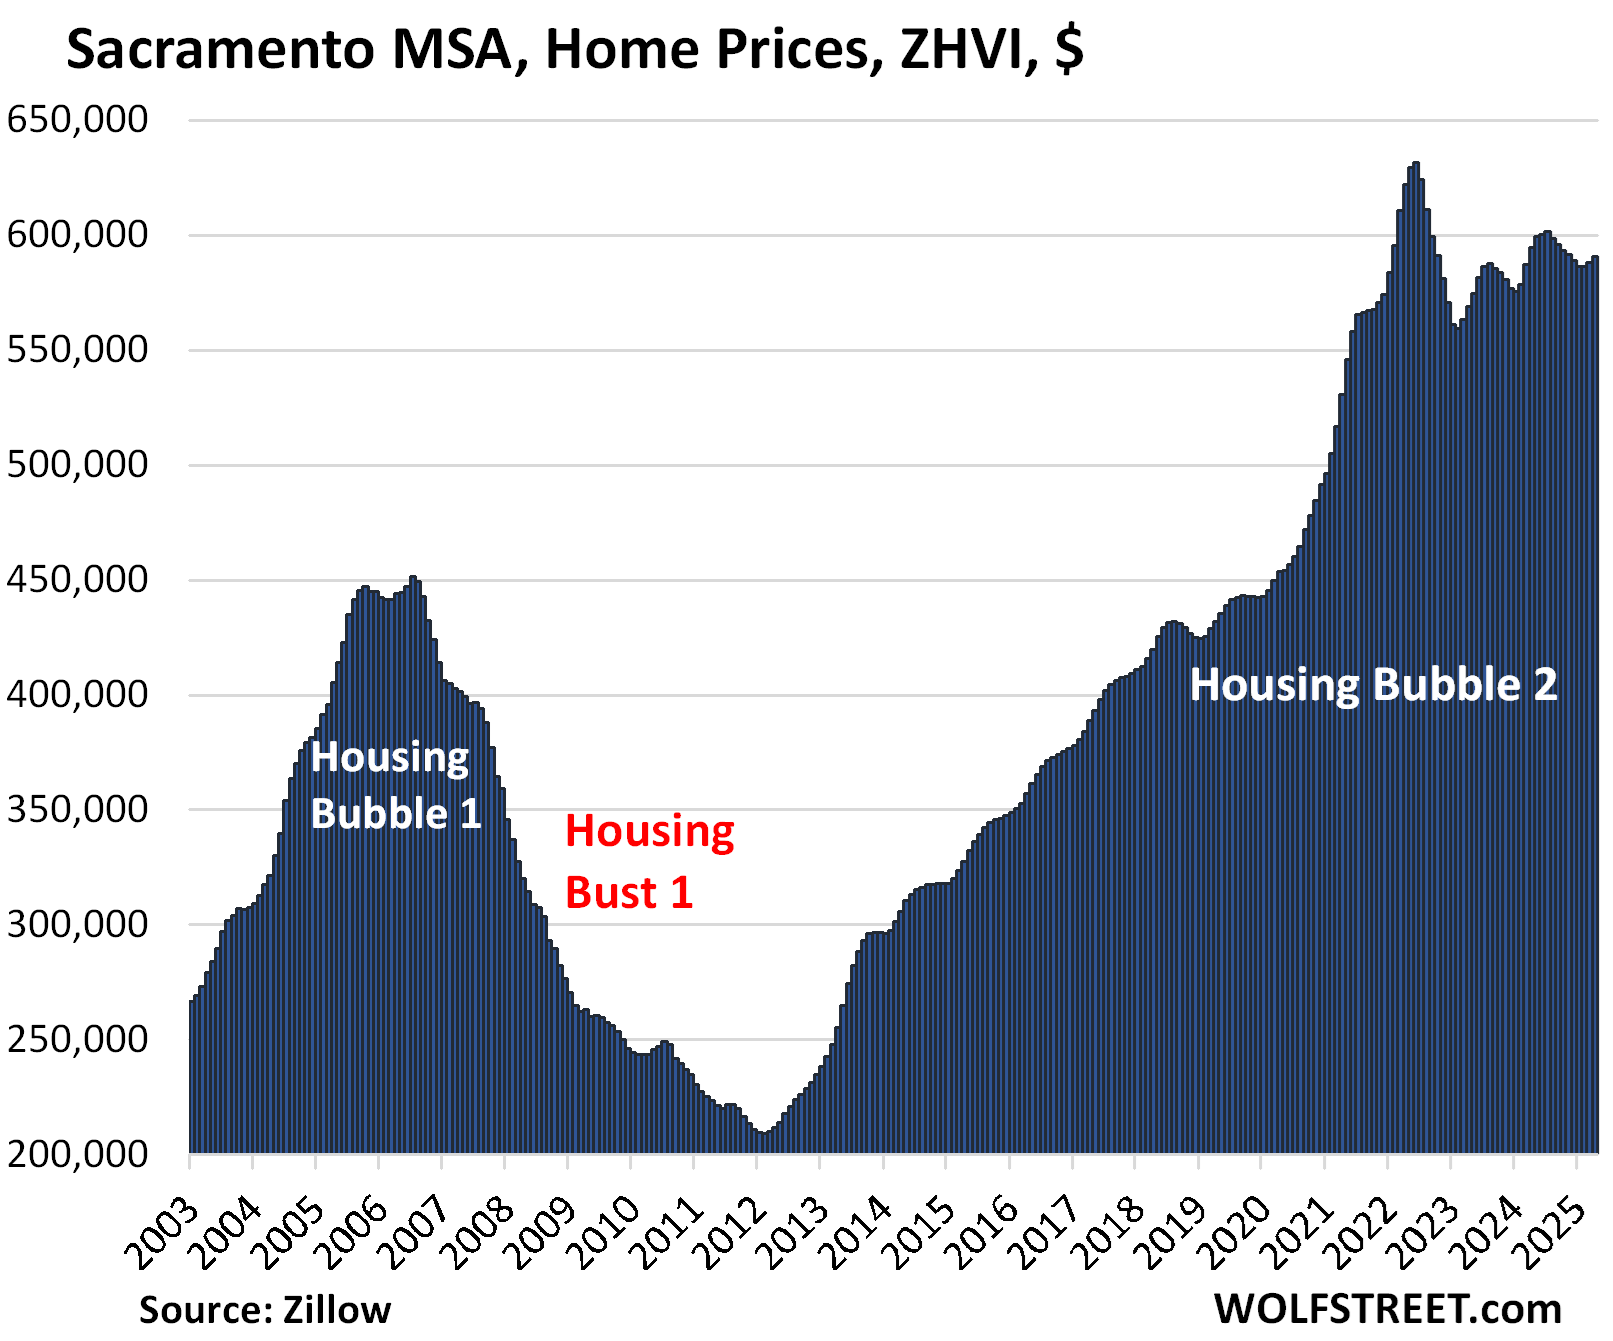
- Sacramento: -0.6%
- Birmingham: -0.3%
- Portland: -0.1%
Down from the 2022 peaks.
Prices in 19 metros of our 33 metros are down from their 2022 peaks, led by the metros of:
- Austin: -22.8%
- Phoenix: -9.9%
- San Francisco: -9.2%
- San Antonio: -9.1%
- Denver: -7.3%
- Dallas: -6.7%
- Sacramento: -6.5%
- Tampa: -6.2%
All data here is from the “raw” not seasonally adjusted mid-tier Zillow Home Value Index (ZHVI). The ZHVI is based on millions of data points in Zillow’s “Database of All Homes,” including from public records (tax data), MLS, brokerages, local Realtor Associations, real-estate agents, and households across the US. It includes pricing data for off-market deals and for-sale-by-owner deals. Zillow’s Database of All Homes also has sales-pairs data.
The 33 Most Splendid Housing Bubbles.
Here we track the prices of single-family houses, condos, and co-ops in 33 large MSAs. To qualify for this list, the MSA must be one of the largest by population and must have had a ZHVI of at least $300,000 somewhere along the line.
The metros of New Orleans, Oklahoma City, Tulsa, Cincinnati, Pittsburgh, etc. while large enough, don’t qualify in terms of their ZHVI, which has never reached $300,000, despite the massive surge of home prices in recent years, but from low levels.
Note that supply of existing homes for sale in the US jumped to the highest since 2016, with active listings exploding in Florida’s major markets. In California’s major markets, active listings have also ballooned – by 70% YoY in San Diego, for example; the San Francisco Bay Area reached the highest level in many years.
The 19 metros that are down from their all-time highs in 2022.
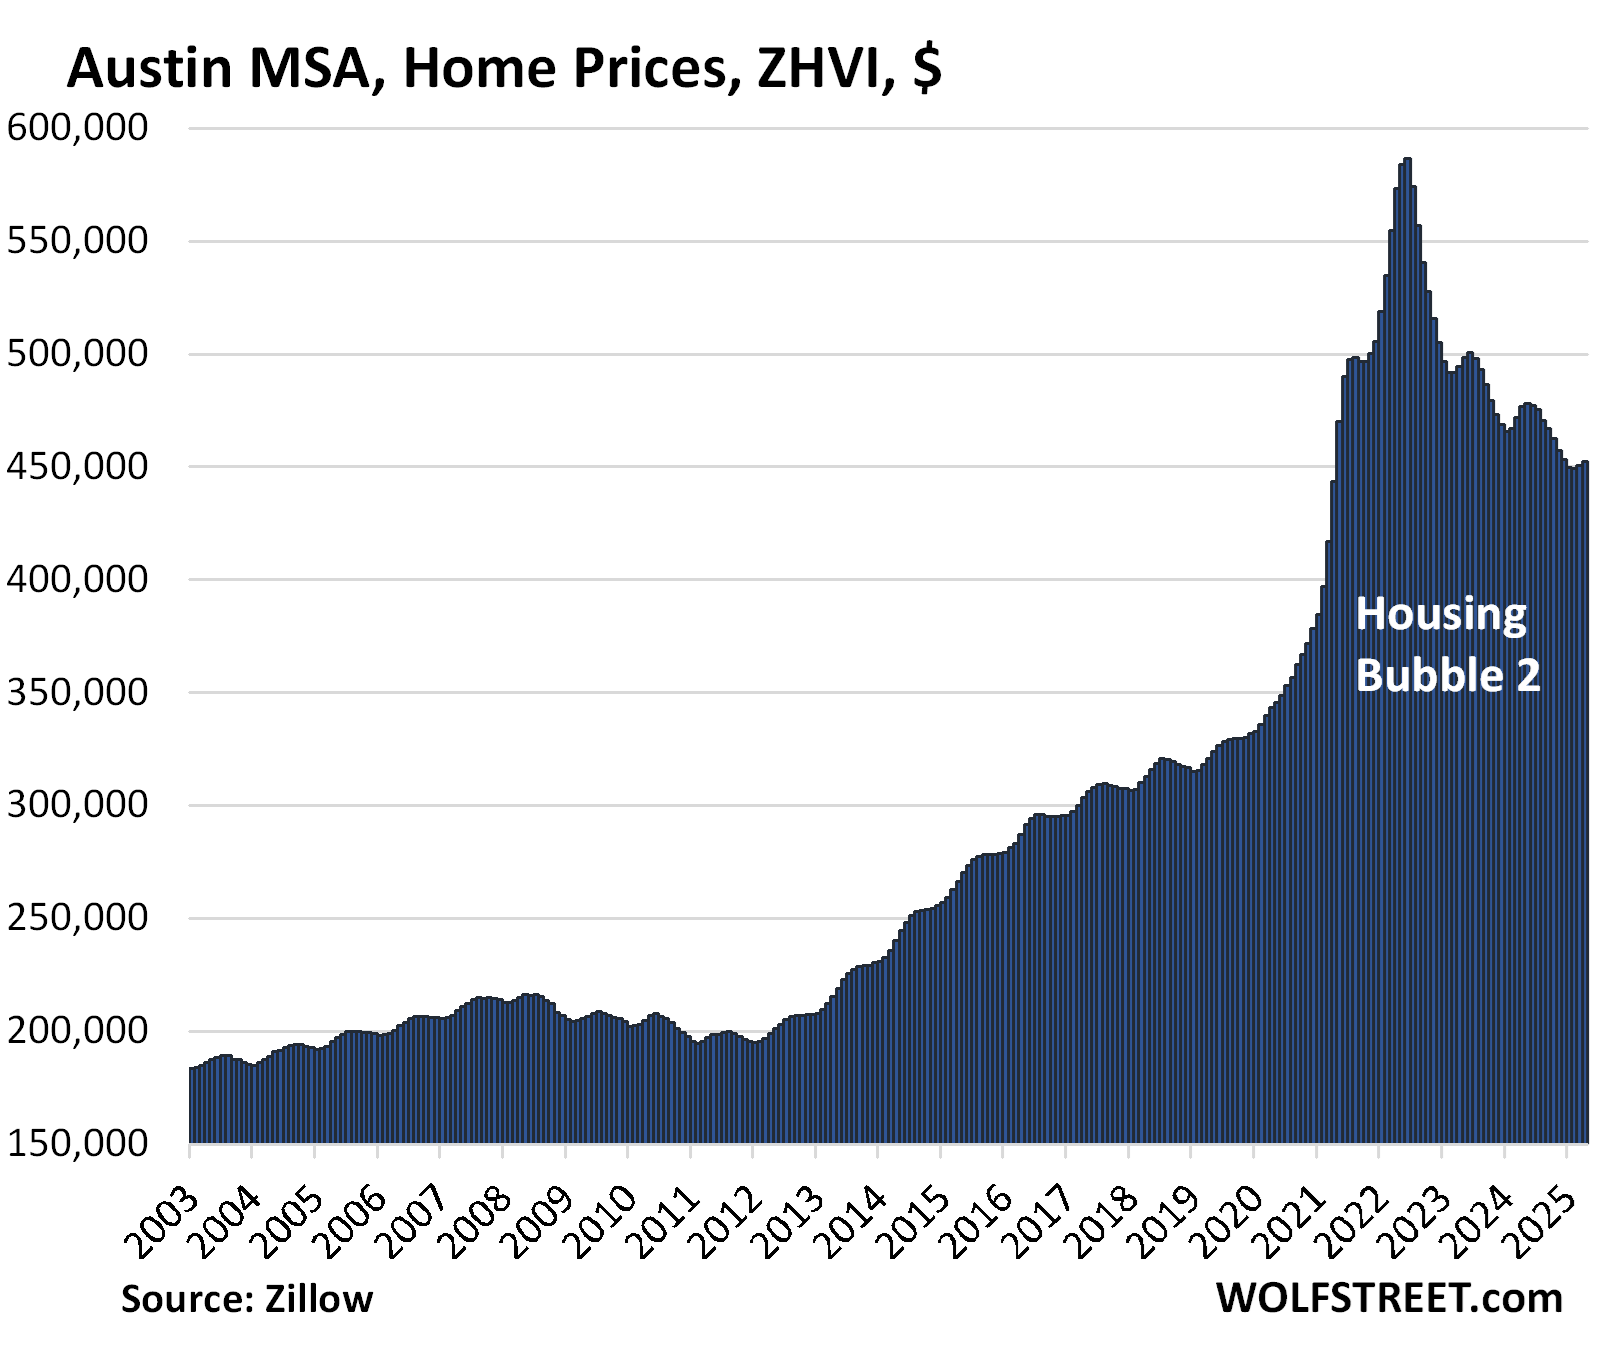
| Austin MSA, Home Prices | |||
| From Jun 2022 peak | MoM | YoY | Since 2000 |
| -22.8% | 0.5% | -5.1% | 155% |
The YoY decline has worsened for months. Prices are back where they’d been in April 2021.
The Austin MSA includes the counties of Travis (Austin-Round Rock), Williamson, Hays, Caldwell, and Bastrop.
Markets in Texas didn’t have much of a Housing Bubble 1 in 2002-2006, and then didn’t have much of a Housing Bust 1 either after 2006. They’d been through a huge bubble and bust in the 1980s, and it seems lessons were learned – and by 2015, forgotten.
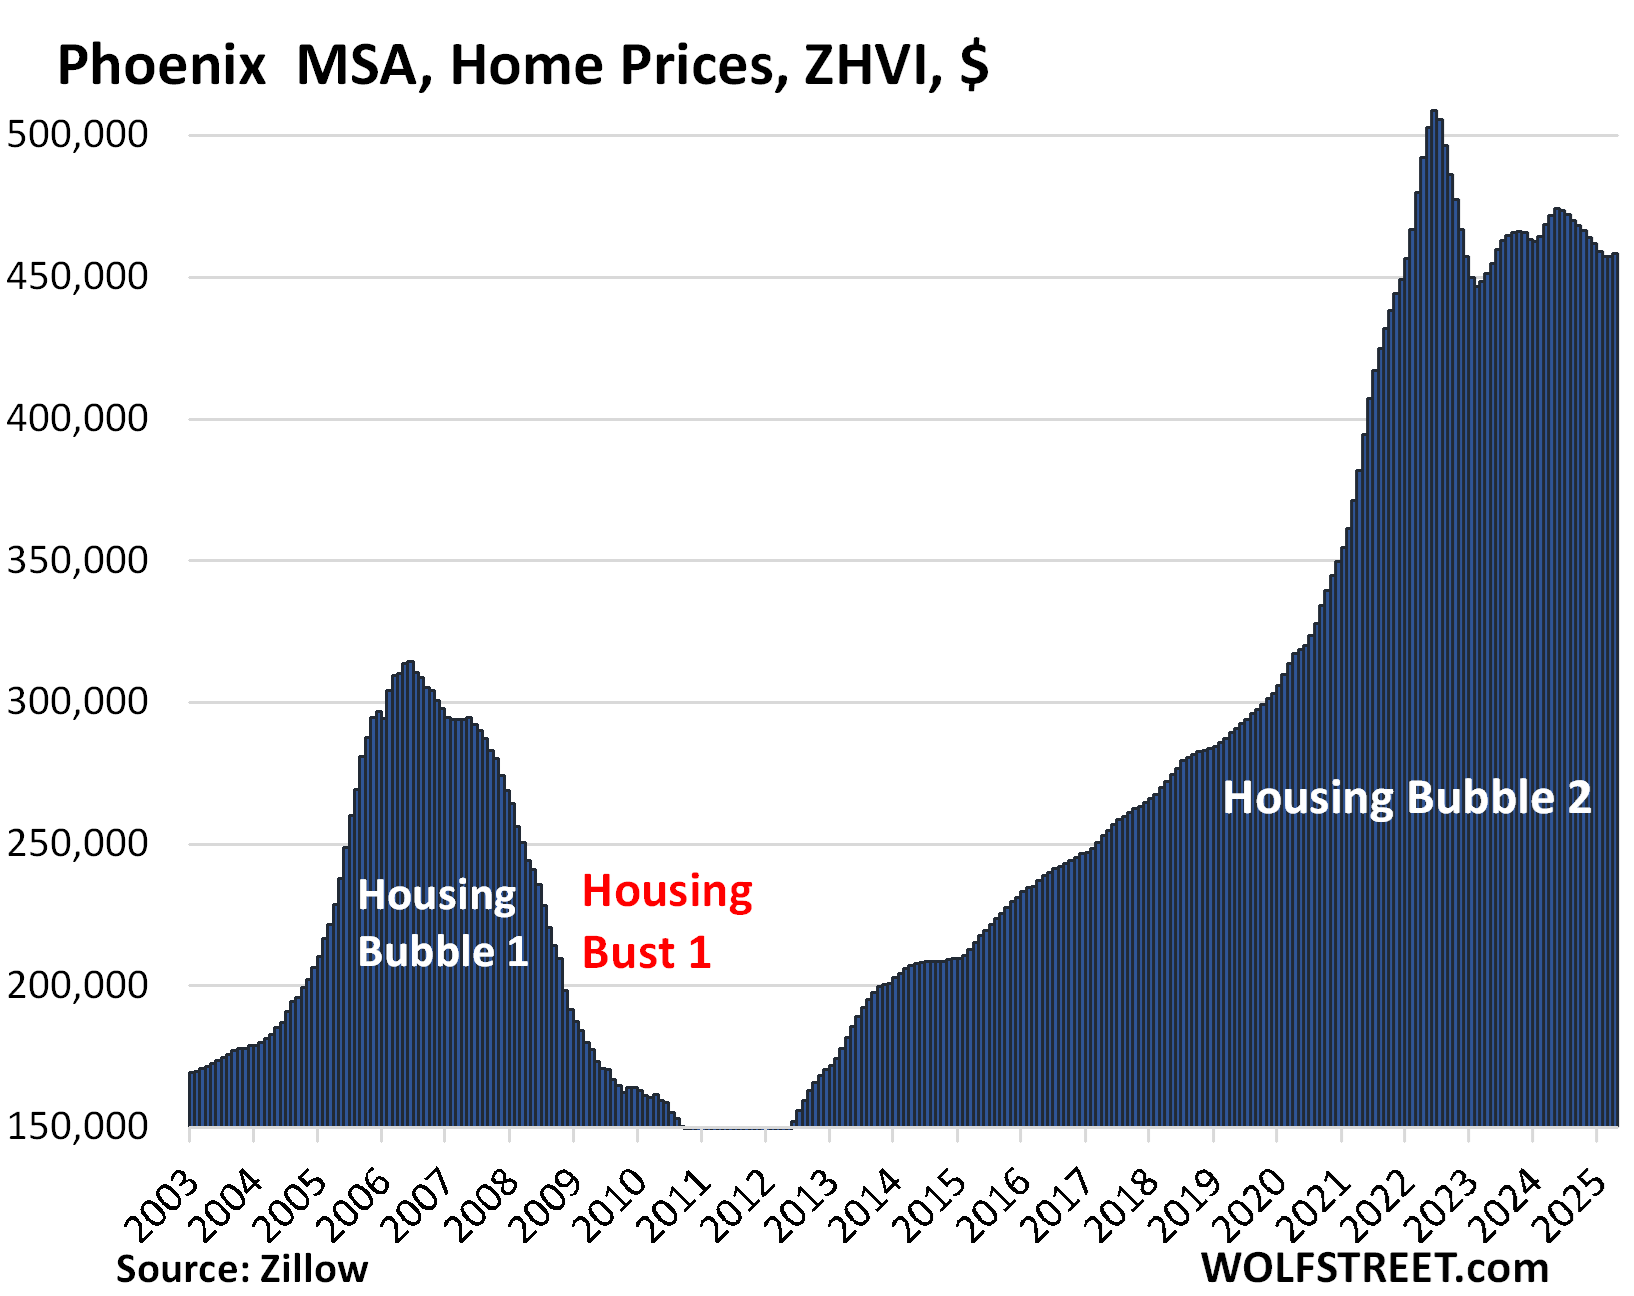
| Phoenix MSA, Home Prices | |||
| From Jun 2022 peak | MoM | YoY | Since 2000 |
| -9.9% | 0.3% | -2.8% | 217% |
The year-over-year decline worsened from -2.5% in March and -1.6% in February. Prices are back where they’d first been in January 2022:
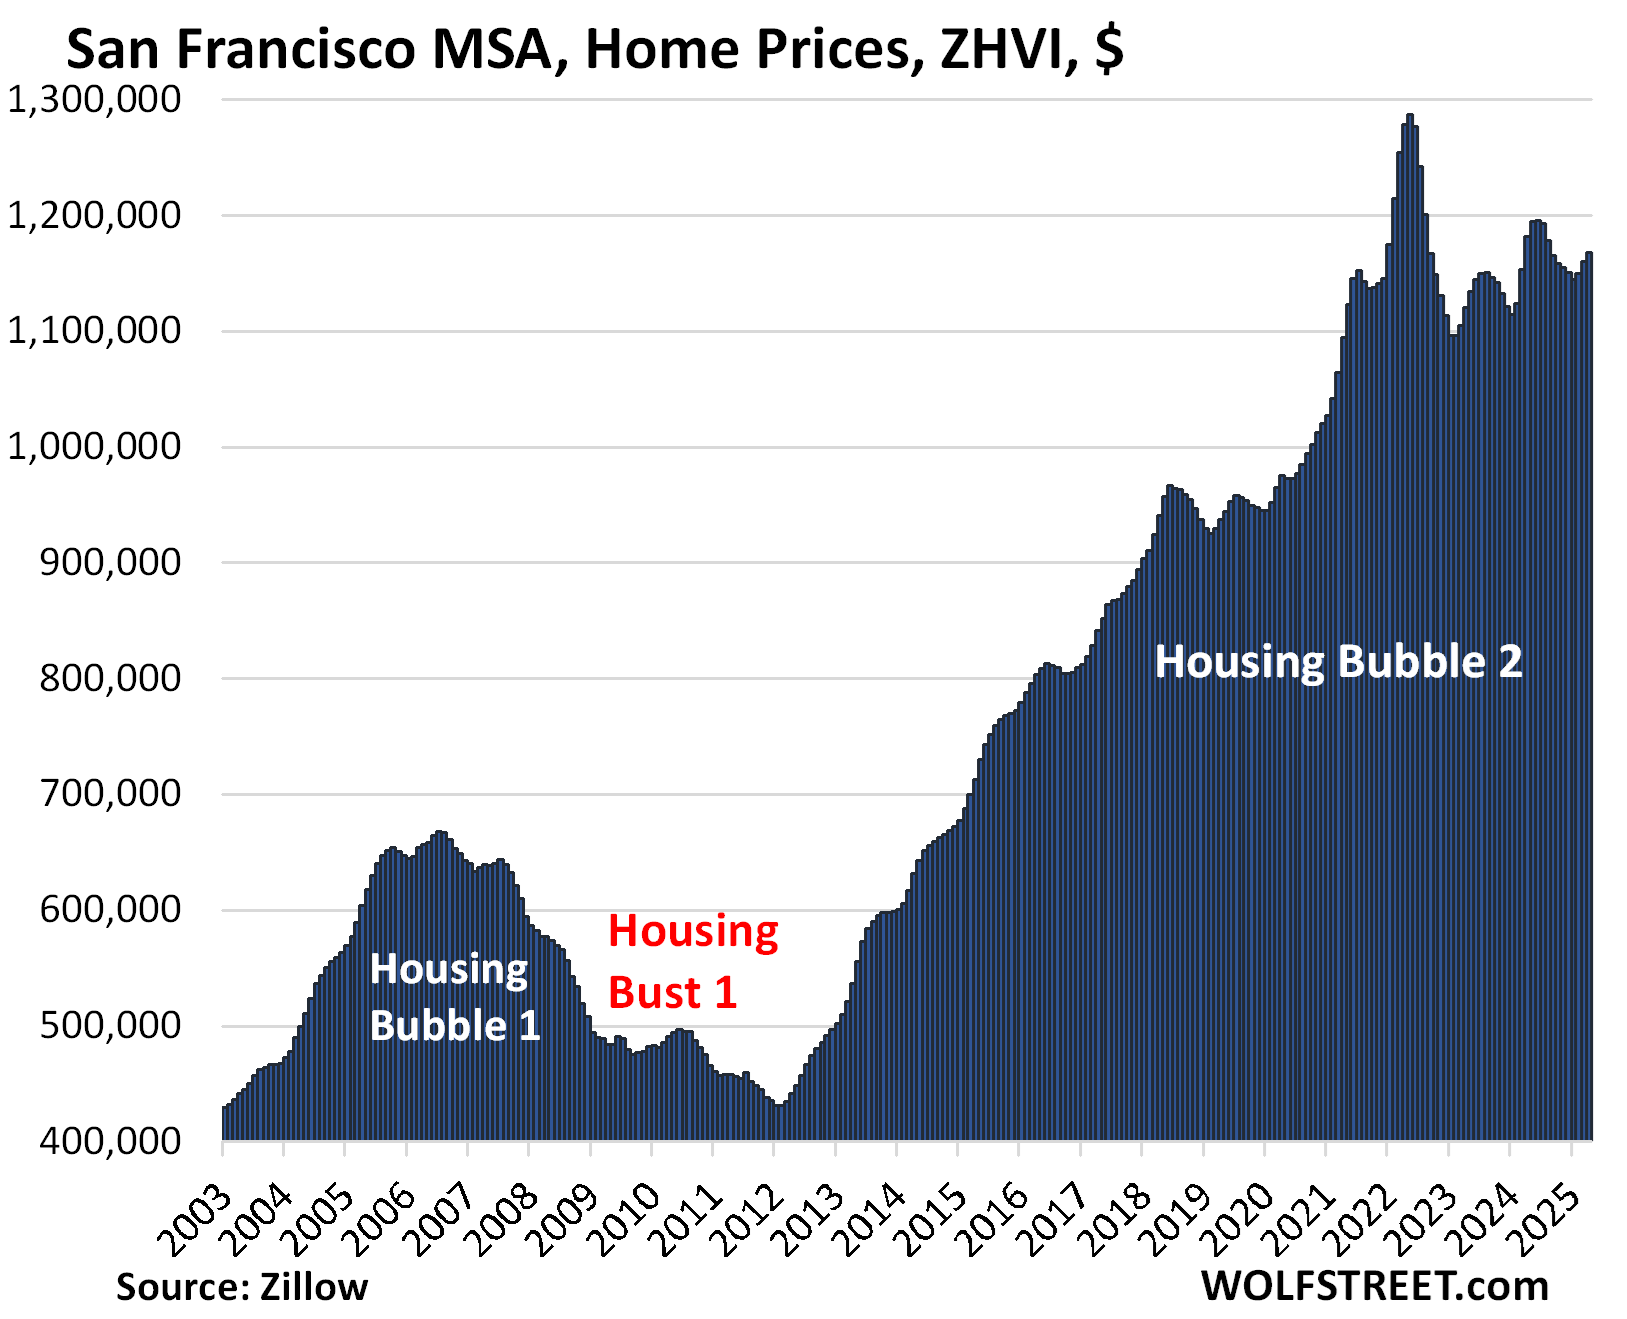
| San Francisco MSA, Home Prices | |||
| From May 2022 peak | MoM | YoY | Since 2000 |
| -9.2% | 0.7% | -1.2% | 296% |
The year-over-year price change flipped to negative, from +0.5% in March and +2.4% in February.
The MSA includes San Francisco, Oakland, much of the East Bay, much of the North Bay, and goes south on the Peninsula into Silicon Valley through San Mateo County.
| San Antonio MSA, Home Prices | |||
| From Jul 2022 peak | MoM | YoY | Since 2000 |
| -9.1% | 0.4% | -3.2% | 146.3% |
The YoY decline worsened from -2.7% in March and -2.0% in February. Prices are back where they’d been in January 2022.
| Denver MSA, Home Prices | |||
| From Jun 2022 peak | MoM | YoY | Since 2000 |
| -7.3% | 0.6% | -1.8% | 212% |
The YoY decline worsened from -1.1% in March and 0% in February. Prices are back where they’d first been in early 2022.
| Dallas-Fort Worth MSA, Home Prices | |||
| From Jun 2022 peak | MoM | YoY | Since 2000 |
| -6.7% | 0.3% | -3.0% | 191% |
The YoY drop worsened from -2.4% in March and -1.4% in February.
| Sacramento MSA, Home Prices | |||
| From July 2022 peak | MoM | YoY | Since 2000 |
| -6.5% | 0.5% | -0.6% | 245.7% |
The year-over-year price change flipped to negative in April, from +0.1% in March, and +1.3% in February.
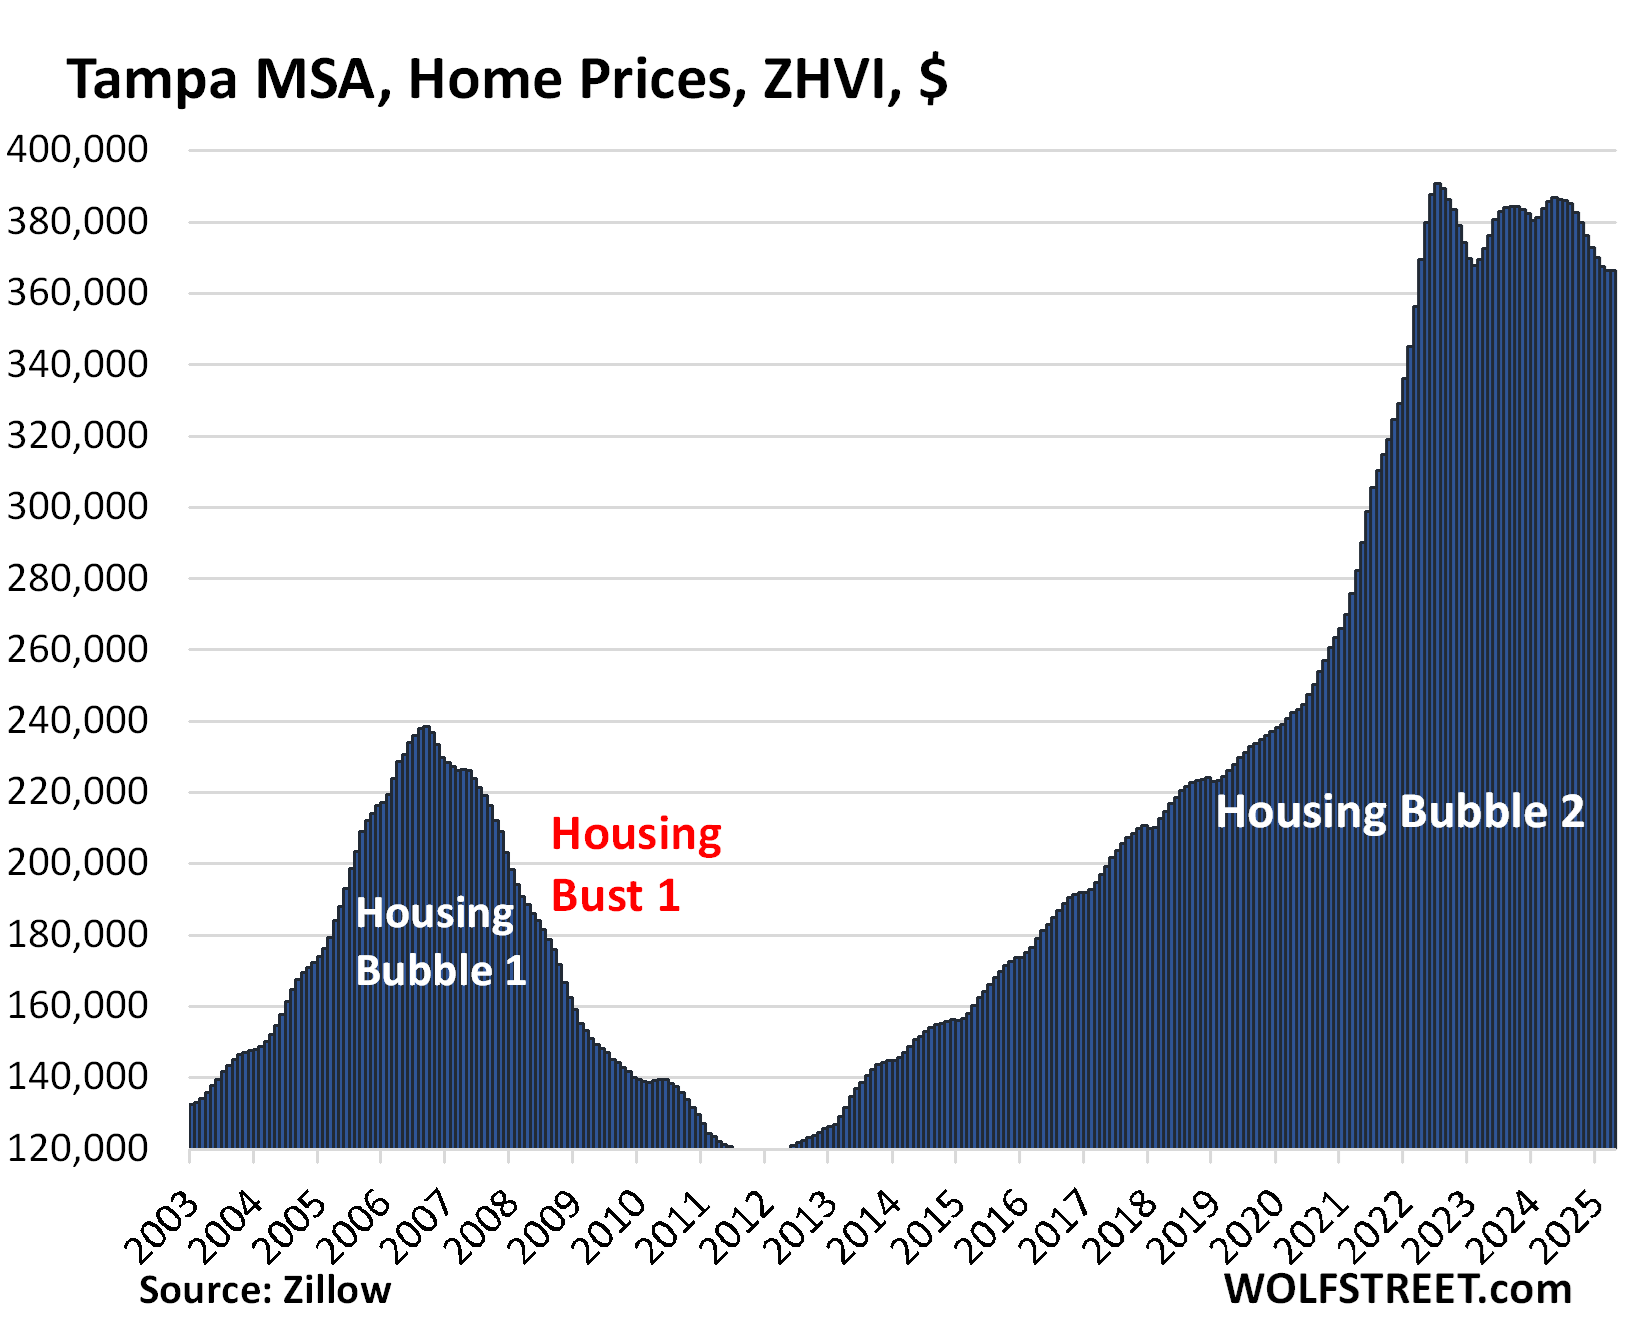
| Tampa MSA, Home Prices | |||
| From Jul 2022 peak | MoM | YoY | Since 2000 |
| -6.2% | 0.0% | -5.0% | 261% |
The YoY drop continues to worsen.
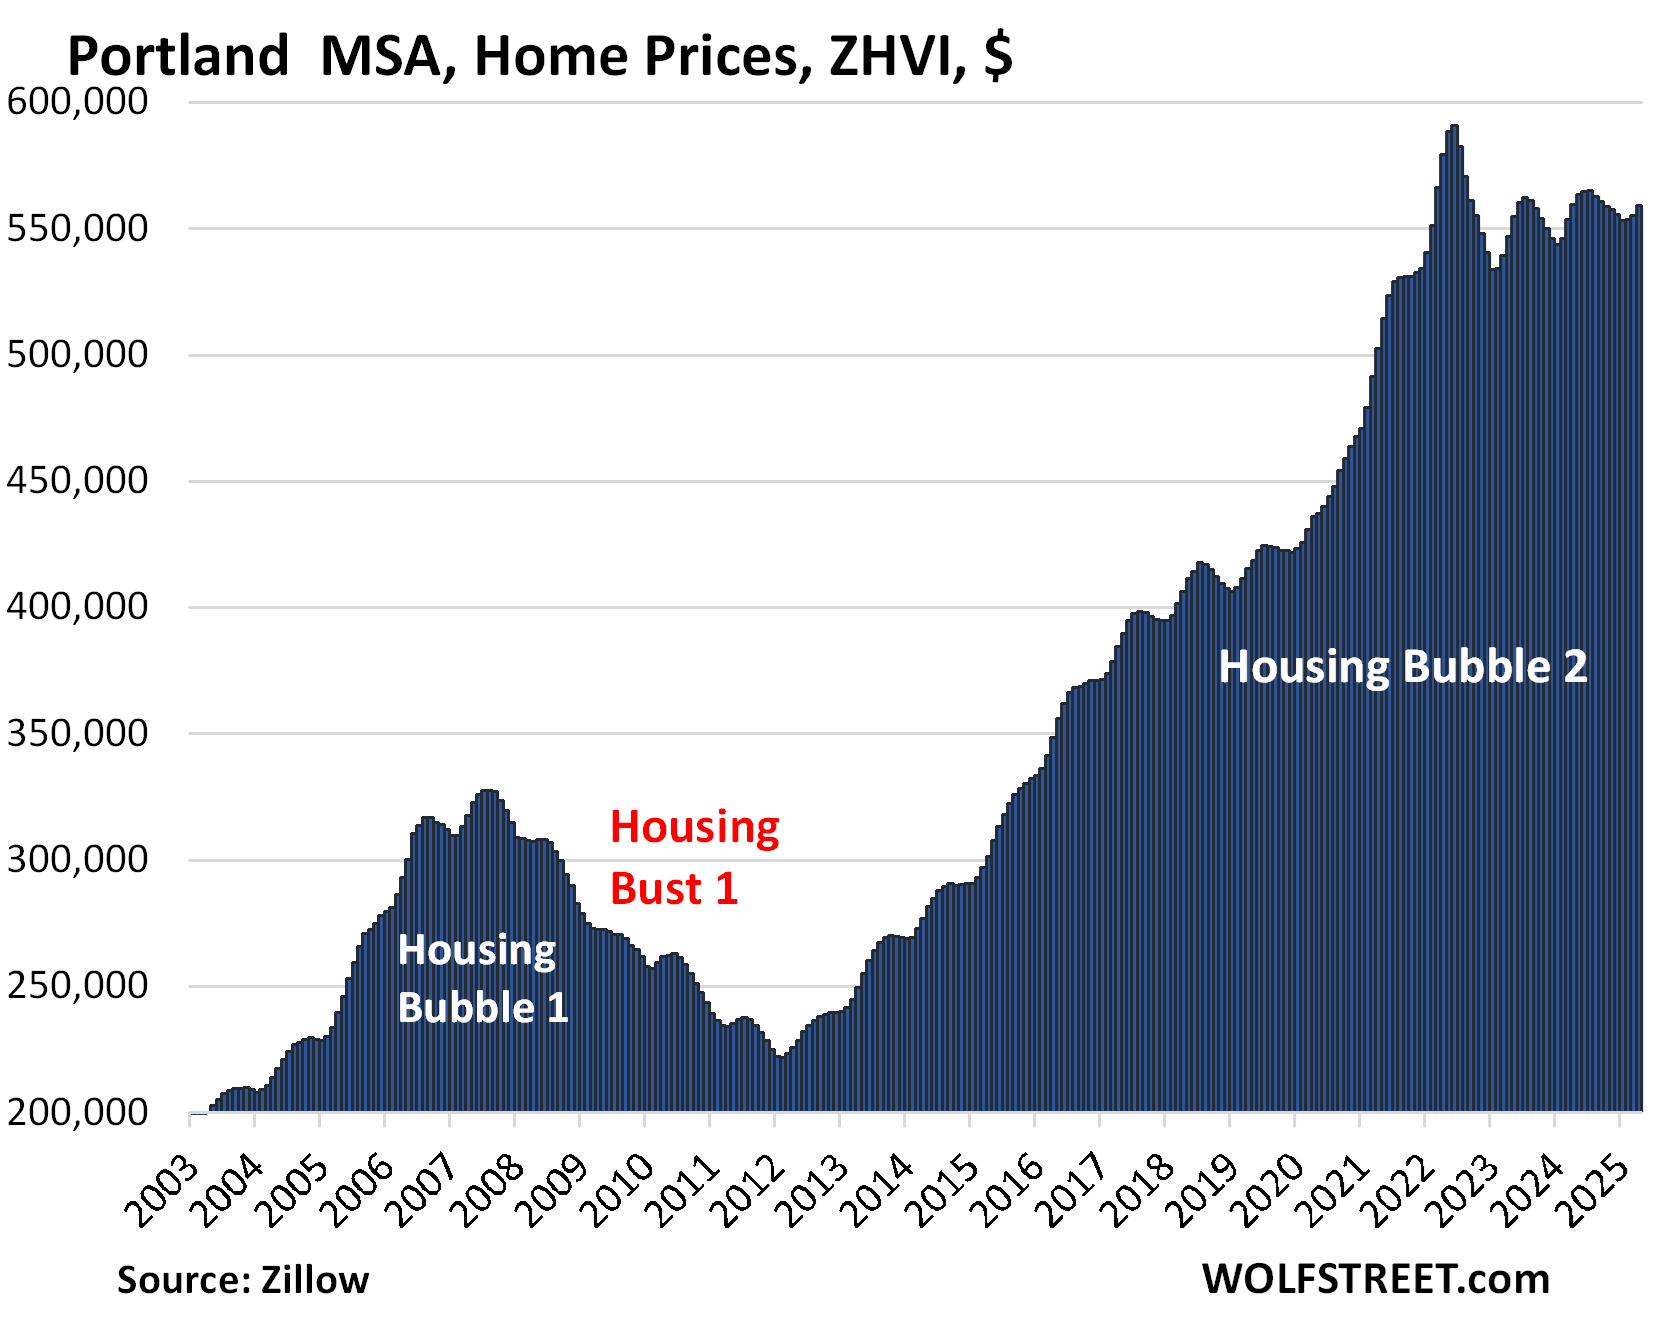
| Portland MSA, Home Prices | |||
| From May 2022 peak | MoM | YoY | Since 2000 |
| -5.4% | 0.7% | -0.1% | 219% |
The year-over-year price change flipped to negative in April, from +0.35 in March and +1.3% in February. Prices are back where they’d first been in early 2022
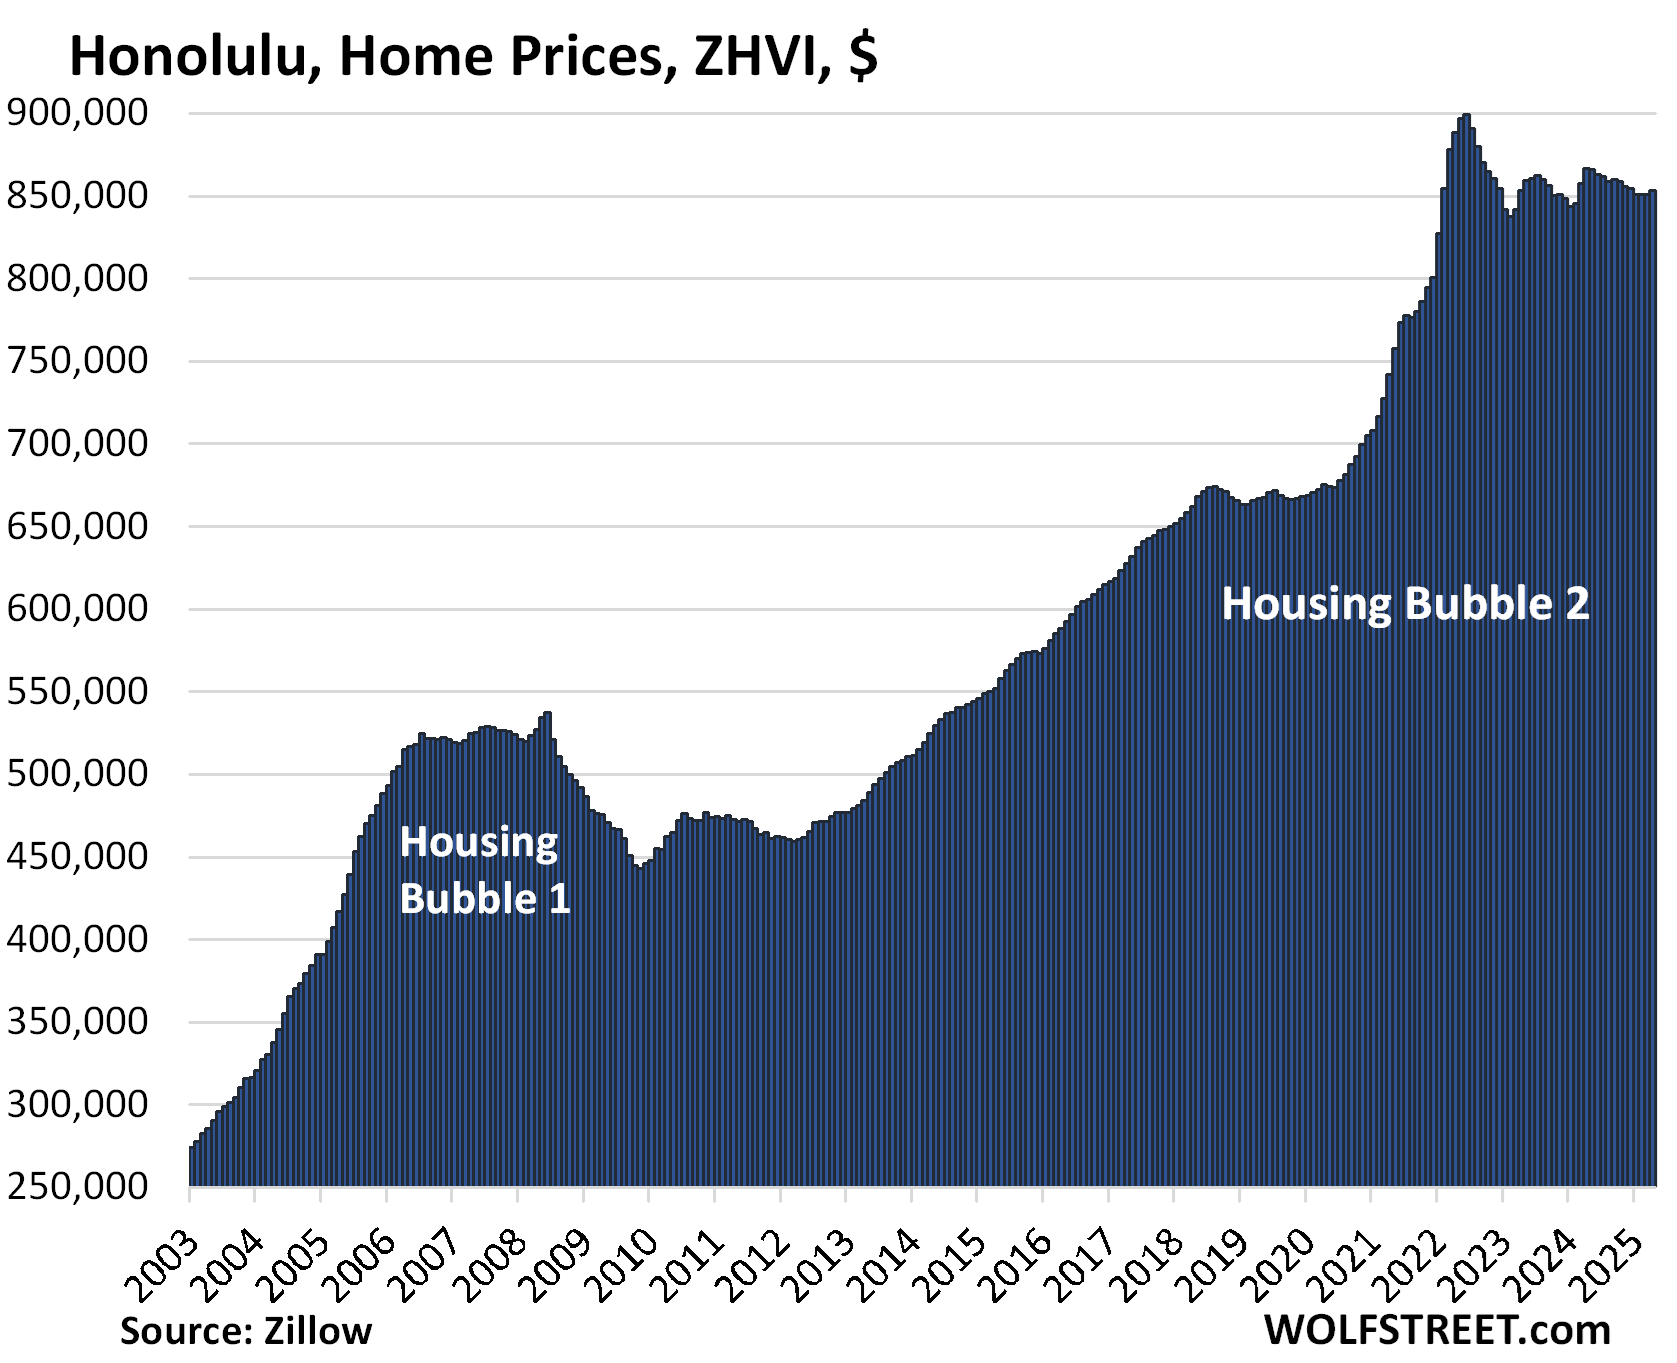
| Honolulu, Home Prices | |||
| From Jun 2022 peak | MoM | YoY | Since 2000 |
| -5.1% | 0.2% | -1.6% | 279% |
The YoY decline worsened from -0.8% in March, when it had flipped to negative from +0.6% in February.
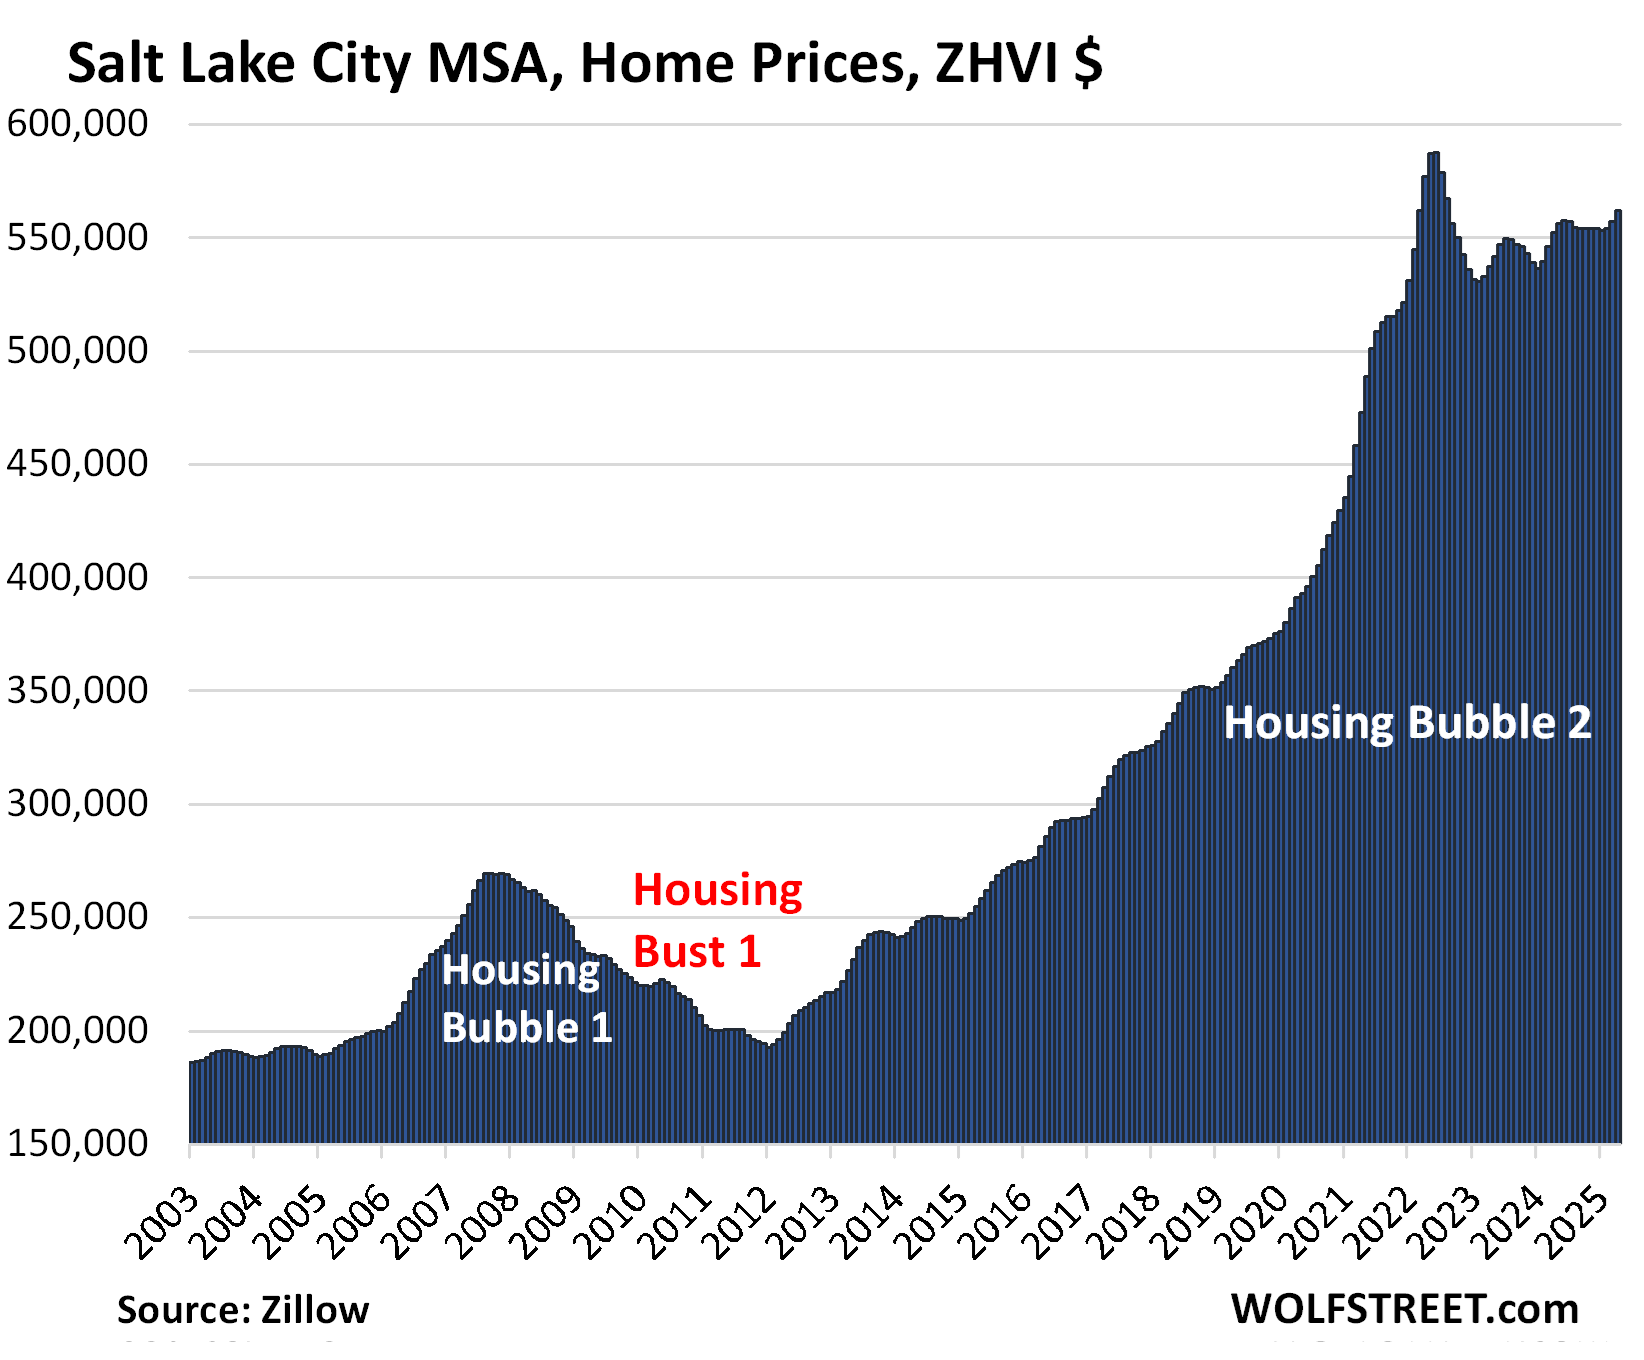
| Salt Lake City MSA, Home Prices | |||
| From July 2022 peak | MoM | YoY | Since 2000 |
| -4.4% | 0.9% | 1.7% | 218% |
The year-over-year gain declined from +2.0% in March.
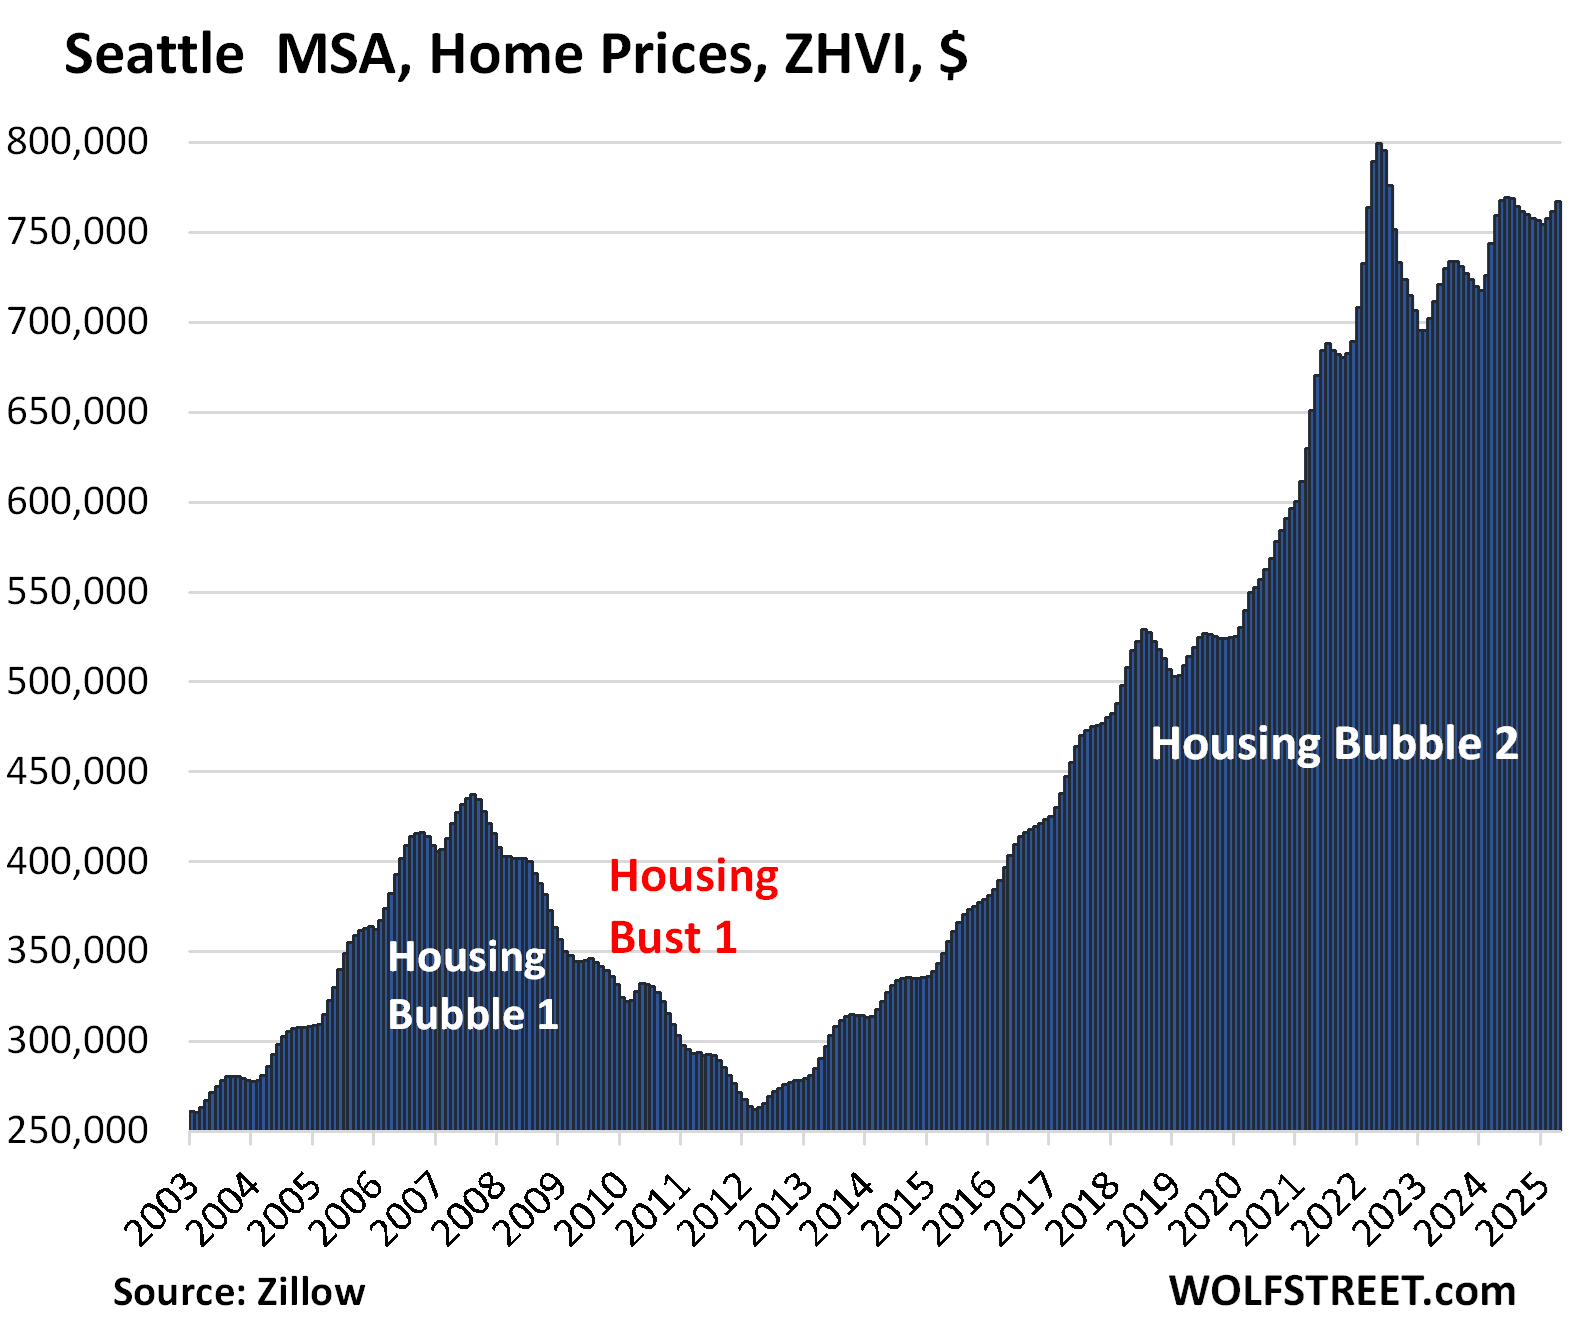
| Seattle MSA, Home Prices | |||
| From May 2022 peak | MoM | YoY | Since 2000 |
| -4.0% | 0.7% | 1.1% | 242% |
The YoY gain declined from +2.4% in March and +4.3% in February.
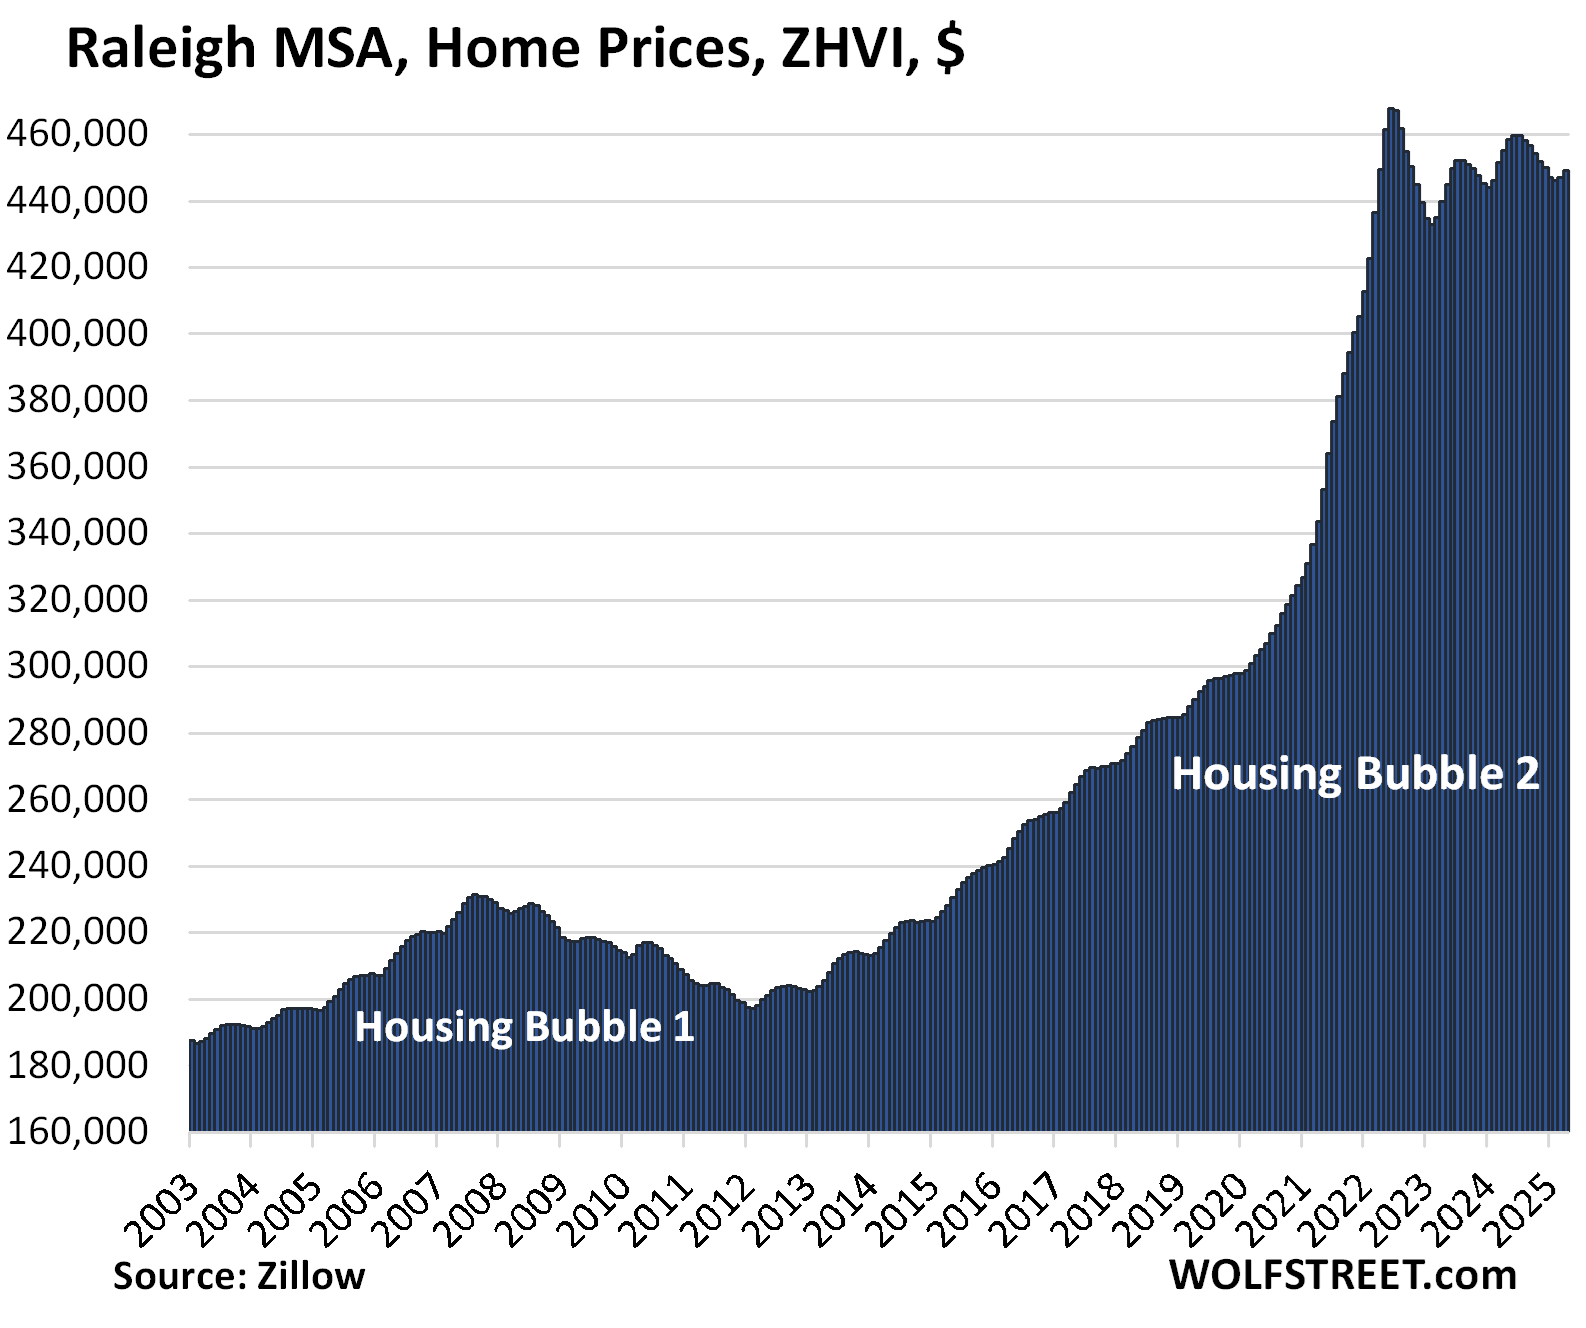
| Raleigh MSA, Home Prices | |||
| From July 2022 peak | MoM | YoY | Since 2000 |
| -4.0% | 0.5% | -1.4% | 157% |
The YOY decline worsened from 1.0% in March.
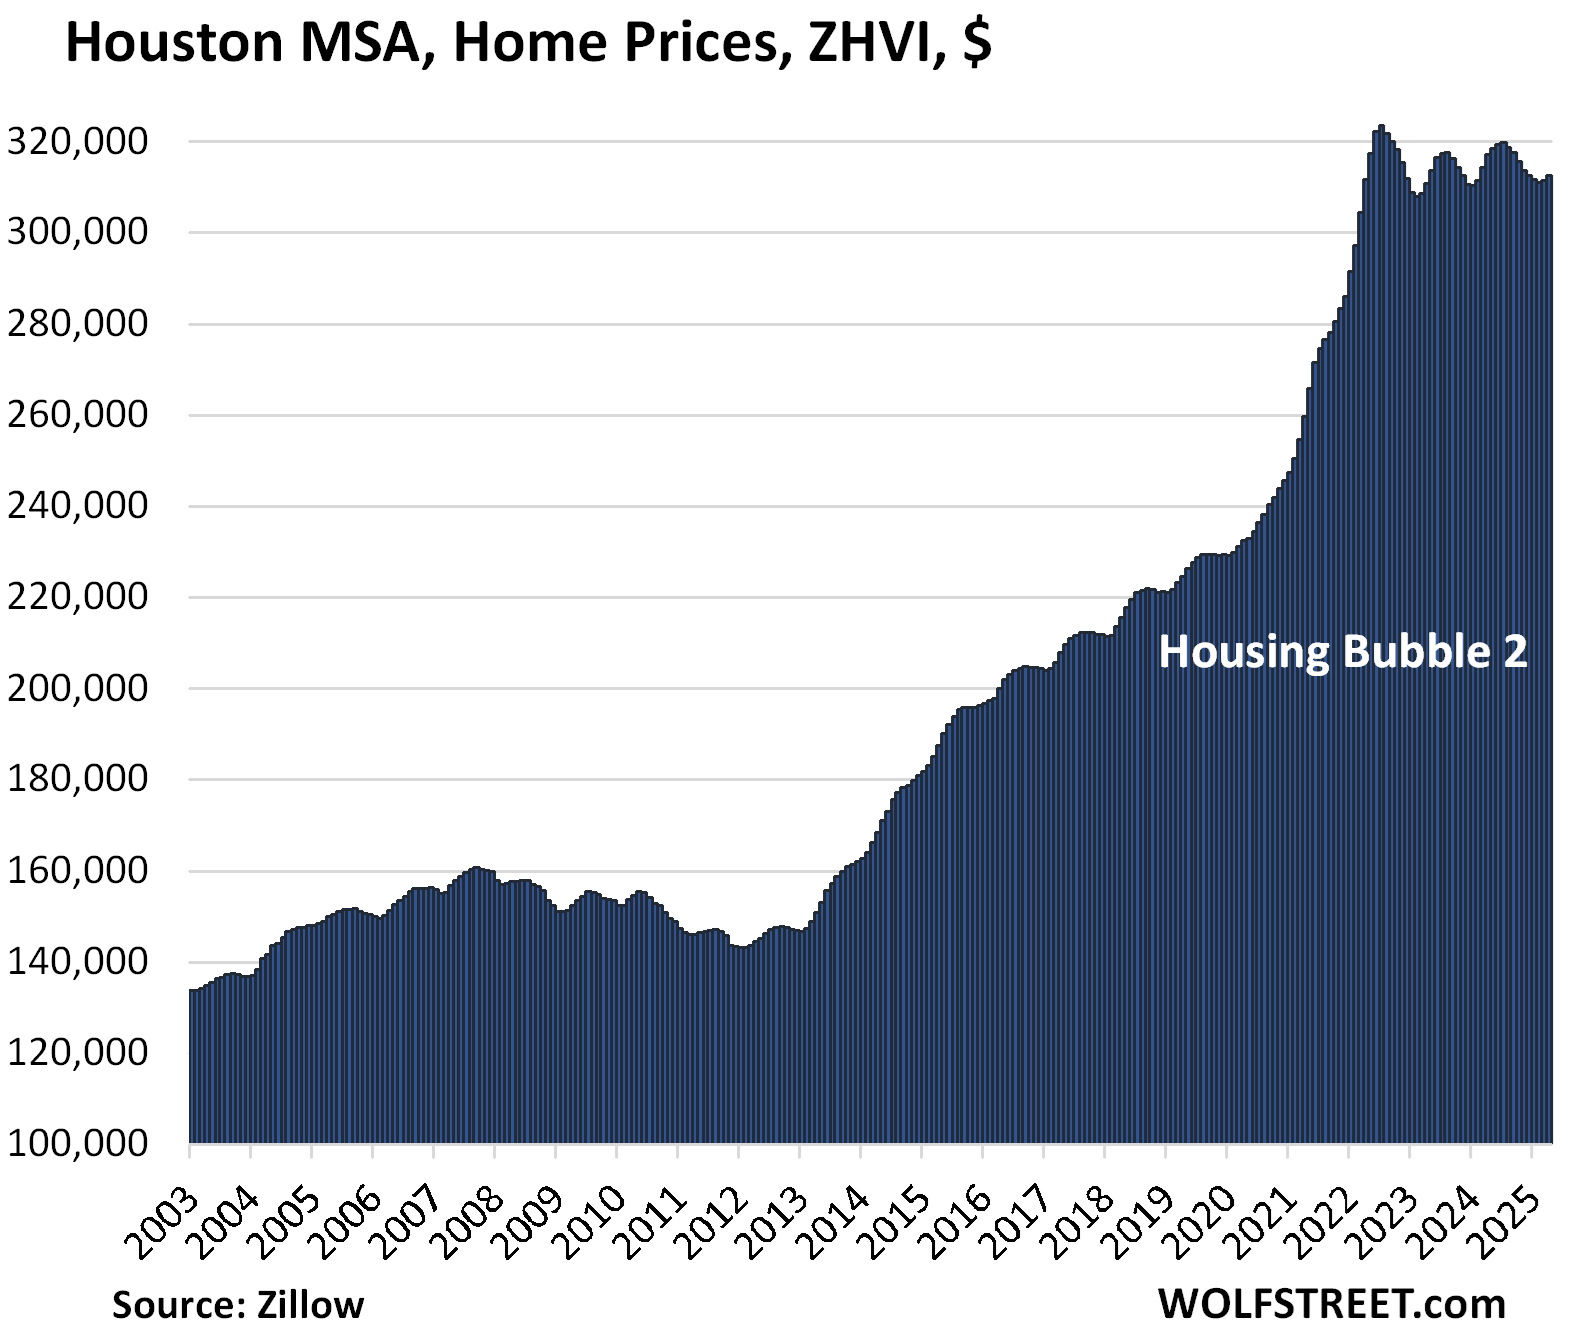
| Houston MSA, Home Prices | |||
| From Jul 2022 peak | MoM | YoY | Since 2000 |
| -3.4% | 0.4% | -1.4% | 150% |
The YoY decline worsened from -0.9% in March and -0.2% in February. The index is where it had first been in April 2022.
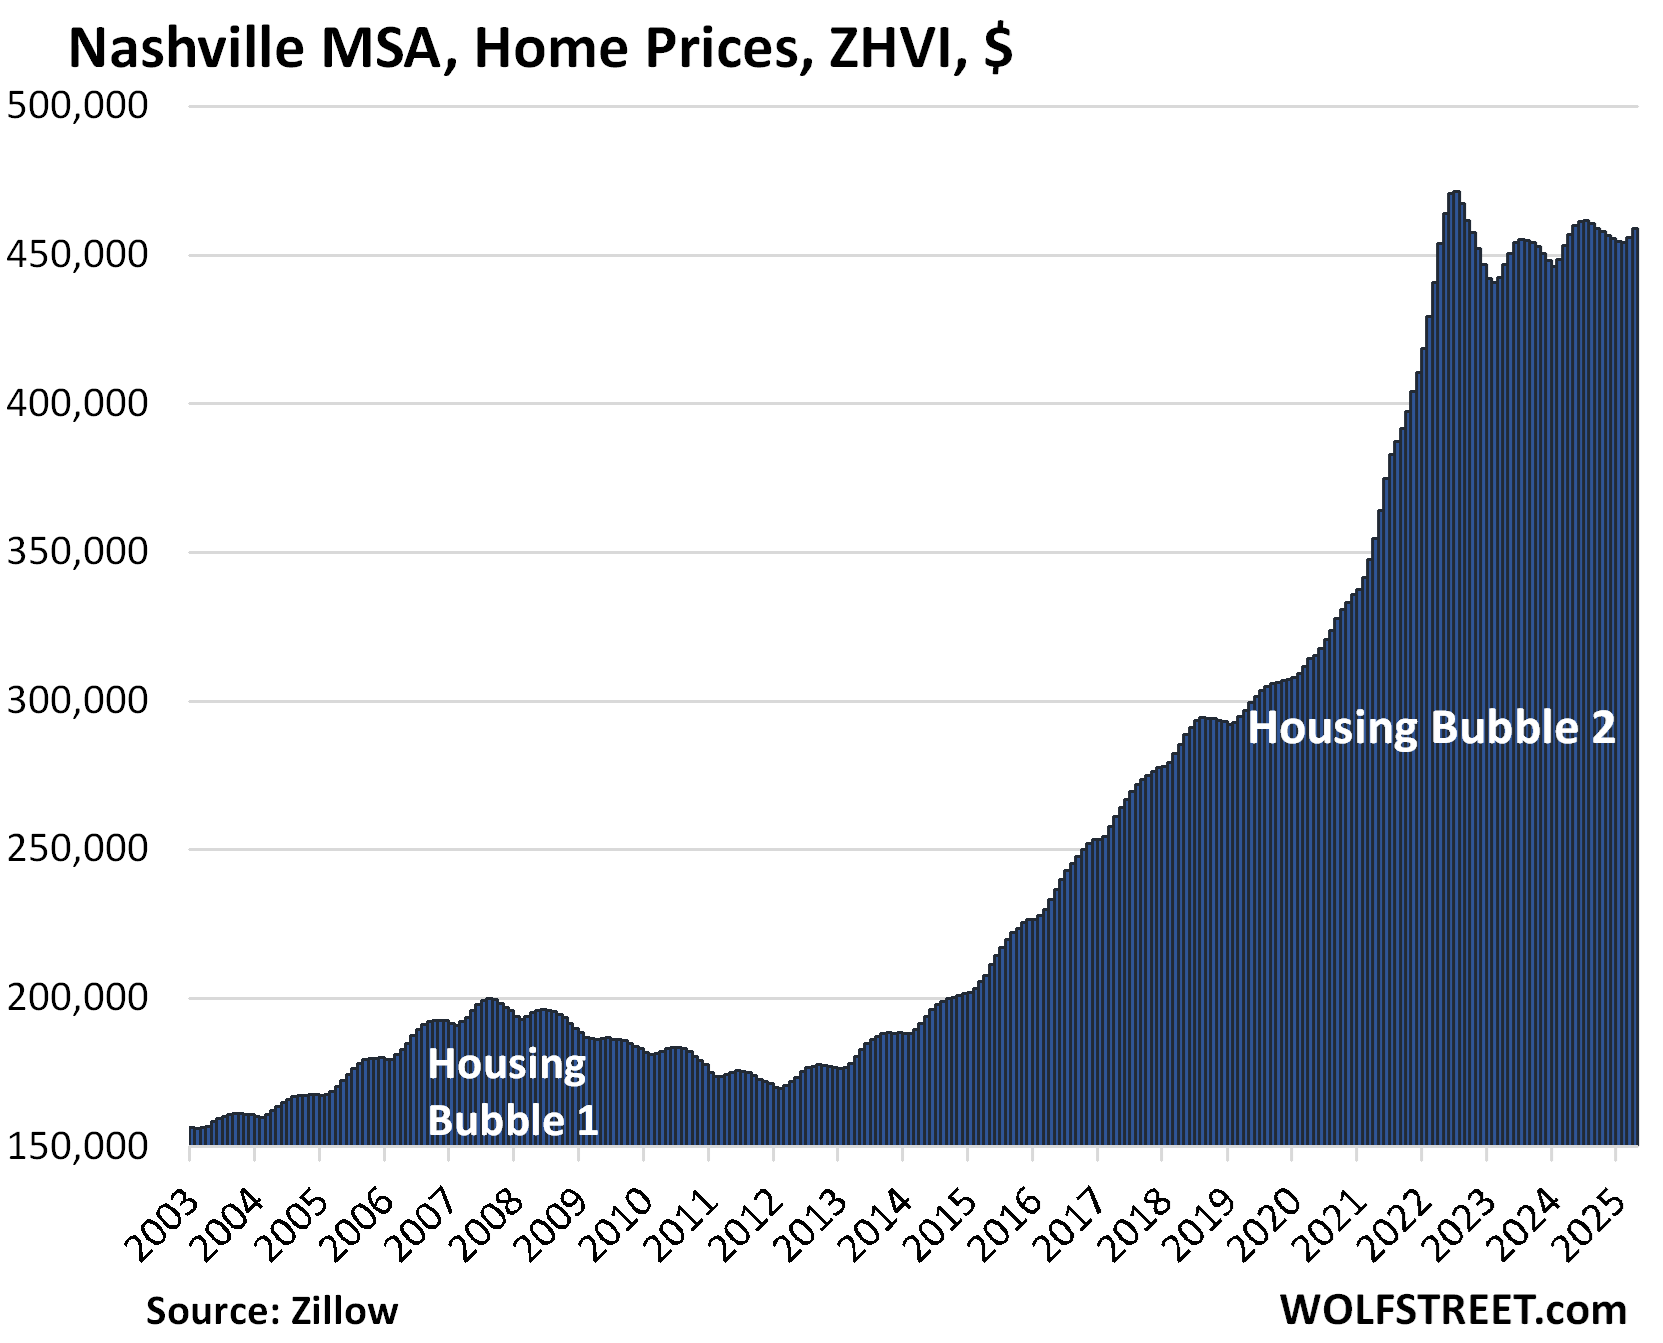
| Nashville MSA, Home Prices | |||
| From July 2022 peak | MoM | YoY | Since 2000 |
| -2.7% | 0.7% | 0.4% | 219% |
The YoY gains has continued to shrink. The index is where it had been in April 2022.
| Las Vegas MSA, Home Prices | |||
| From June 2022 peak | MoM | YoY | Since 2000 |
| -2.1% | 0.4% | 2.5% | 180% |
The YoY gain shrank from +3.3% in March and +4.25% in February.

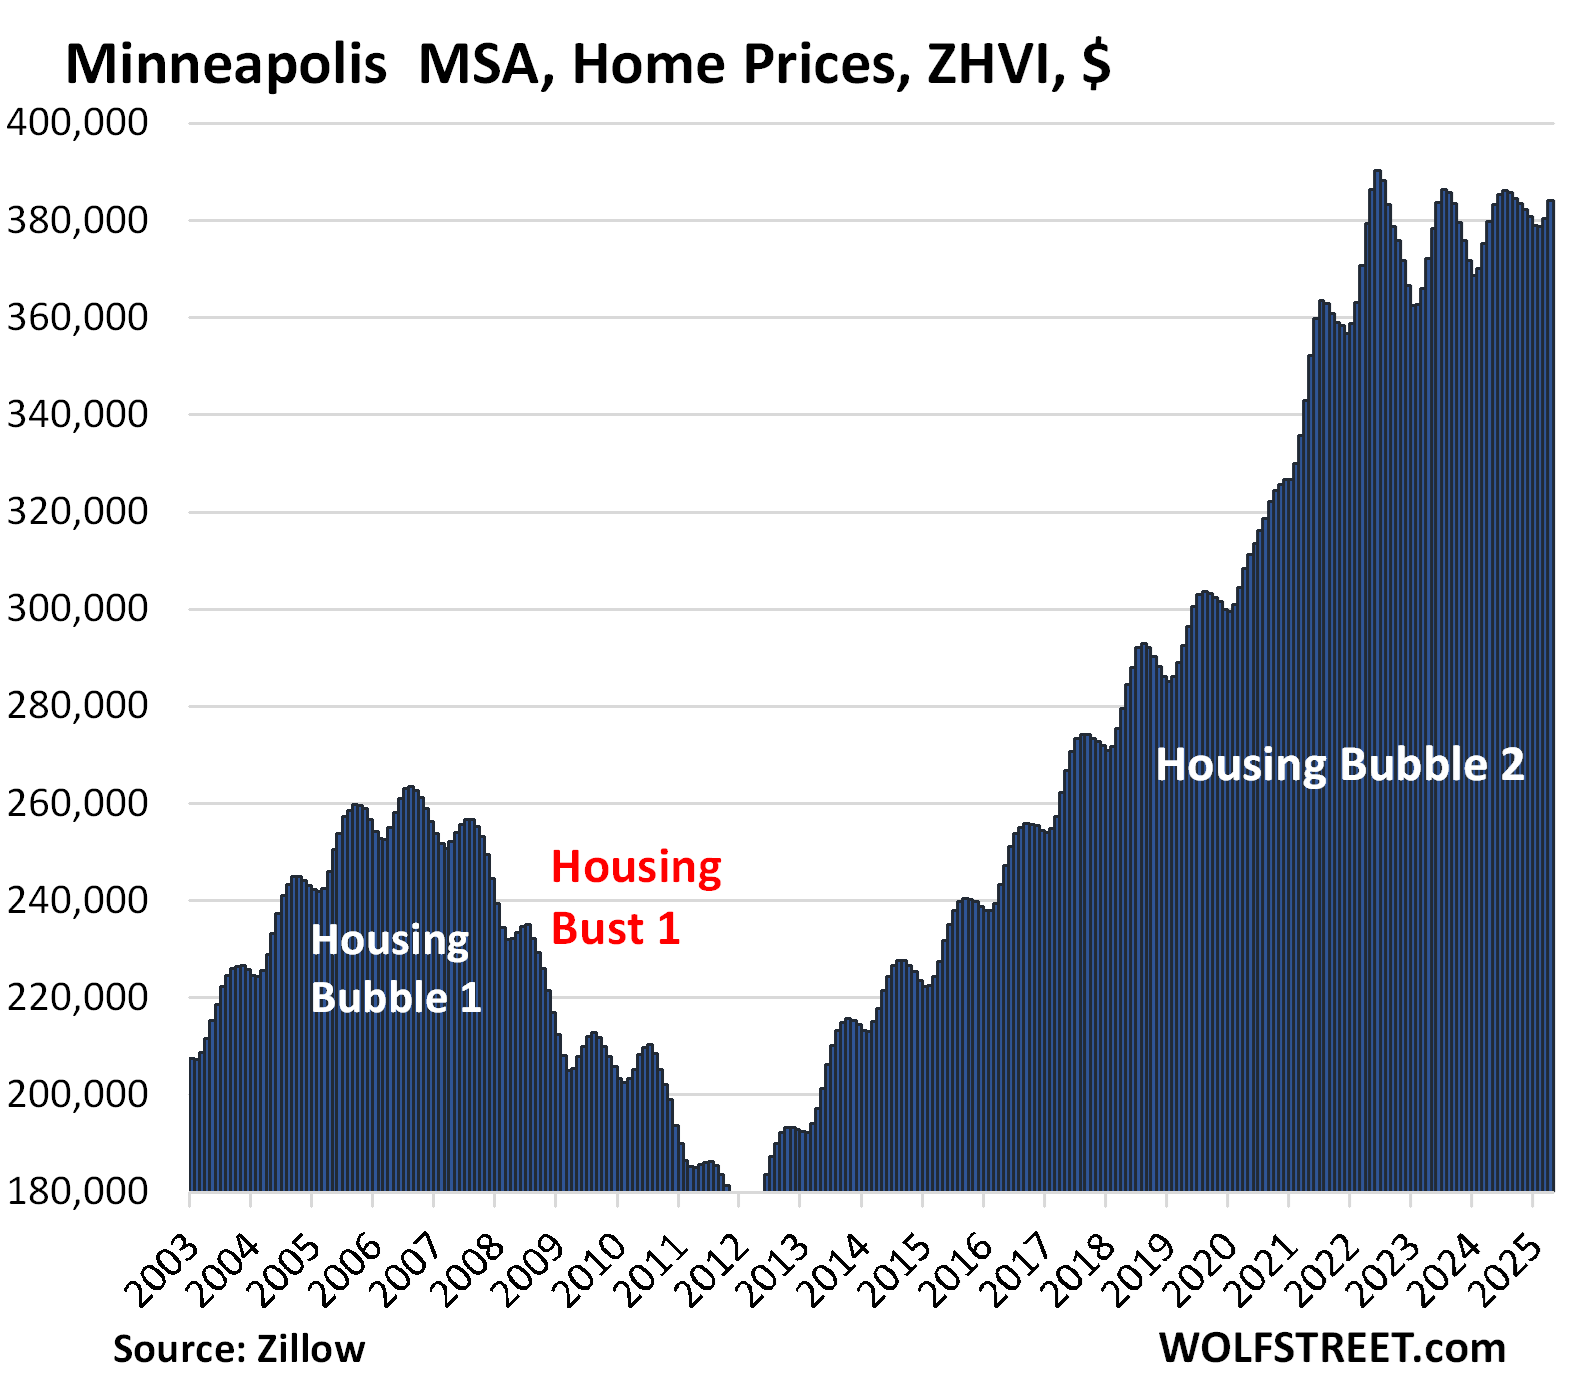
| Minneapolis MSA, Home Prices | |||
| From May 2022 peak | MoM | YoY | Since 2000 |
| -1.5% | 1.0% | 1.2% | 159% |
The YoY gain continues to shrink.
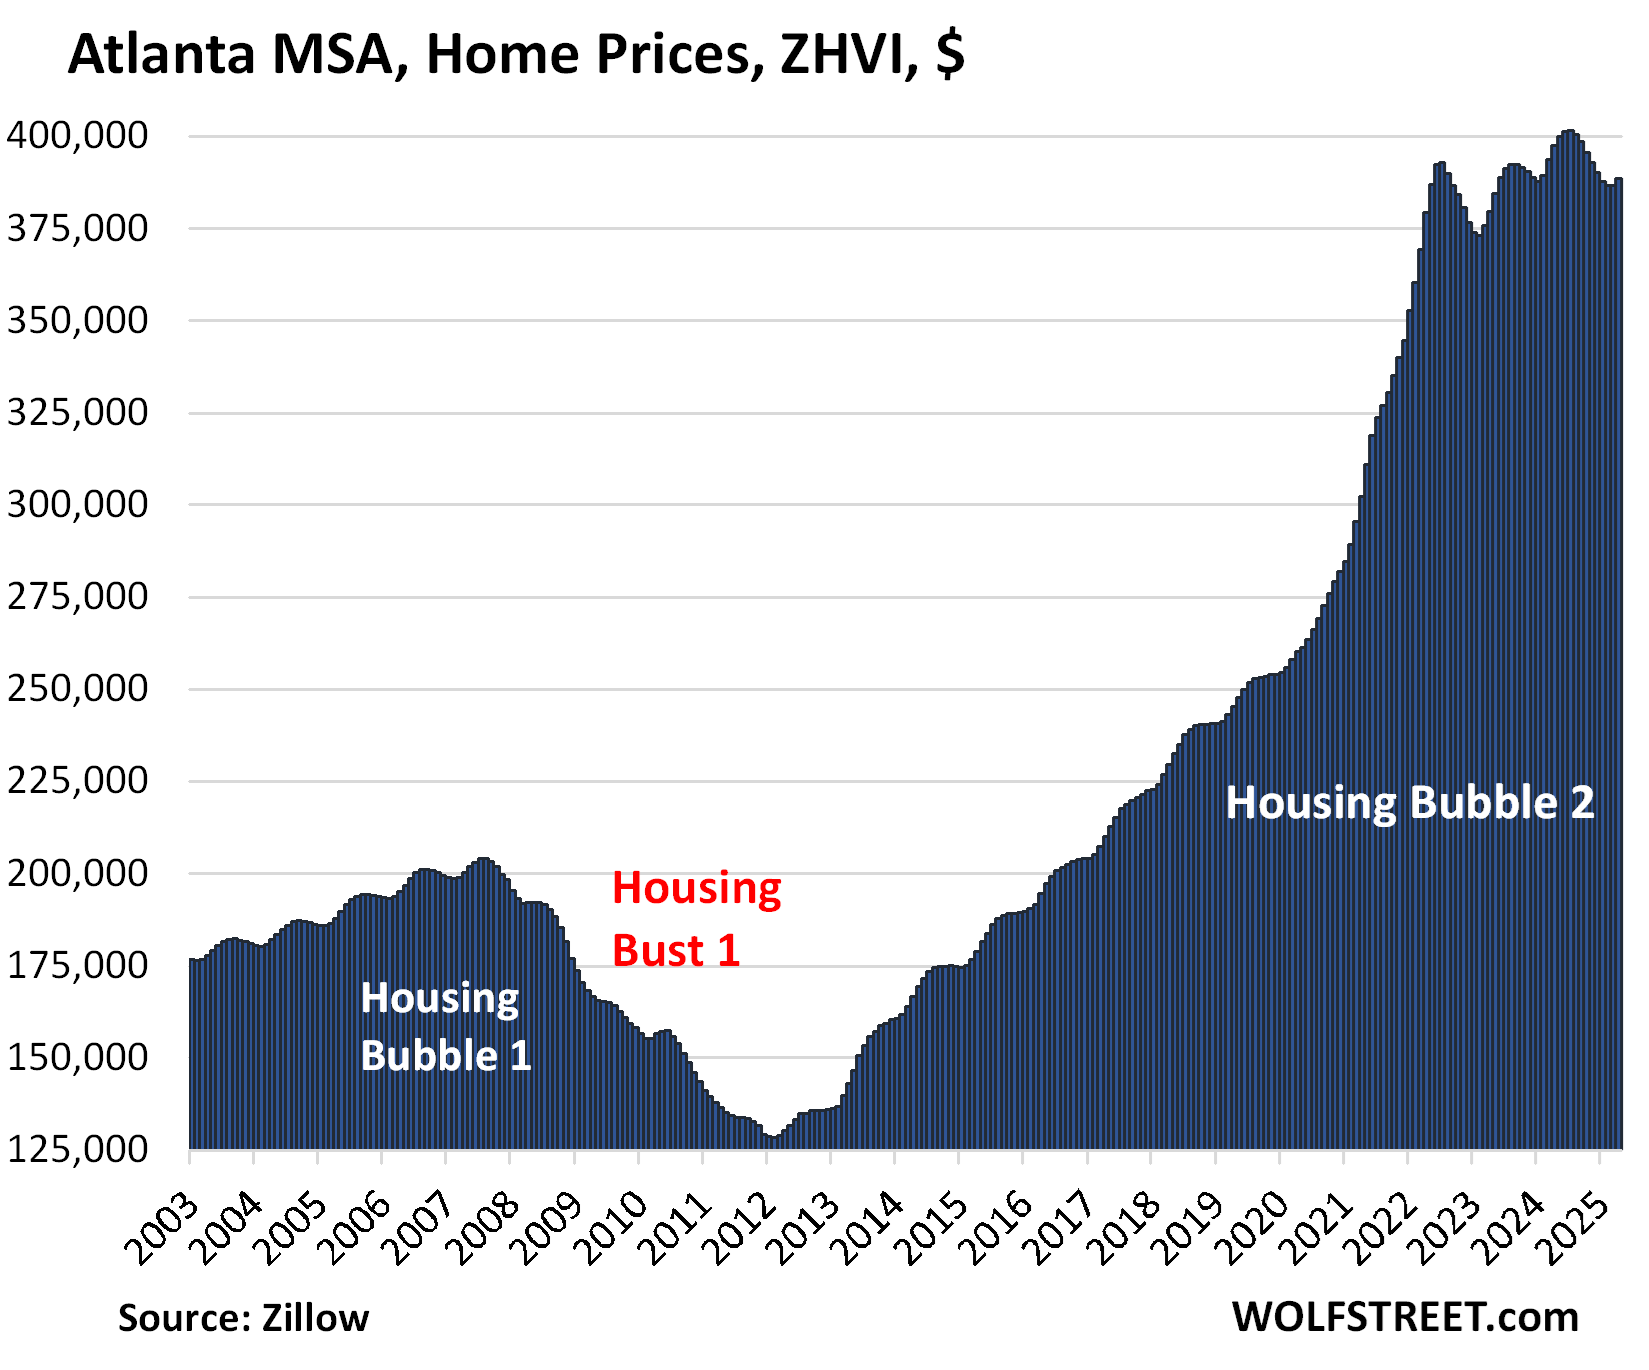
| Atlanta MSA, Home Prices | |||
| From July 2022 | MoM | YoY | Since 2000 |
| -1.1% | 0.4% | -2.3% | 159% |
The YoY decline worsened from -1.8% in March and -0.7% in February.
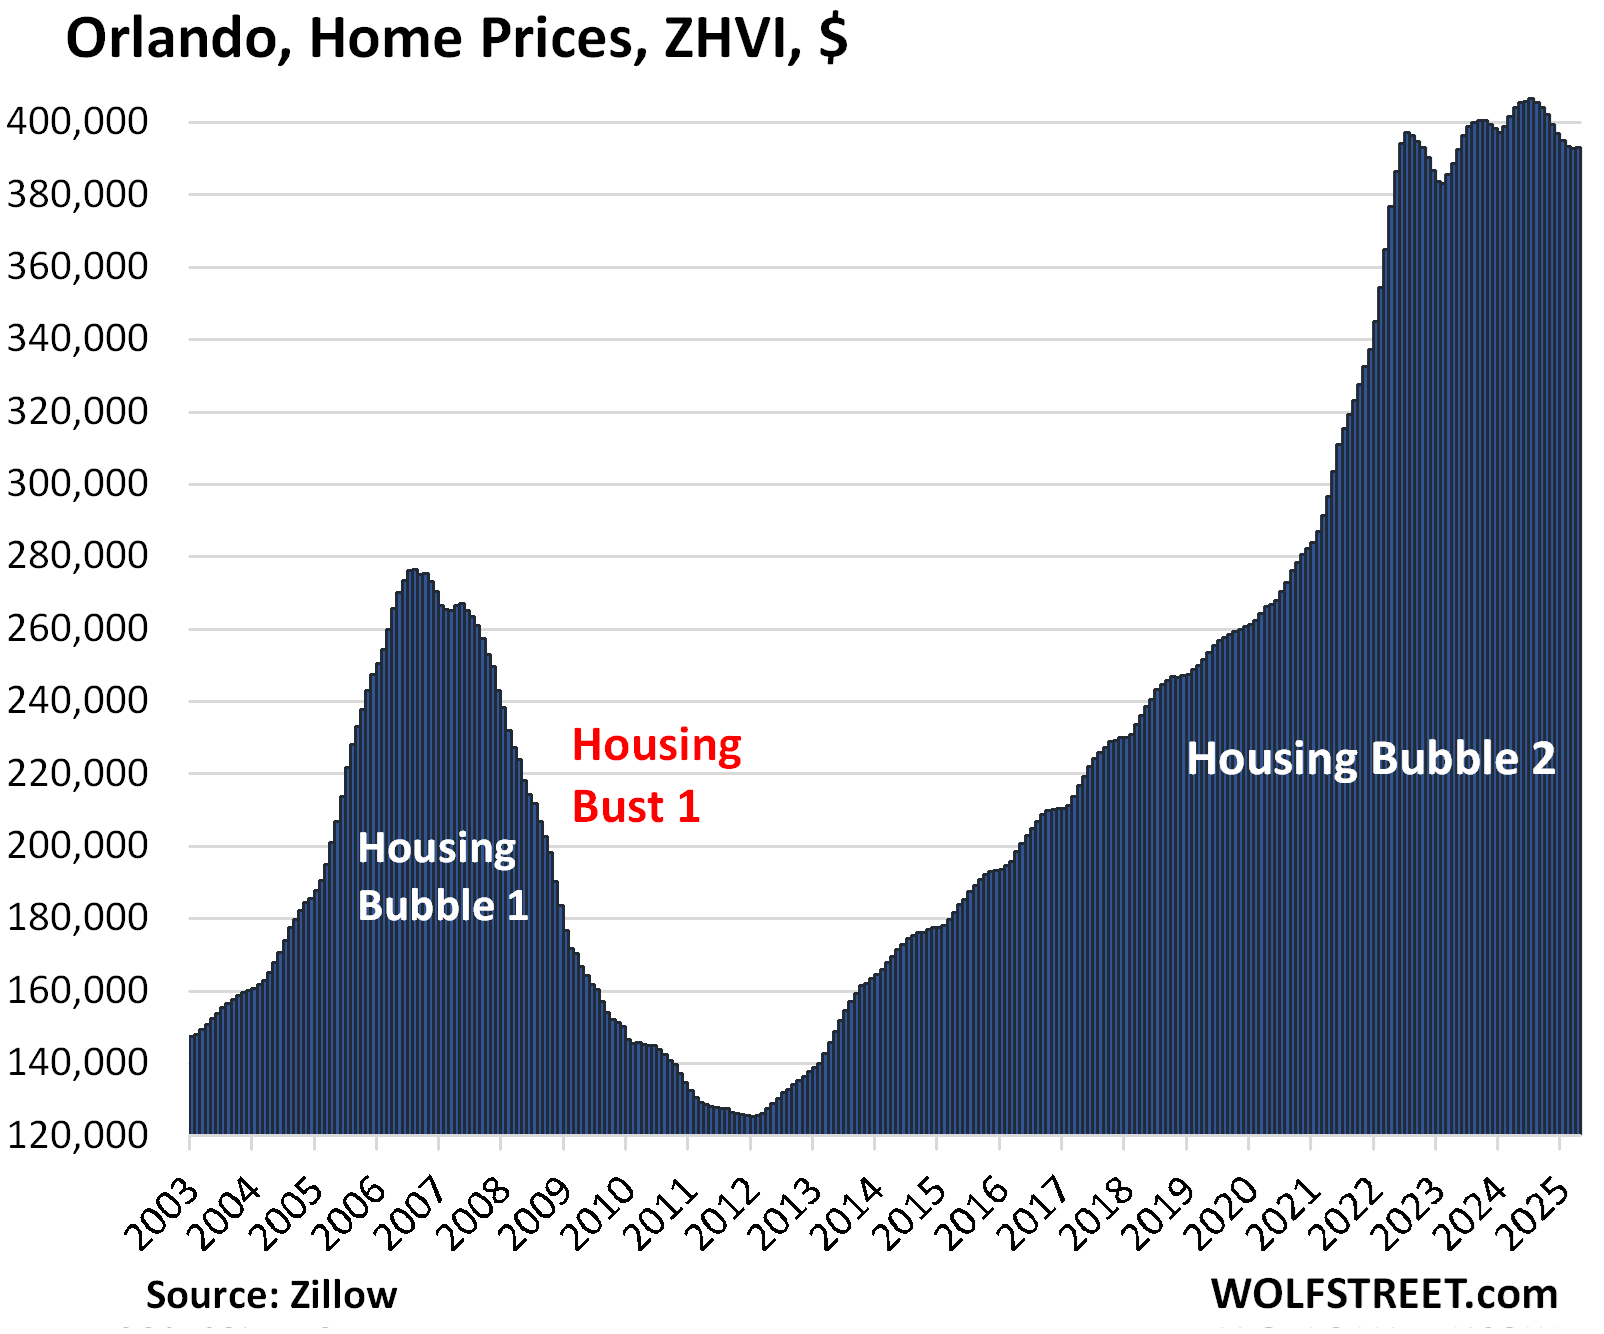
| Orlando MSA, Home Prices | |||
| From June 2022 | MoM | YoY | Since 2000 |
| -1.0% | 0.1% | -2.7% | 231% |
YoY decline worsened from -2.2% in March and -1.4% in February.
The 14 markets are higher than in mid-2022:
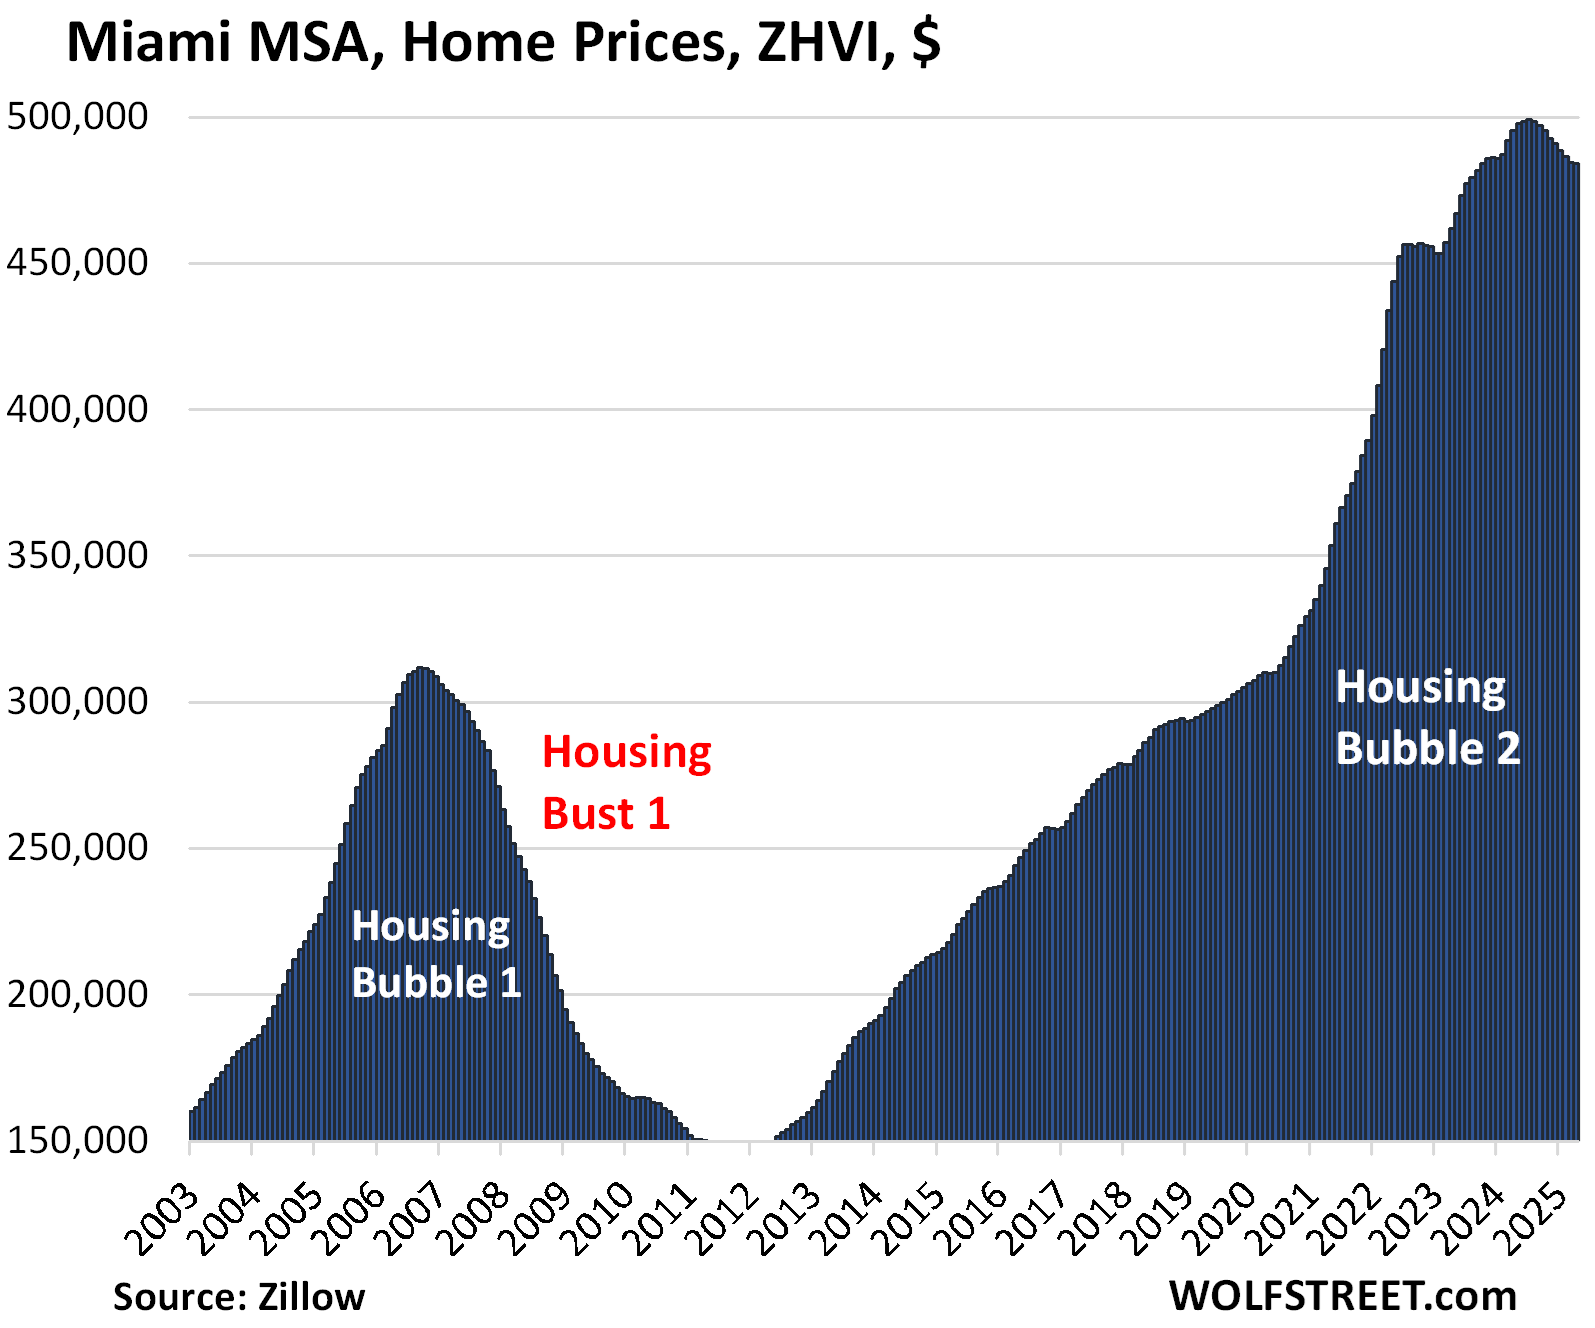
| Miami MSA, Home Prices | ||
| MoM | YoY | Since 2000 |
| -0.1% | -2.3% | 324% |
The YoY decline worsened from -1.5% in March and -0.2% in February. Since the high in July 2024, the index has dropped by 3.0%.
| San Diego MSA, Home Prices | ||
| MoM | YoY | Since 2000 |
| 0.3% | -0.9% | 335% |
The YoY change flipped to negative from +0.5% in March and +2.3% in February.

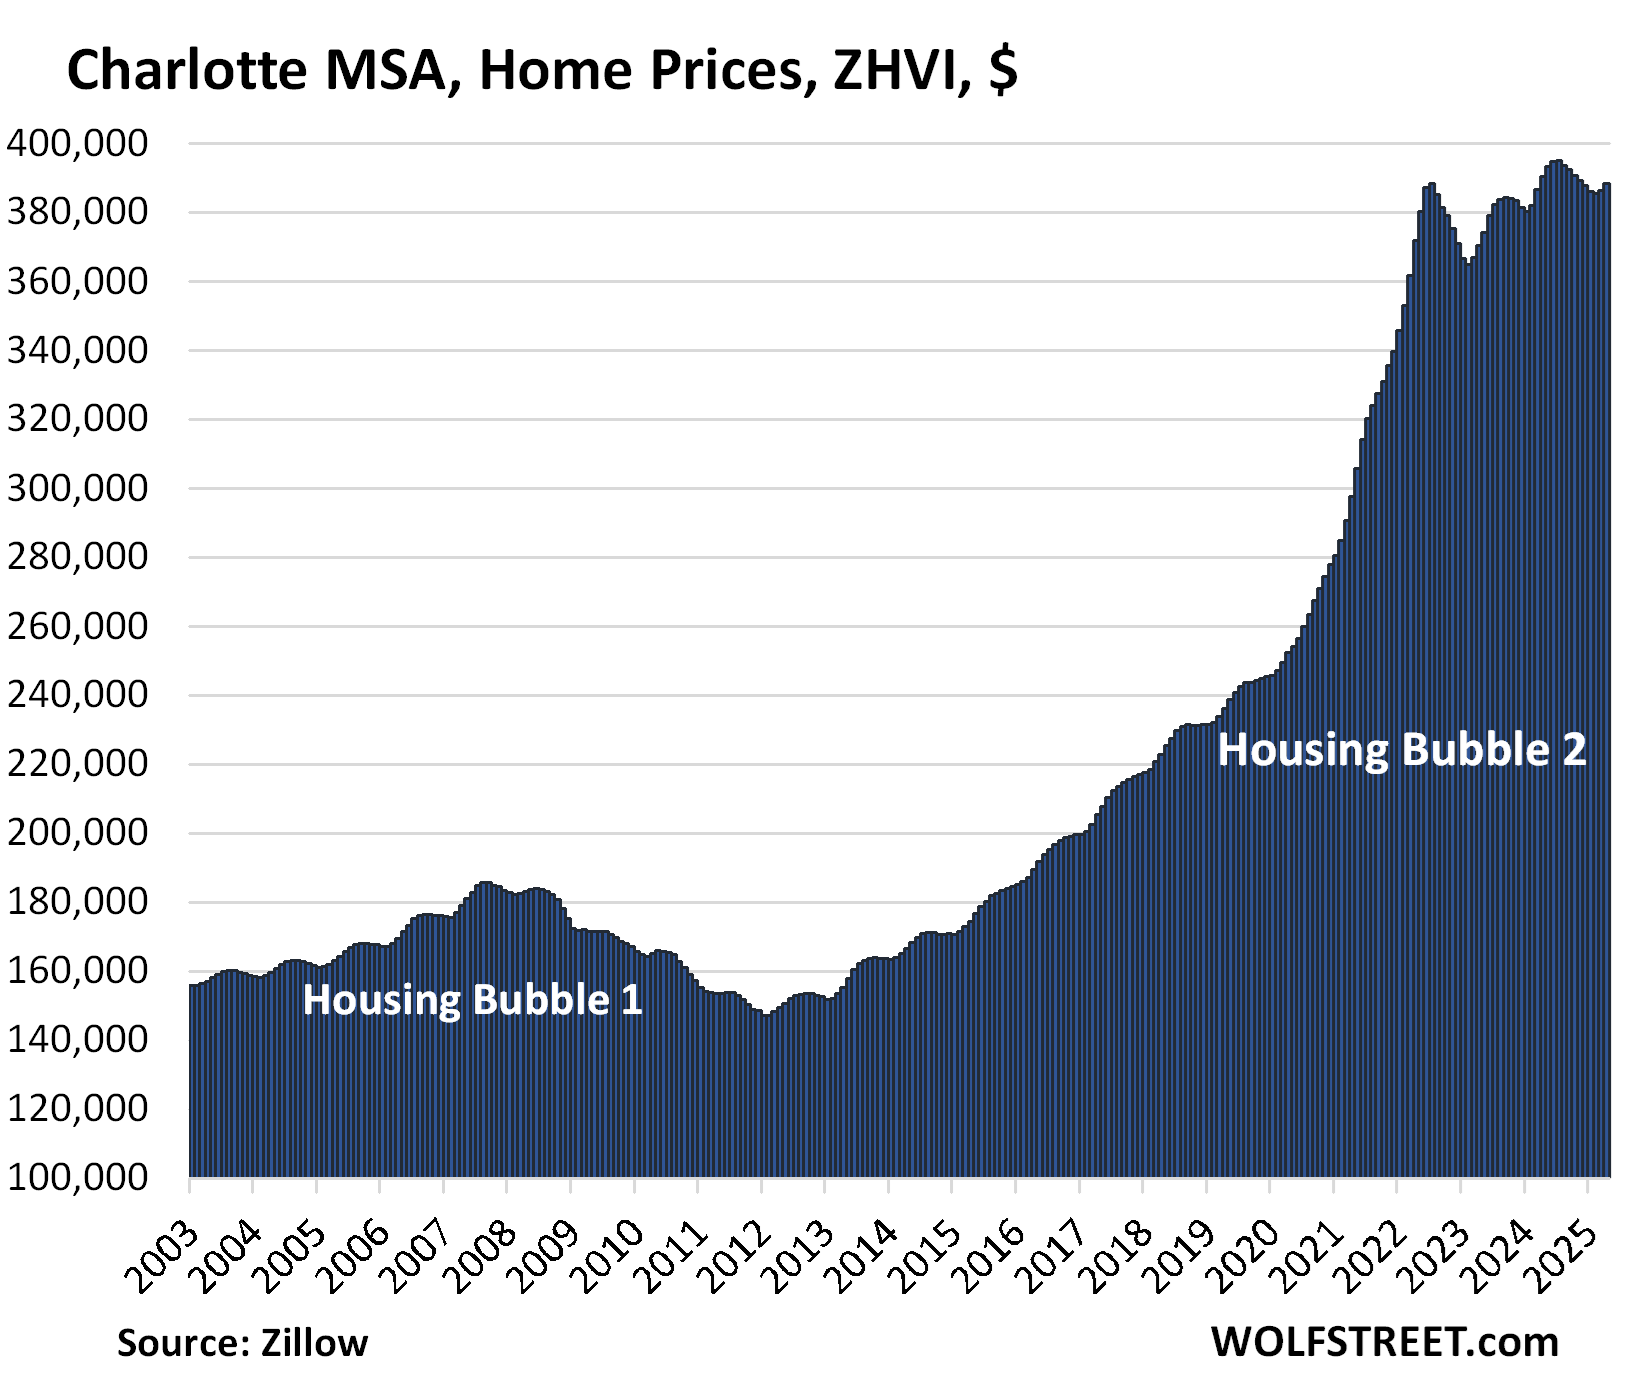
| Charlotte MSA, Home Prices | ||
| MoM | YoY | Since 2000 |
| 0.5% | -0.6% | 170% |
The YoY decline worsened from -0.1% in March when it had flipped from a gain of +0.9% in February.
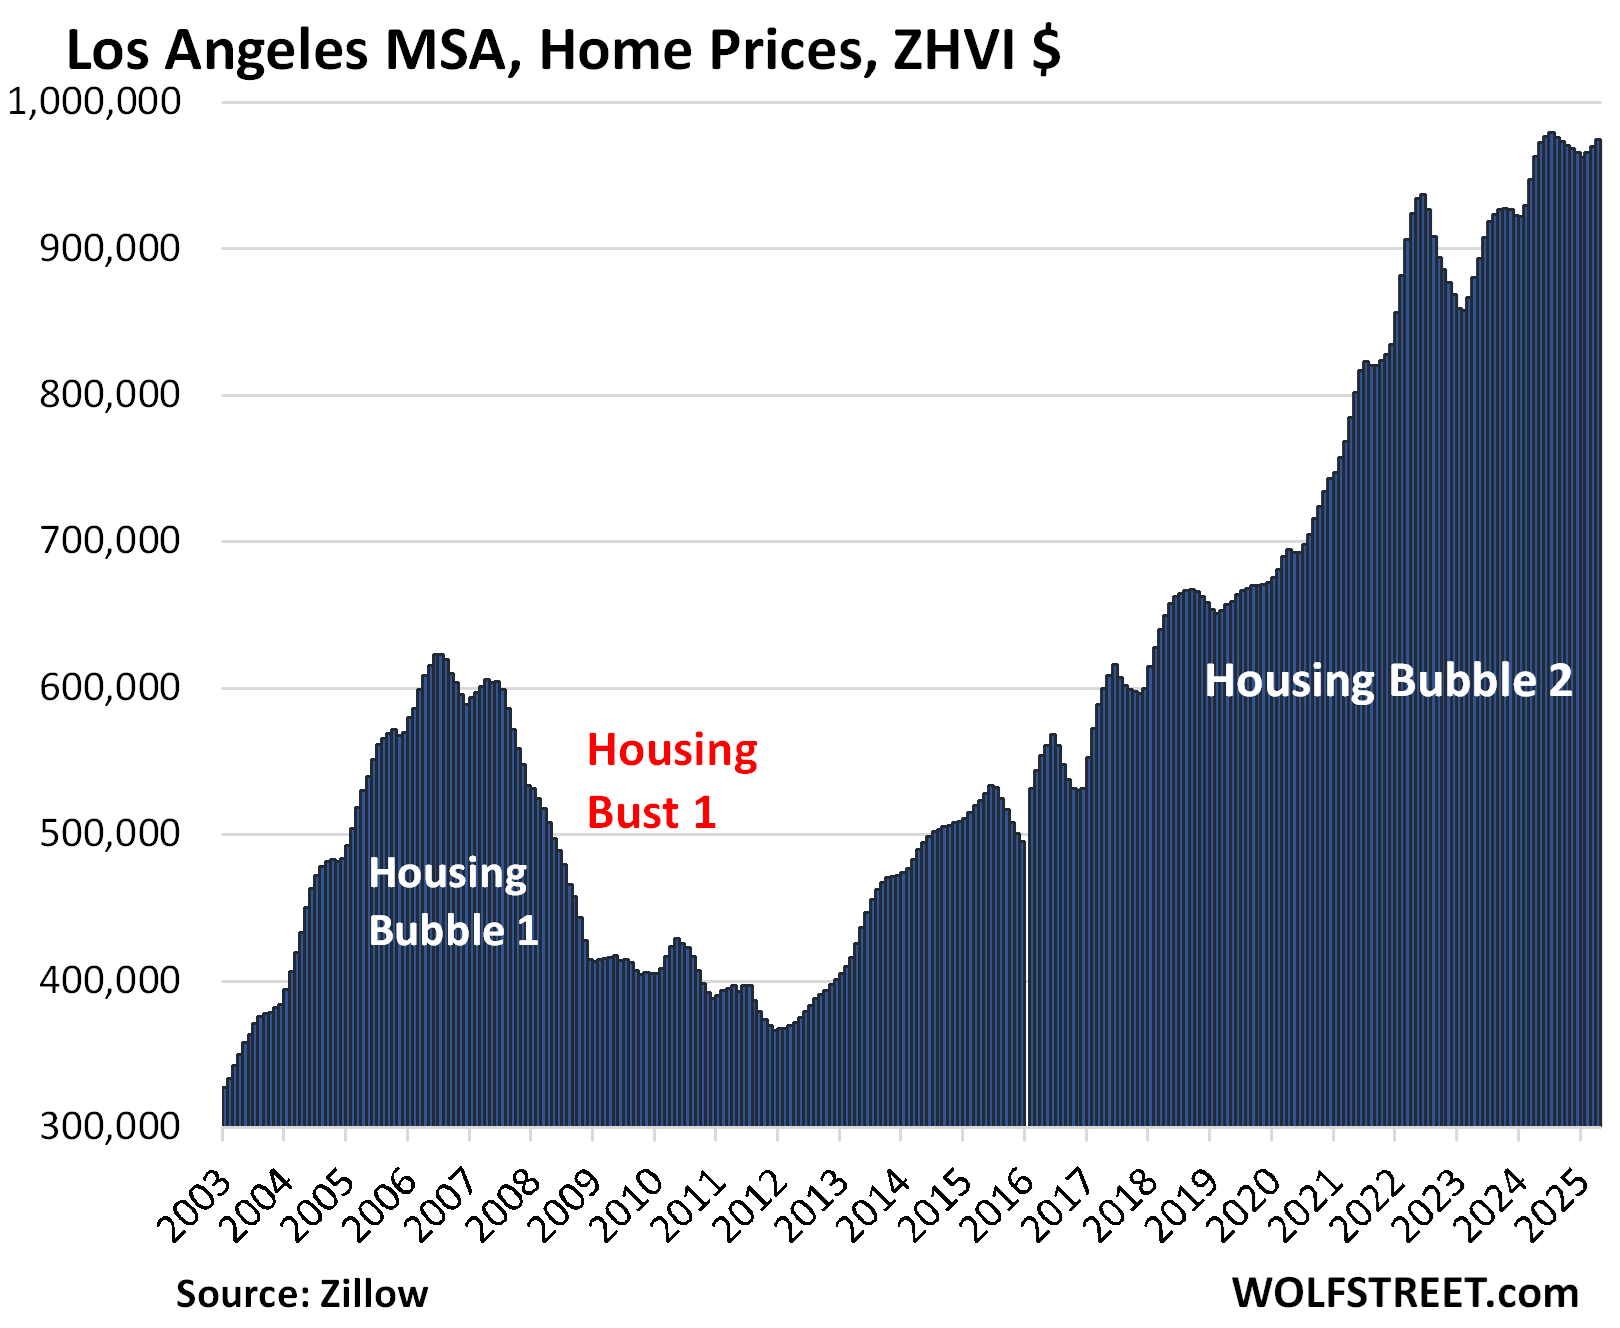
| Los Angeles MSA, Home Prices | ||
| MoM | YoY | Since 2000 |
| 0.5% | 1.2% | 333% |
The YoY gain declined from +2.4% in March and +3.9% in February.
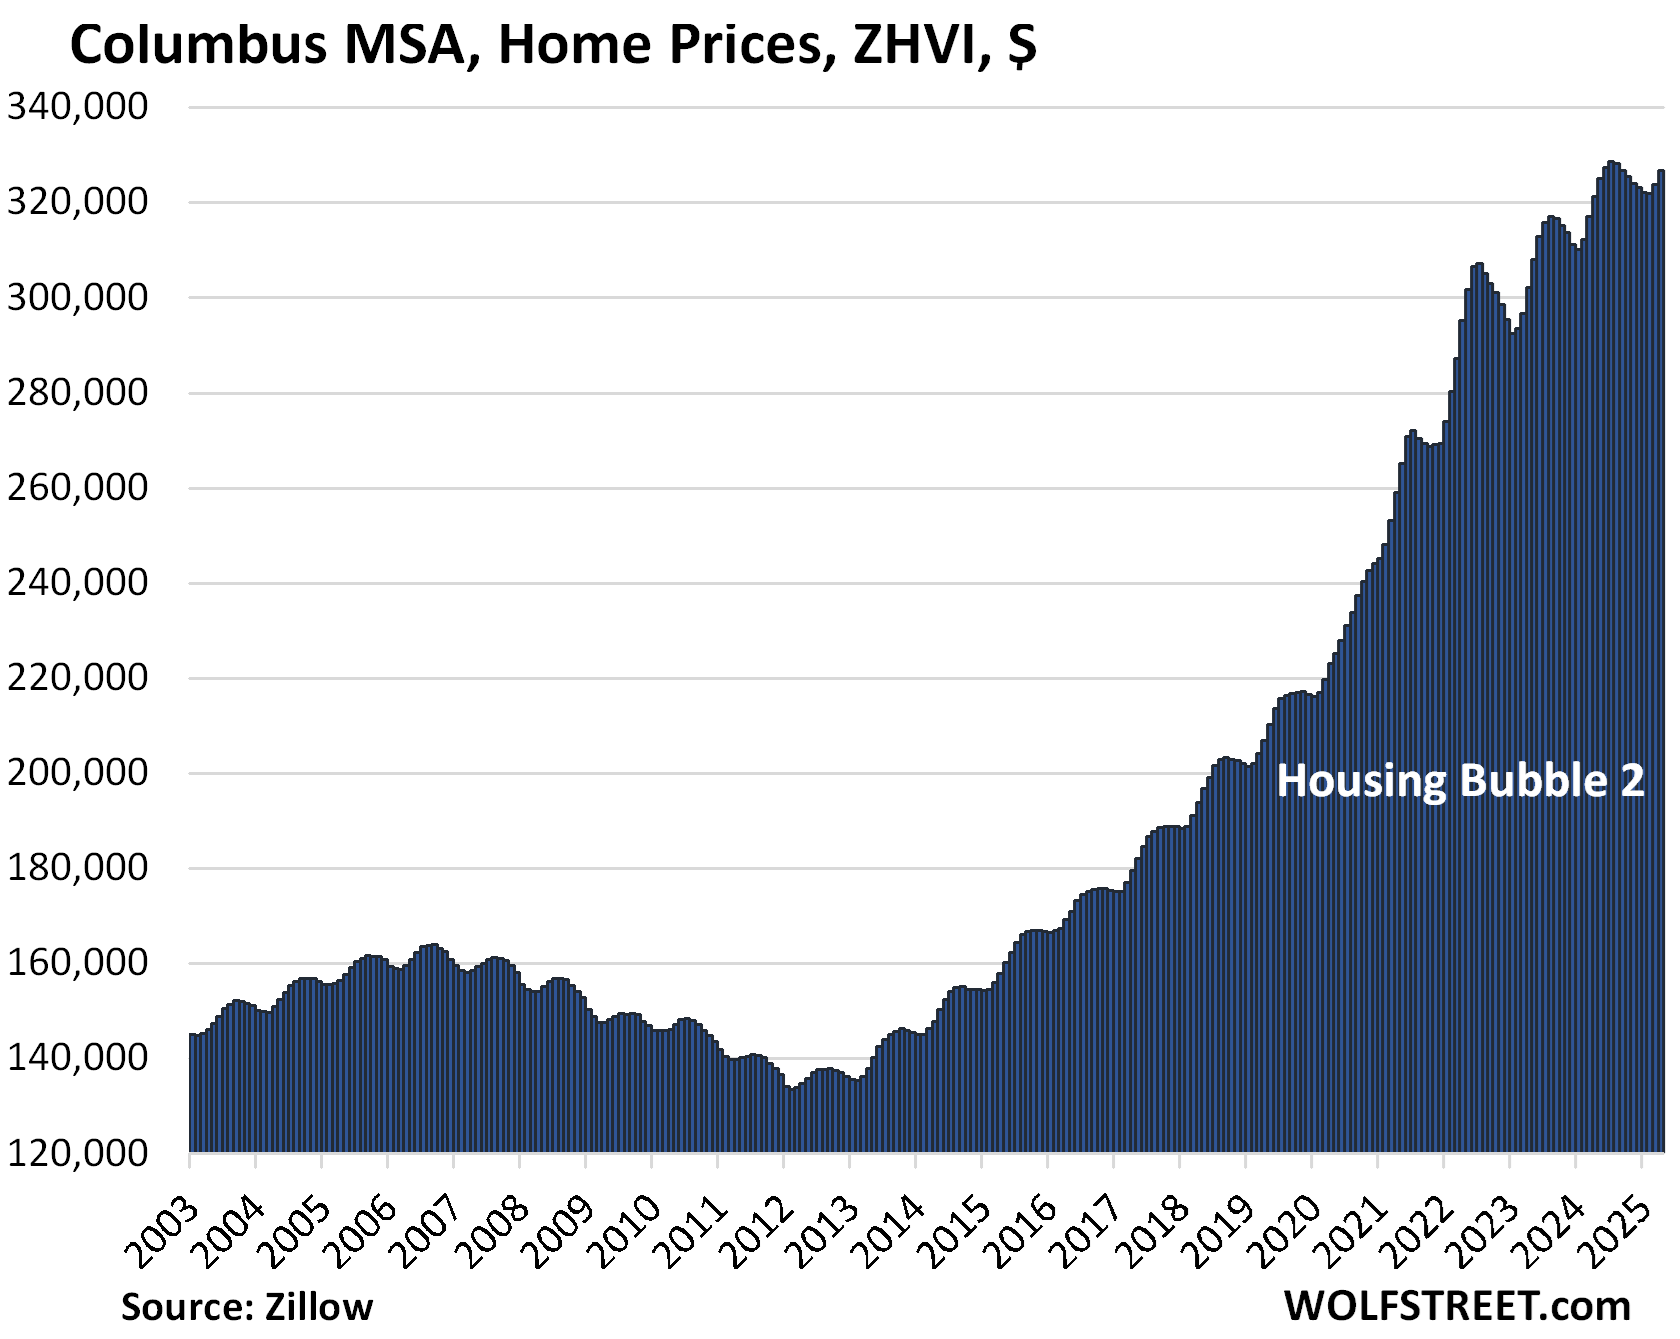
| Columbus MSA, Home Prices | ||
| MoM | YoY | Since 2000 |
| 0.9% | 1.7% | 155% |
The YoY increase shrank from +2.1% in March and +3.1% in February.
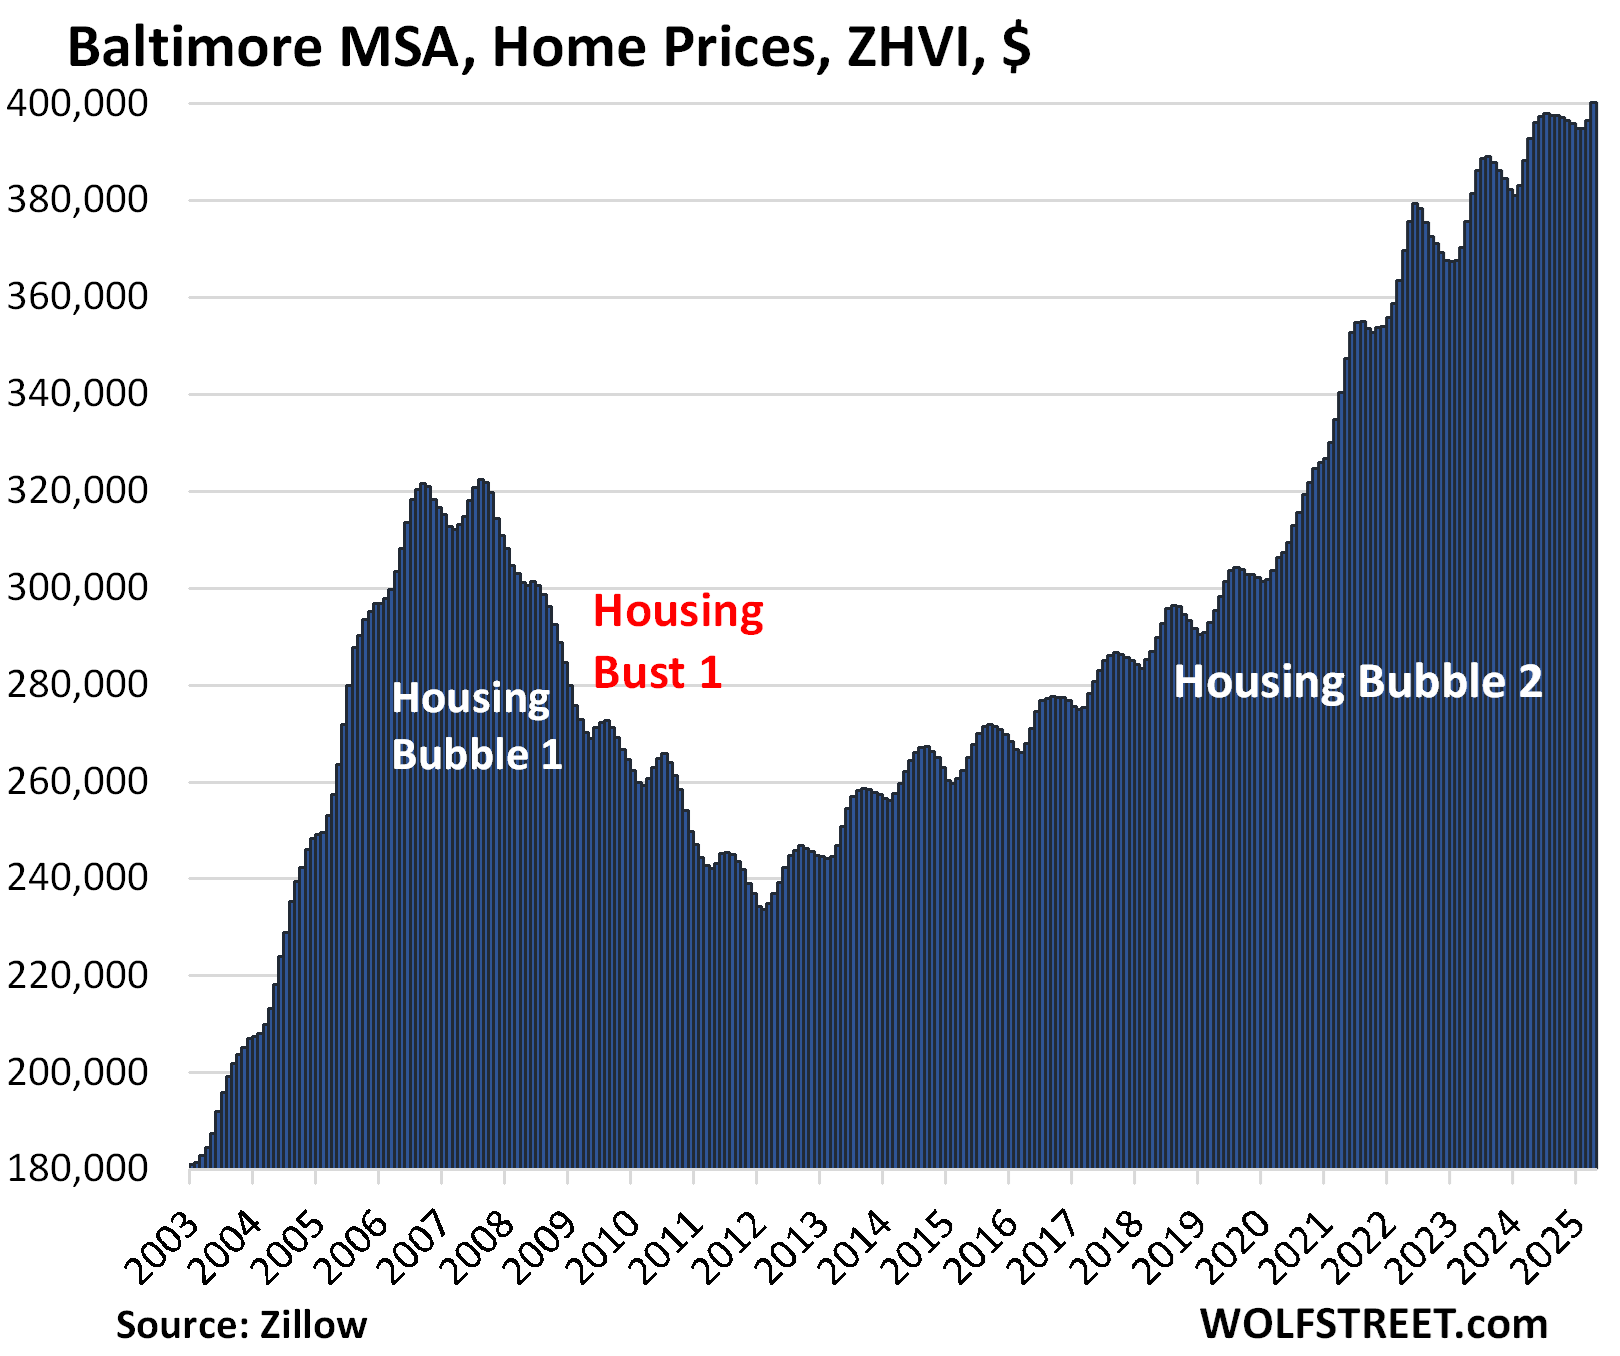
| Baltimore MSA, Home Prices | |||
| MoM | YoY | Since 2000 | |
| 0.9% | 1.9% | 176% | |
The YoY gain shrank from +2.25 in March and +3.1% in February.
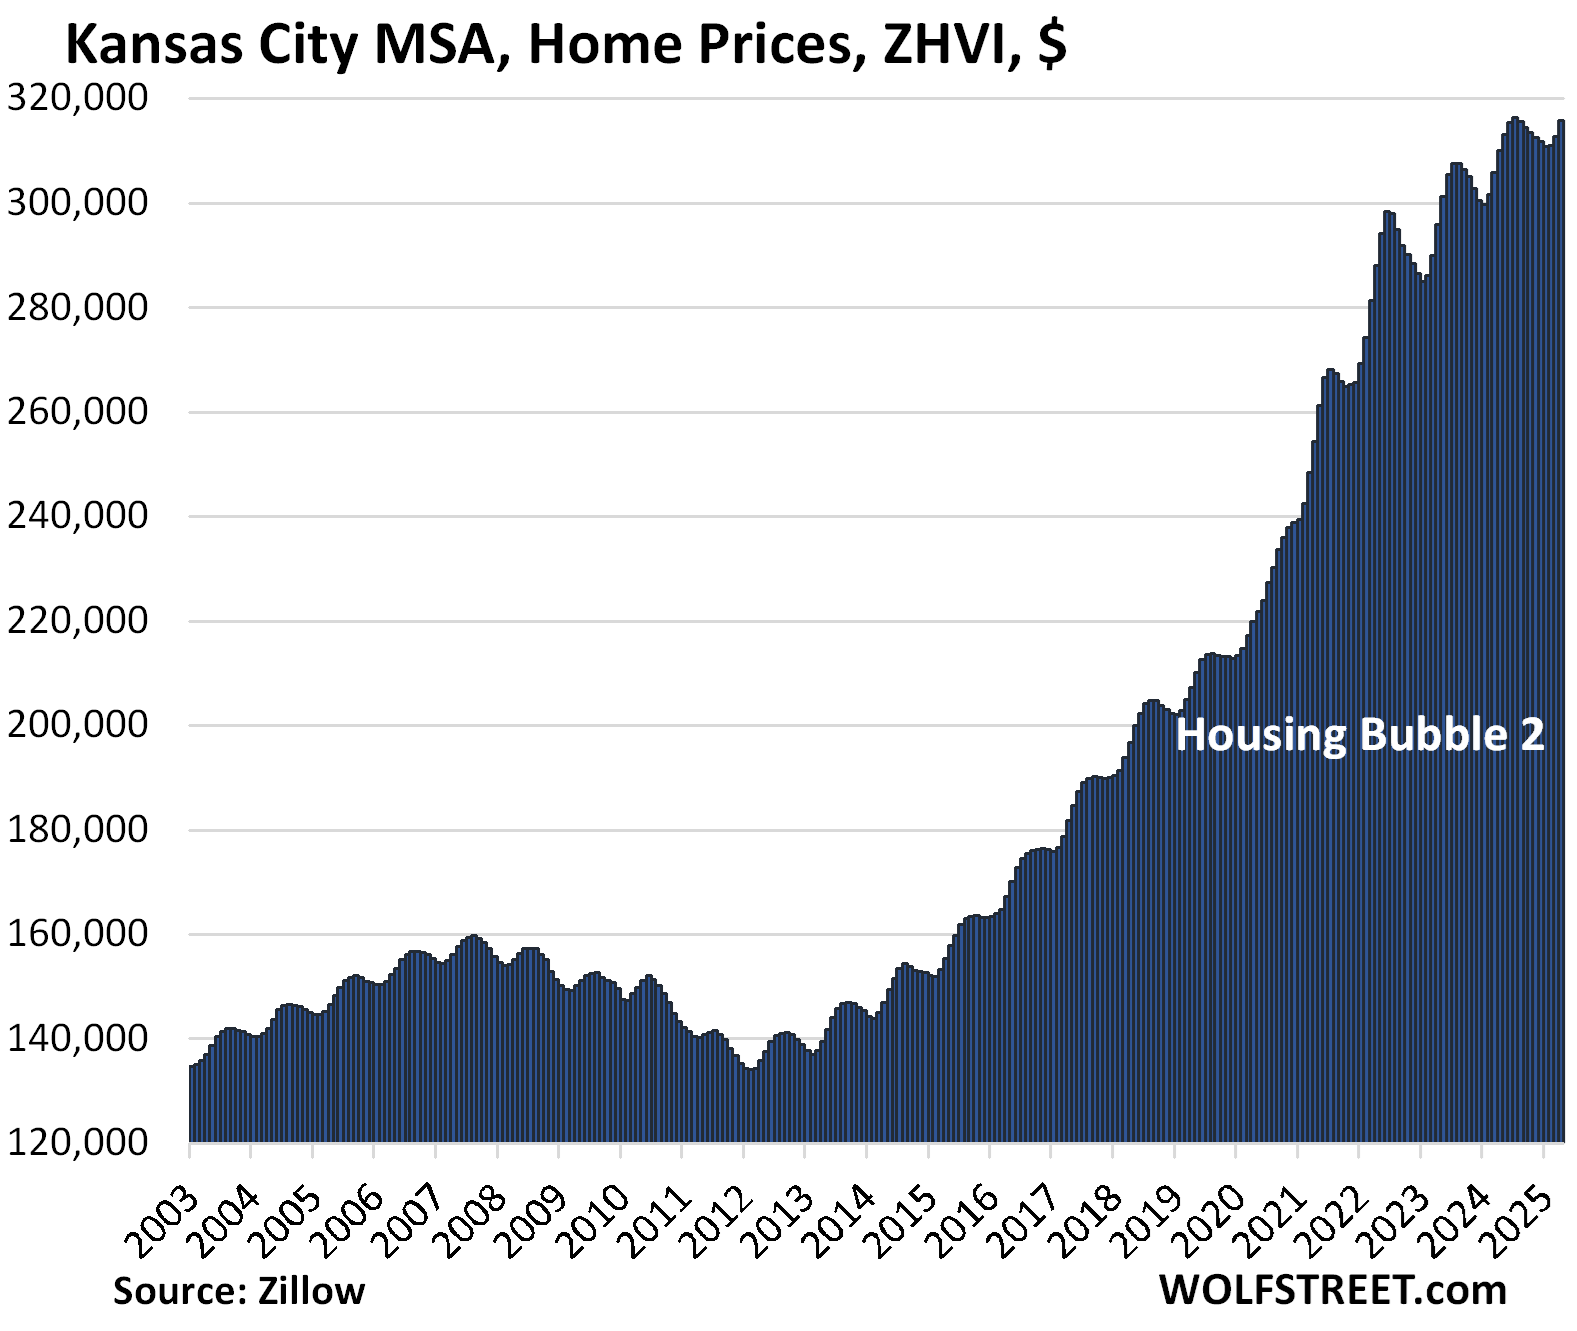
| Kansas City MSA, Home Prices | ||
| MoM | YoY | Since 2000 |
| 1.0% | 1.9% | 179% |
The YoY increase declined from +2.2% in March and +3.1% in February.
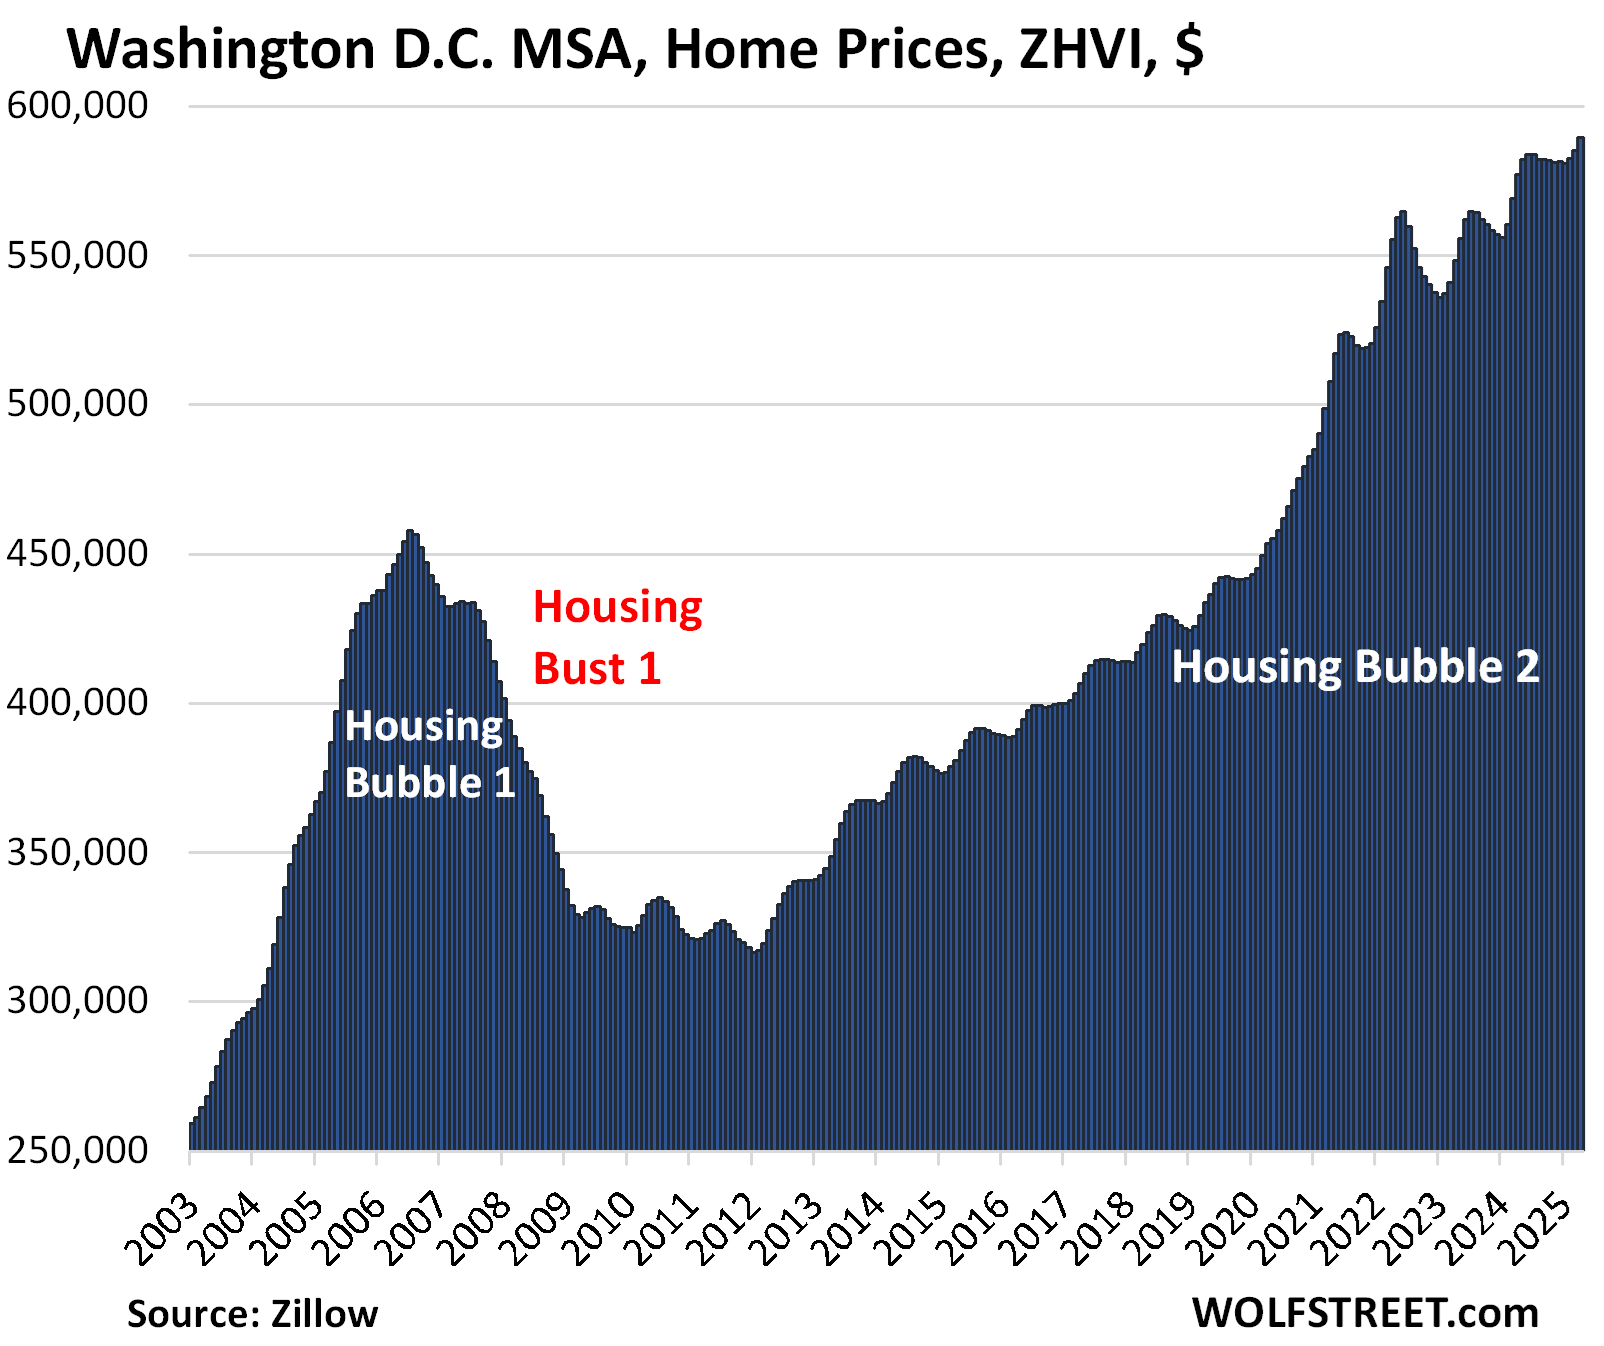
| Washington D.C. MSA, Home Prices | ||
| MoM | YoY | Since 2000 |
| 0.8% | 2.1% | 219% |
The YoY gain declined from +2.8% in March and +4.0% in February.
The vast and diverse metro includes Washington D.C. and parts of Maryland, Virginia, and West Virginia.
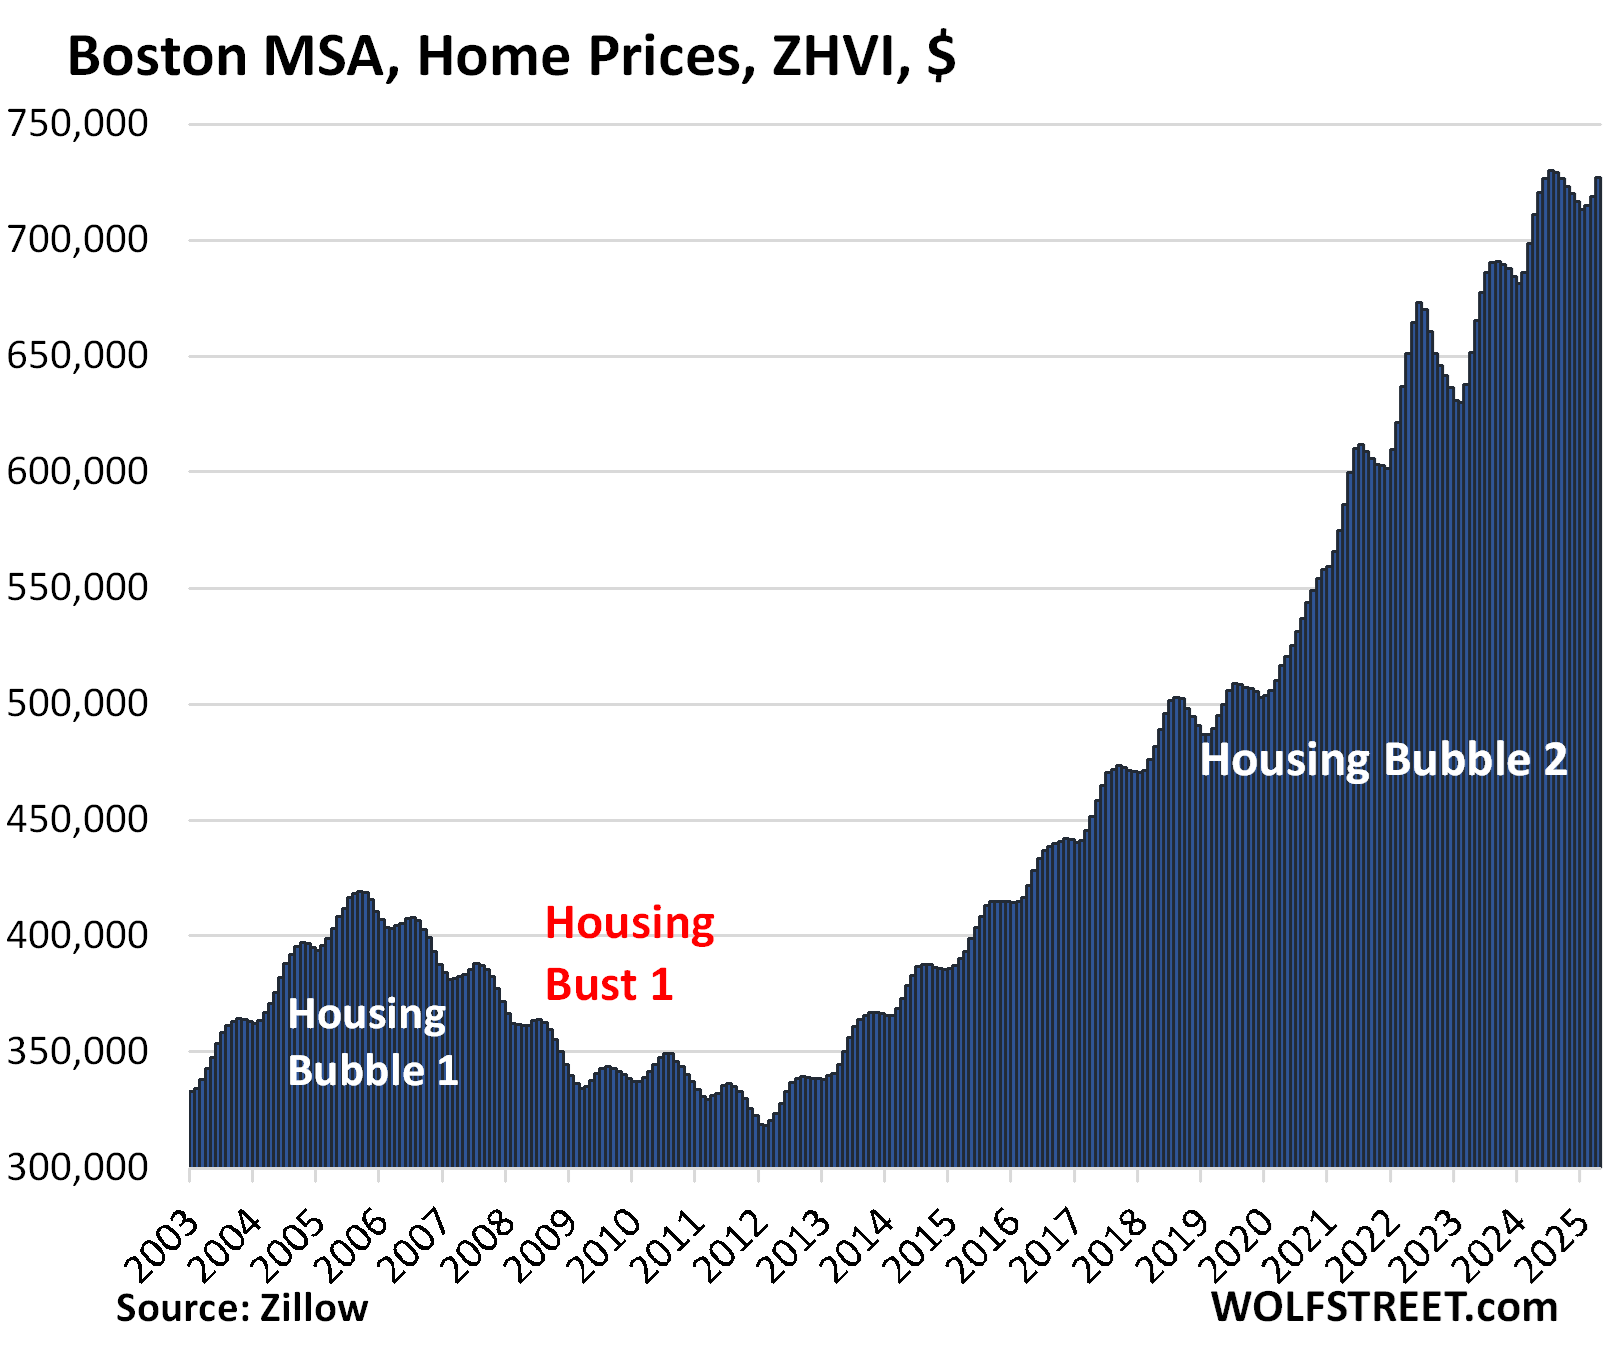
| Boston MSA, Home Prices | ||
| MoM | YoY | Since 2000 |
| 1.1% | 2.2% | 228% |
The YoY gain declined from +2.9% in March and +4.2% in February.
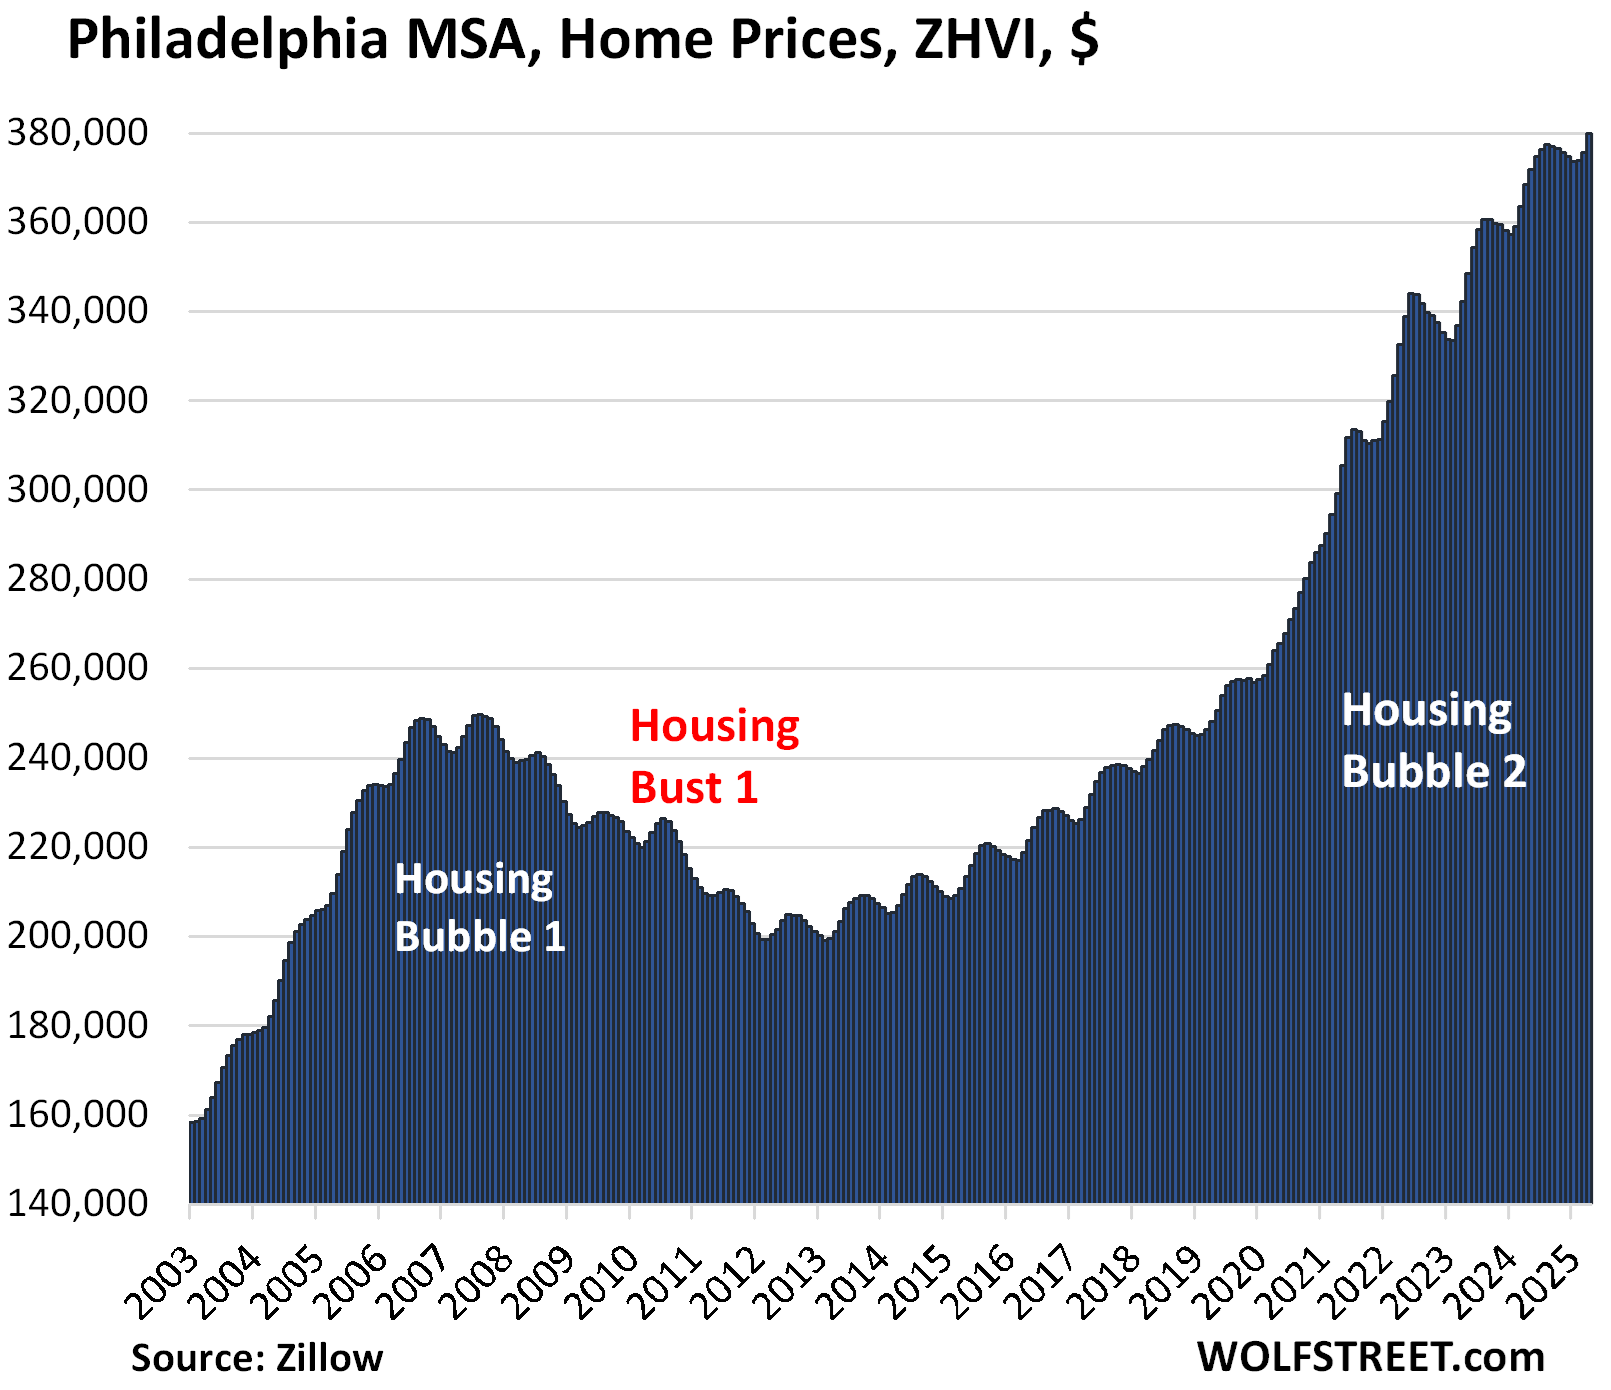
| Philadelphia MSA, Home Prices | ||
| MoM | YoY | Since 2000 |
| 1.1% | 3.1% | 204% |
The YoY gain declined from +3.3% in March and +4.1% in February.
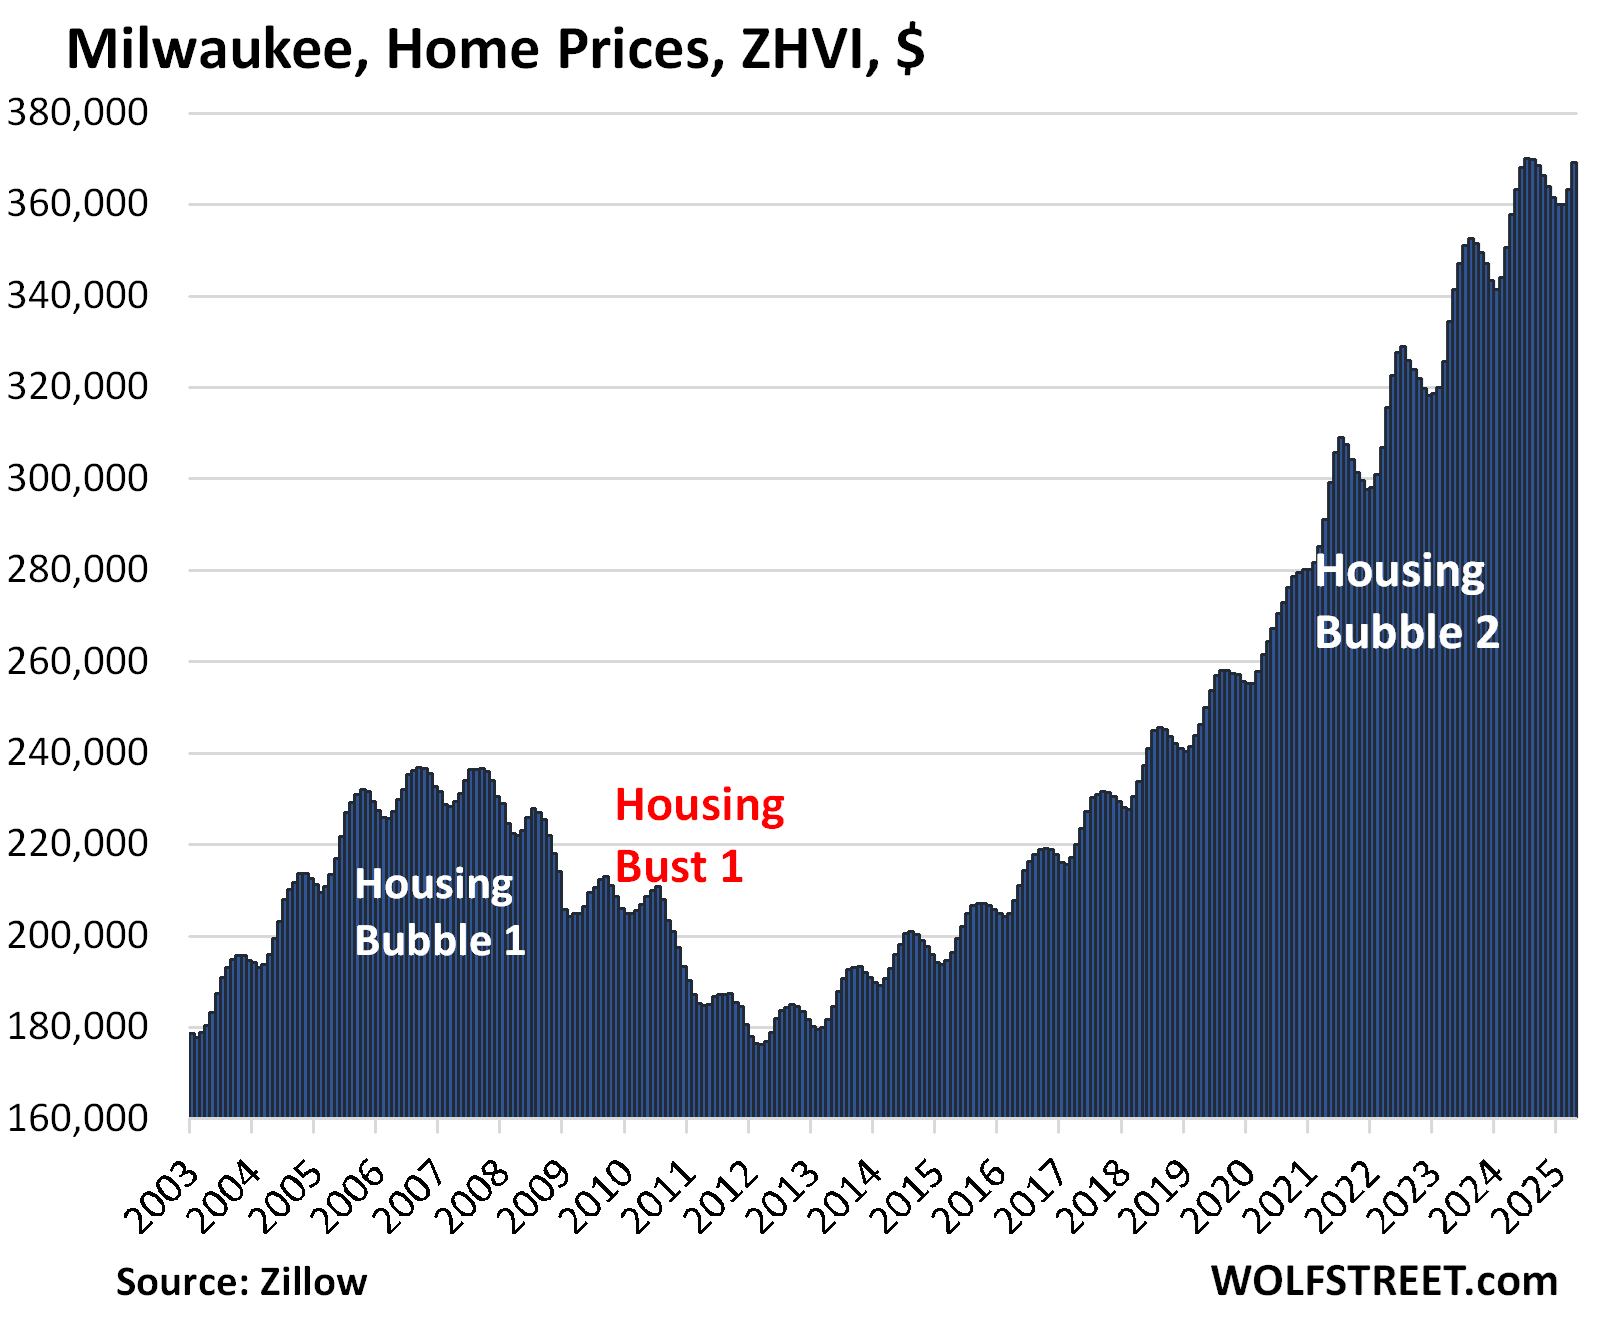
| Milwaukee MSA, Home Prices | ||
| MoM | YoY | Since 2000 |
| 1.7% | 3.2% | 147.5% |
The YoY gain declined from +3.6% in March and +4.7% in February.
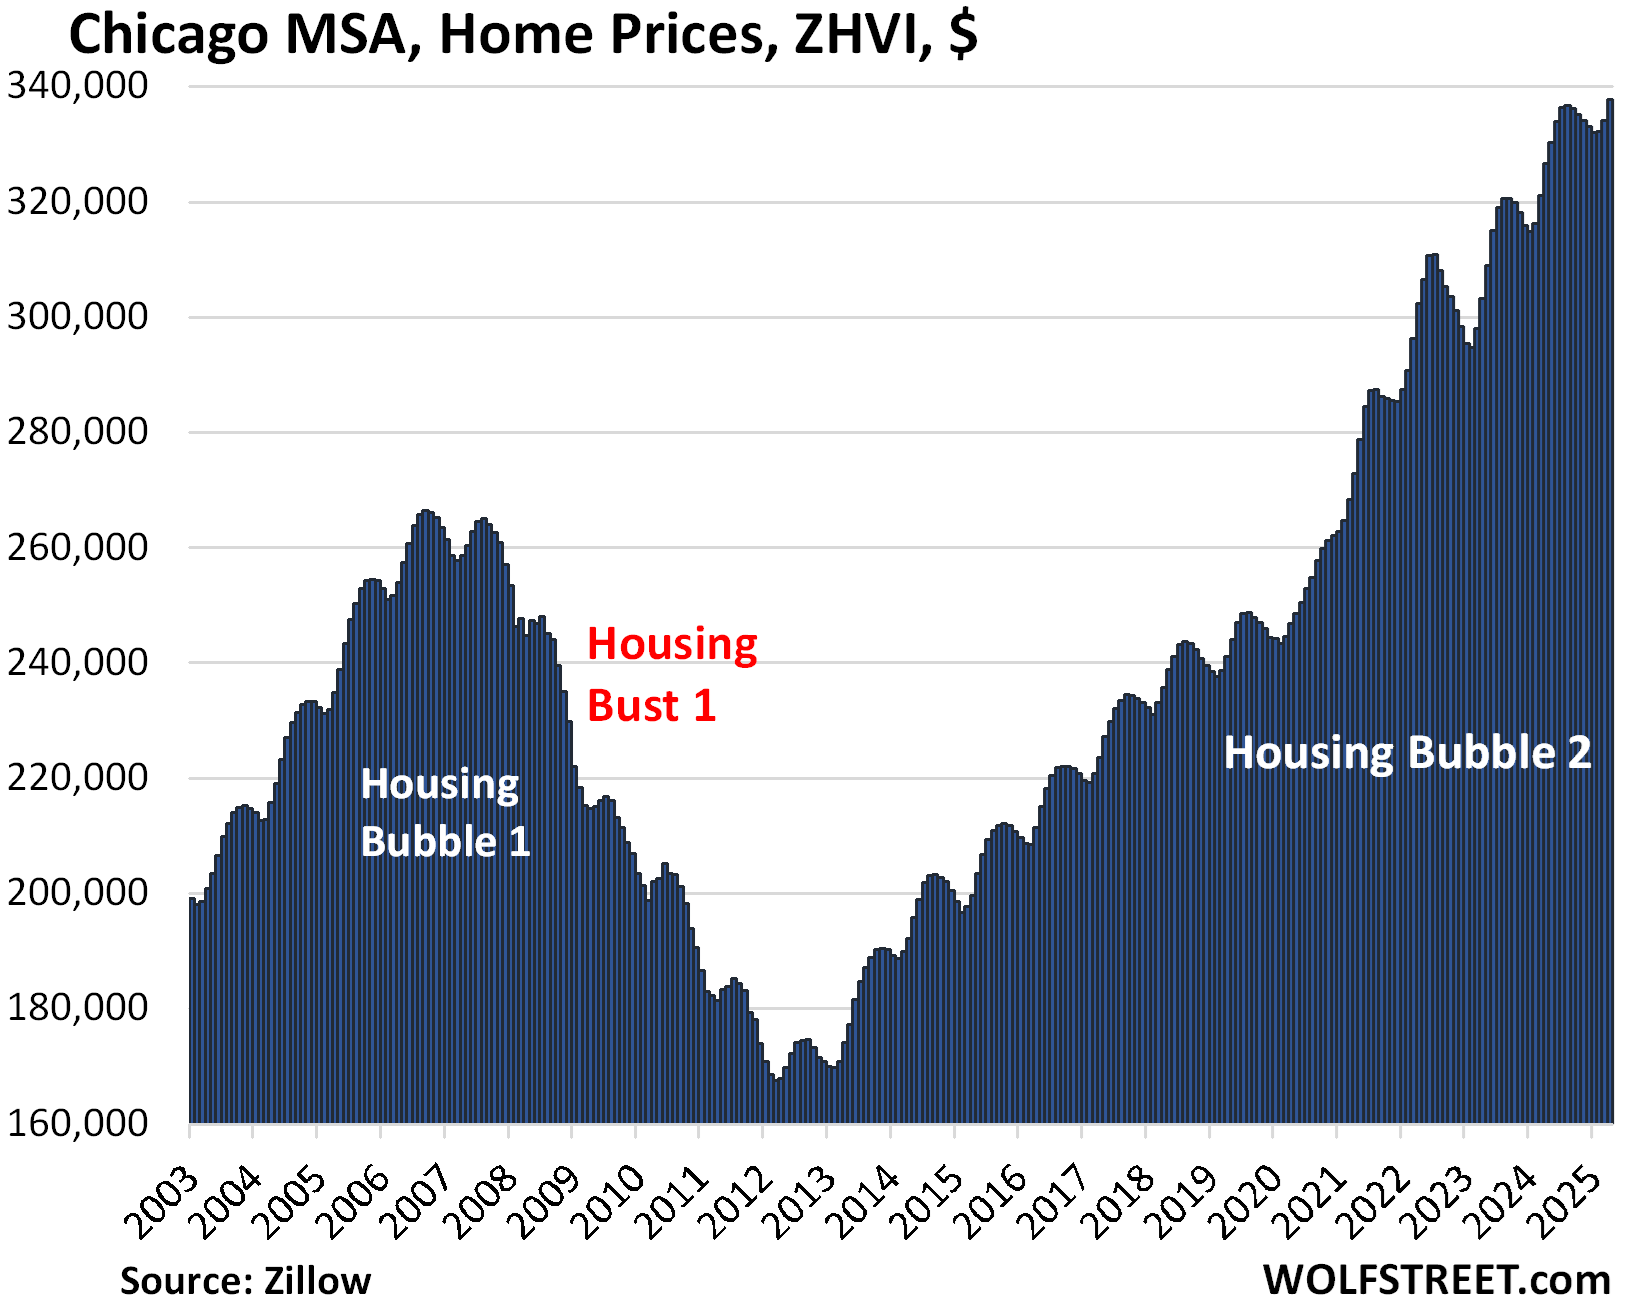
| Chicago MSA, Home Prices | ||
| MoM | YoY | Since 2000 |
| 1.1% | 3.4% | 115% |
The YoY gain declined from +4.1% in March and +5.1% in February.
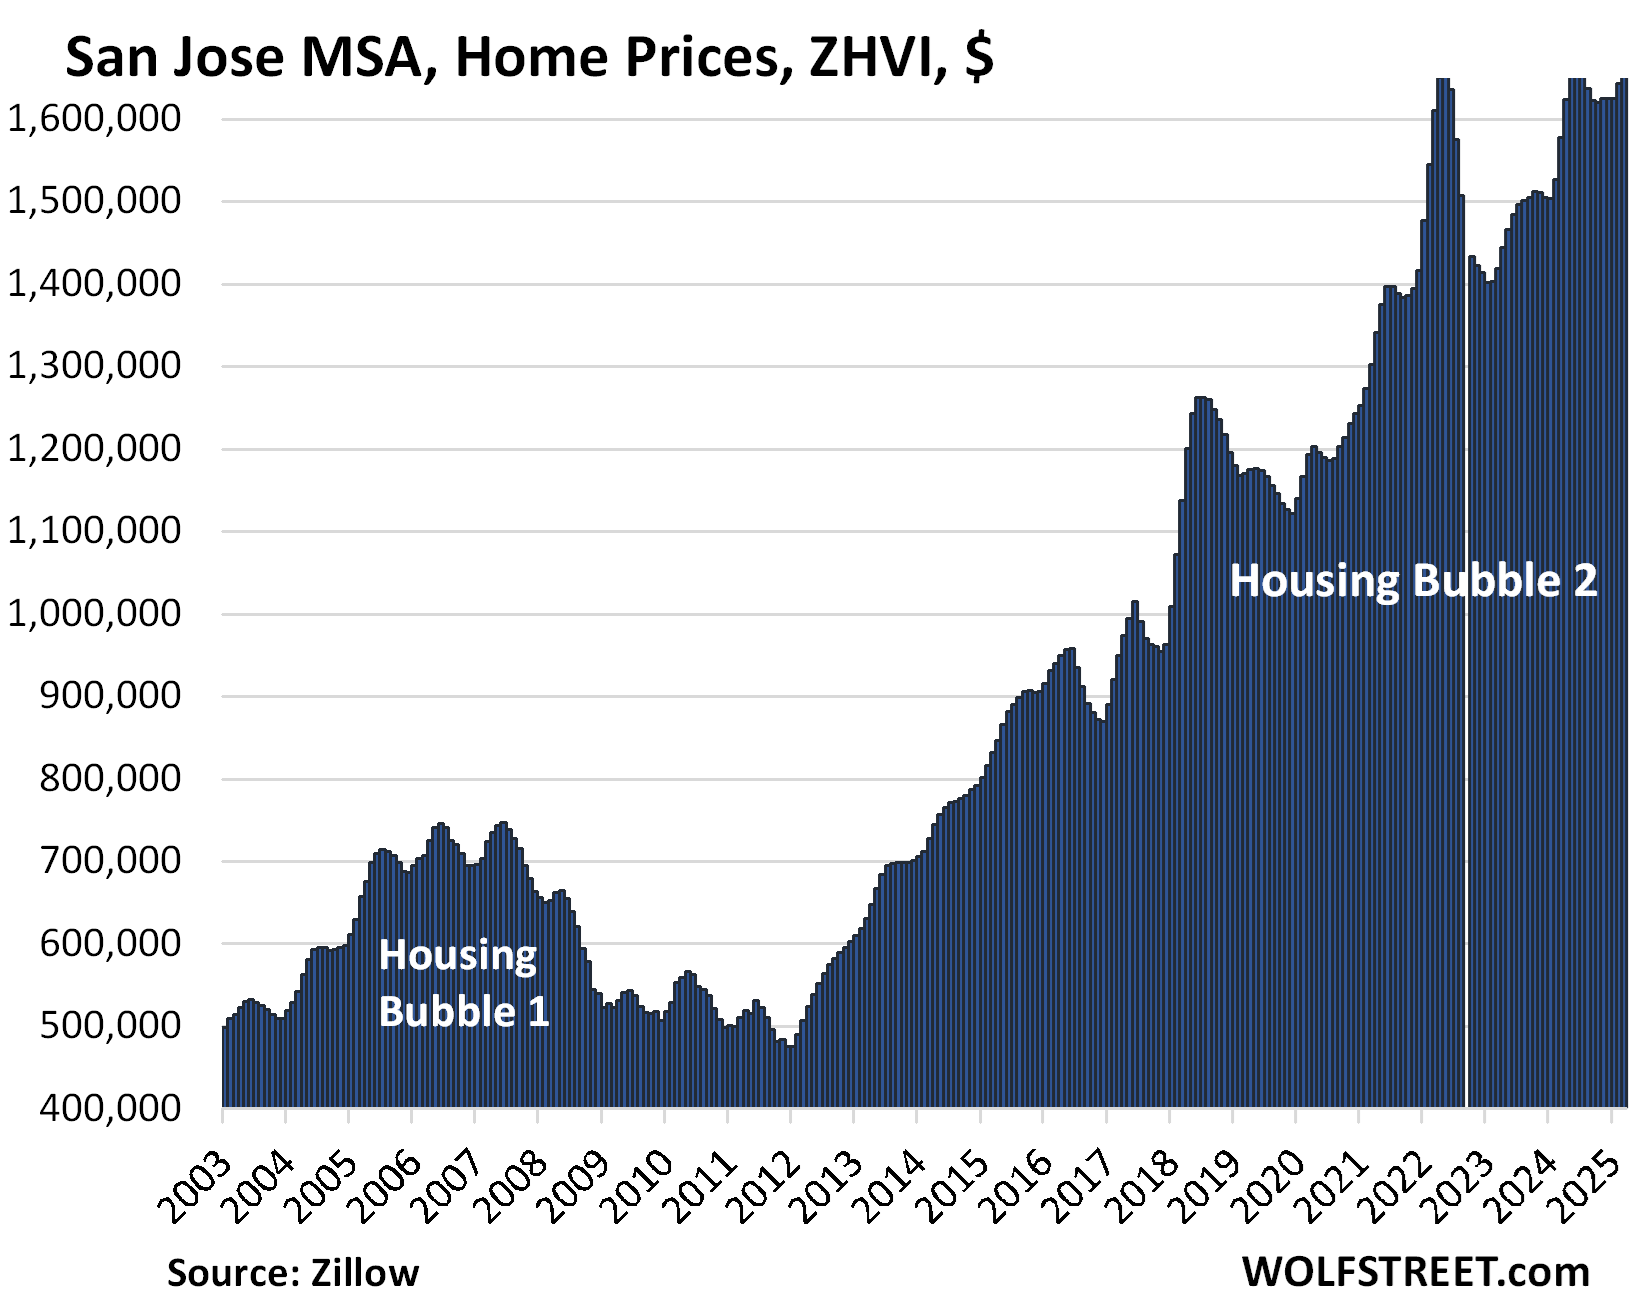
| San Jose MSA, Home Prices | |||
| MoM | YoY | Since 2000 | |
| 0.9% | 3.4% | 352% | |
Reached a new all-time high, squeaking past its previous all-time high in May 2022.
The YoY gain declined from 5.5% in March and +7.6% in February.
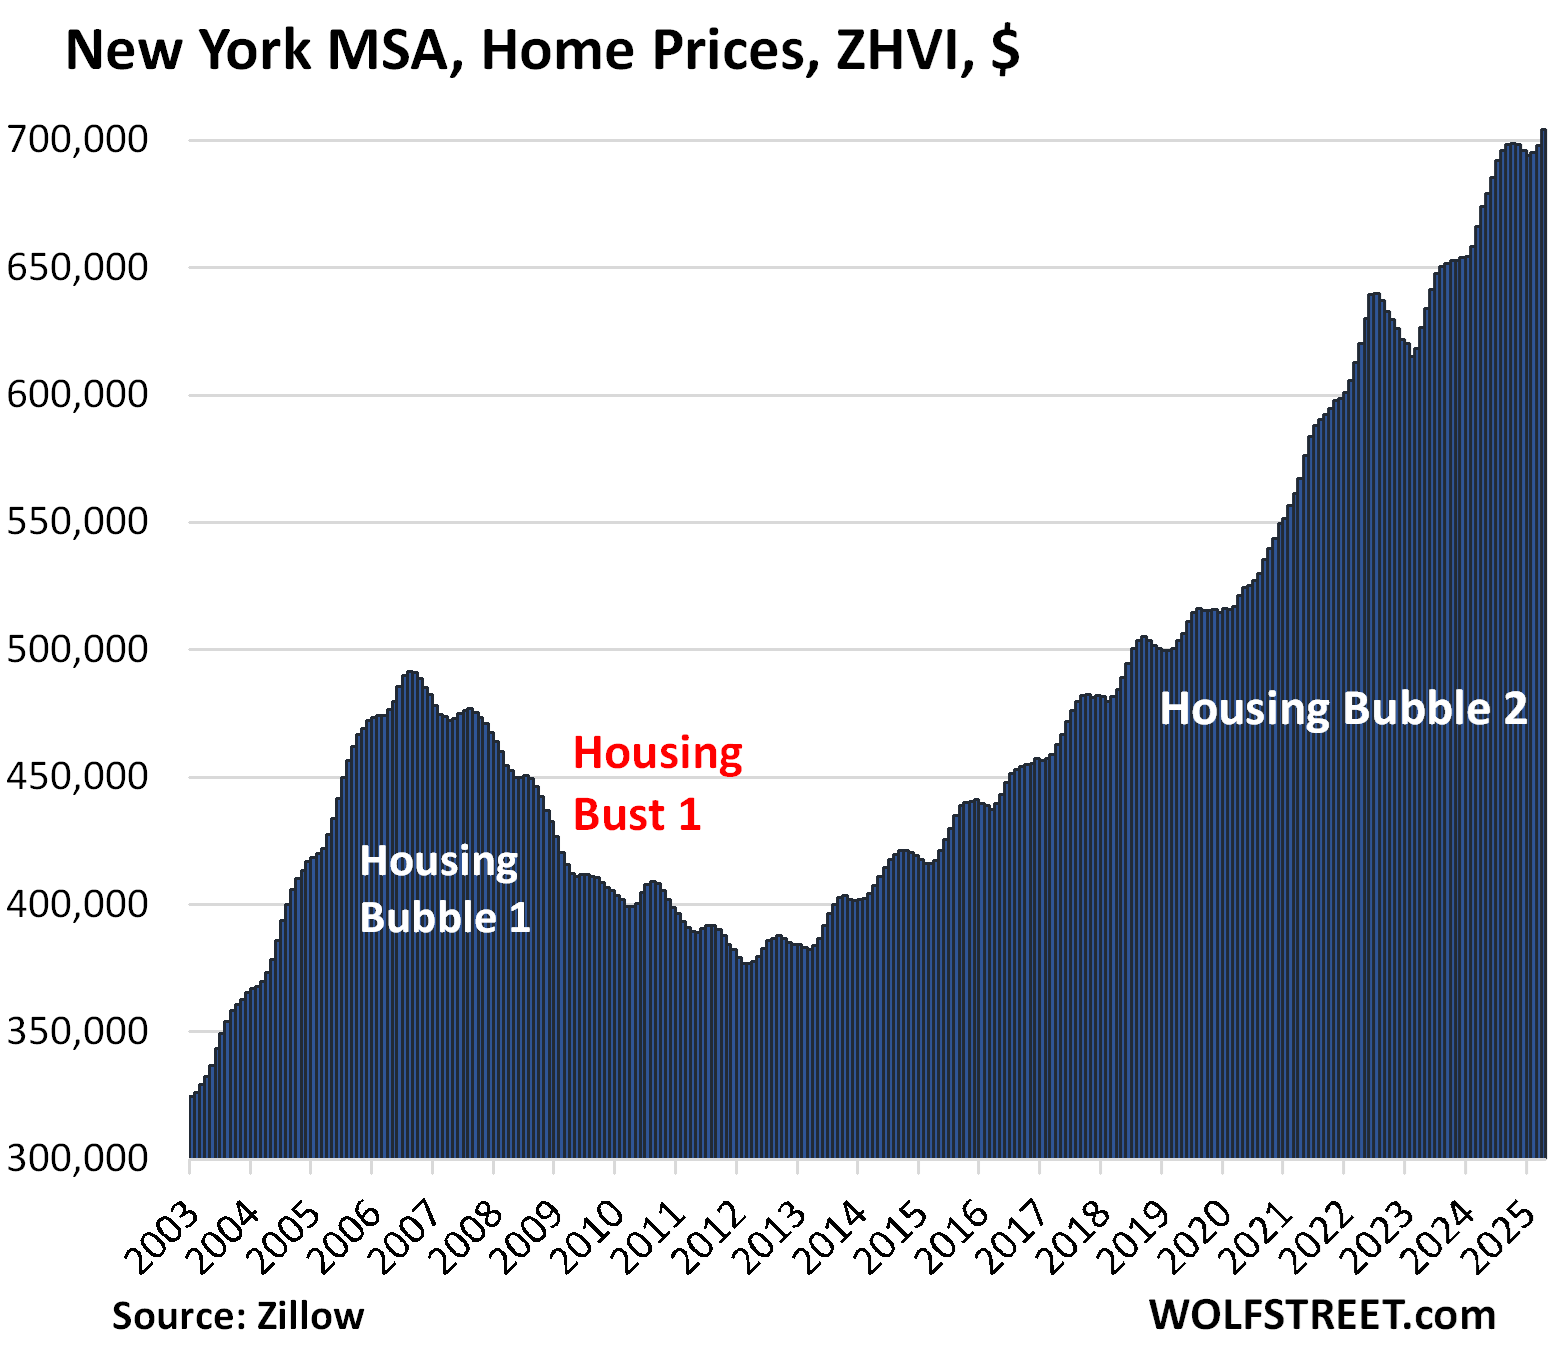
| New York MSA, Home Prices | ||
| MoM | YoY | Since 2000 |
| 0.9% | 4.4% | 214% |
The YoY gain declined from +4.8% in March and +5.6% in February.
Enjoy reading WOLF STREET and want to support it? You can donate. I appreciate it immensely. Click on the mug to find out how:

![]()
The post The Most Splendid Housing Bubbles in America, April 2025: The Price Drops & Gains in 33 of the Largest Housing Markets appeared first on Energy News Beat.
“}]]
Energy News Beat