[[{“value”:”
Bring on the new houses! Prices drop amid homebuilders’ efforts to sell the inventory.
By Wolf Richter for WOLF STREET.
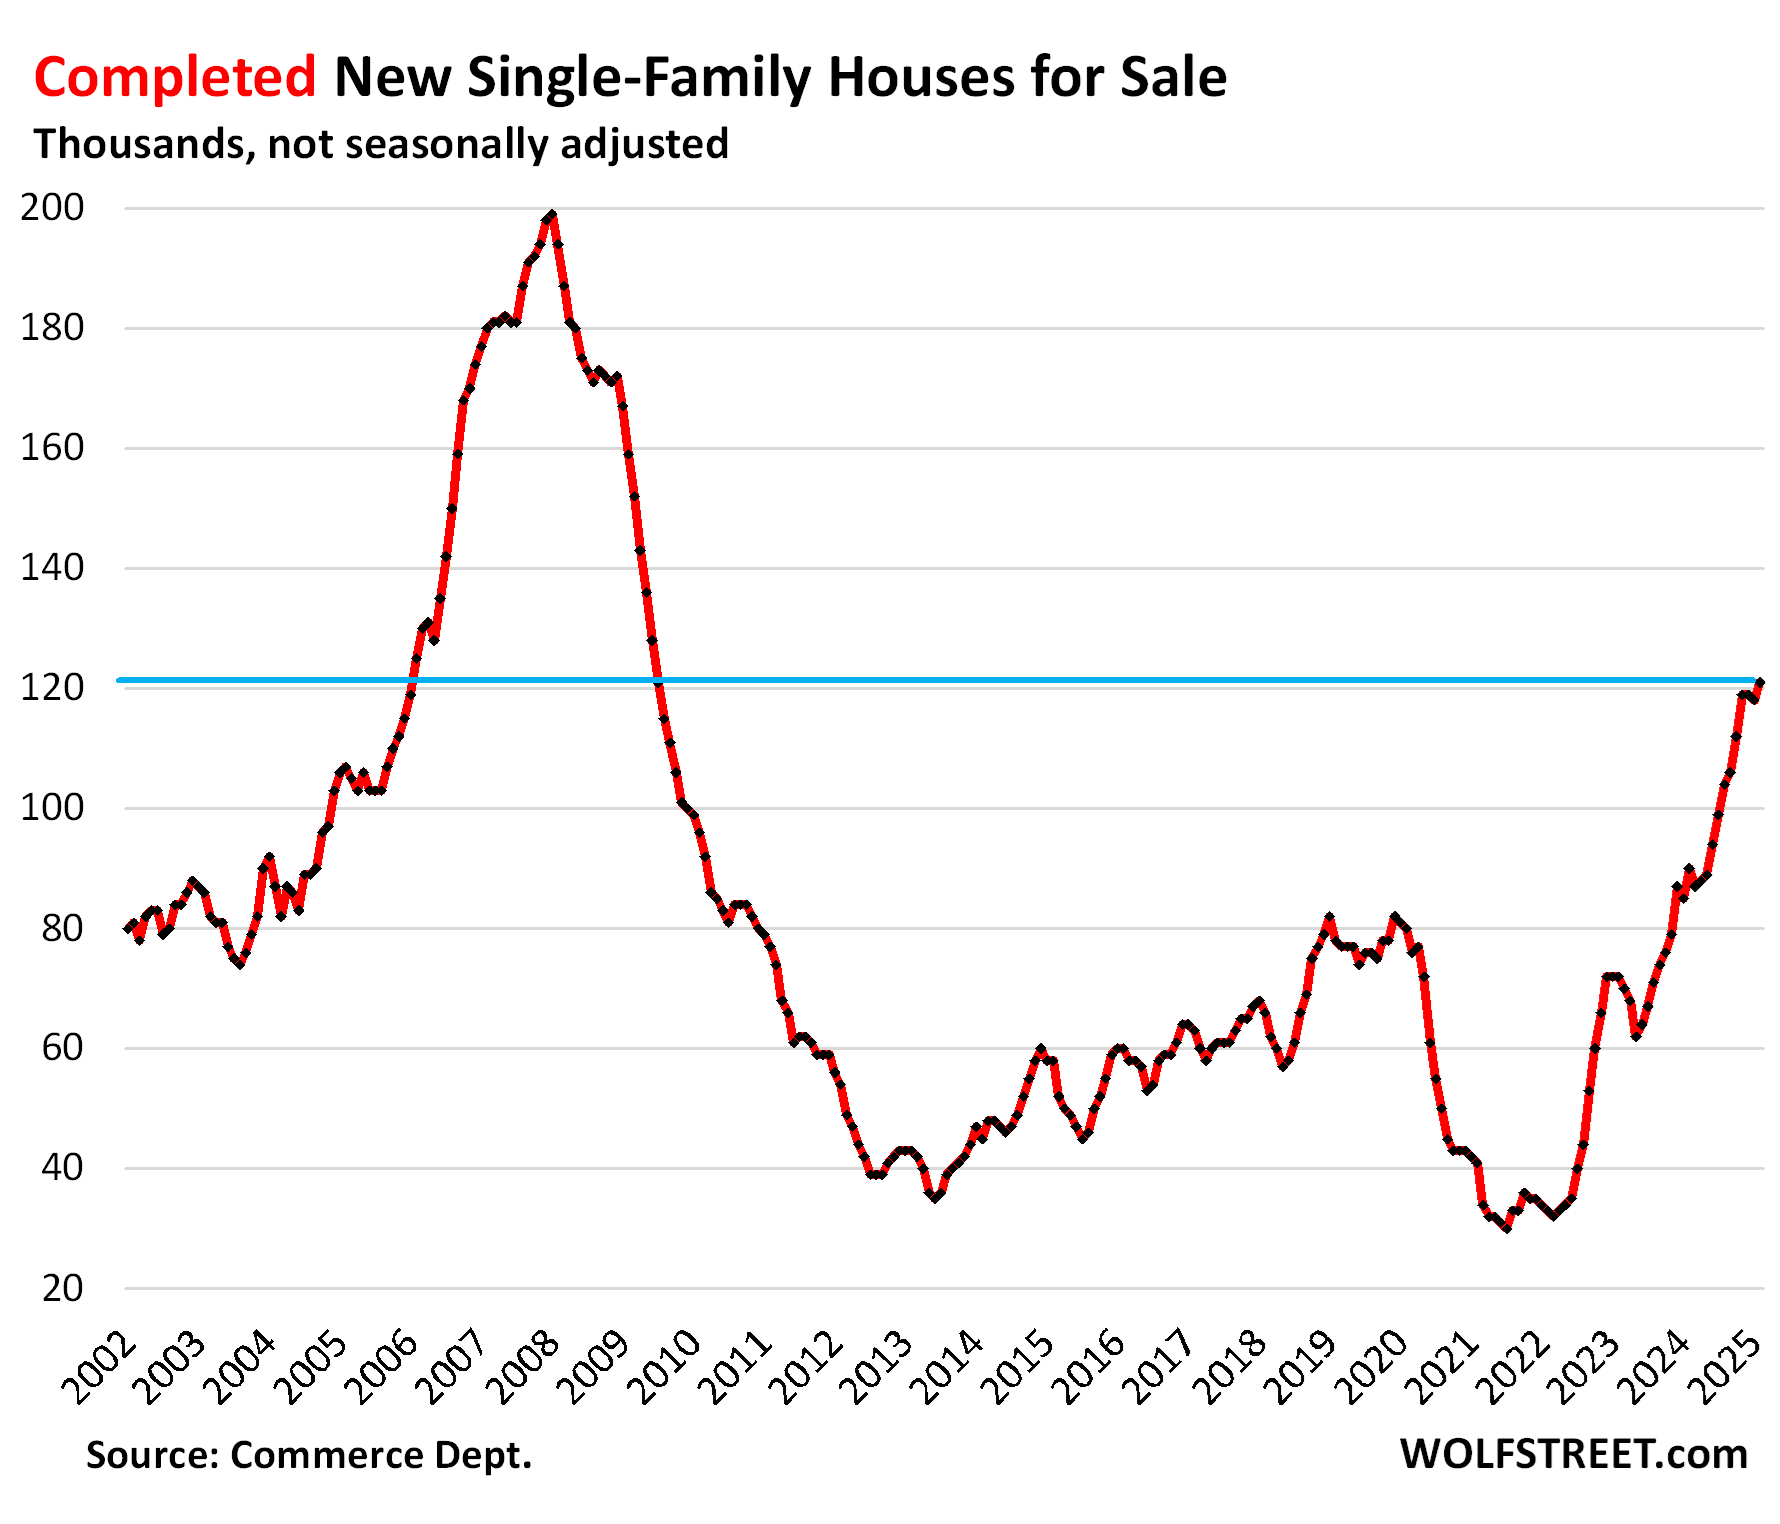
Inventories of completed new single-family houses for sale in February jumped by 34% year-over-year, and by 55% from February 2019, to 121,000 houses, the highest since July 2009 during the Housing Bust, and roughly where they’d been on the way up in February 2006, according to data from the Census Bureau today.
These are “spec houses” that were built without buyers lined up. Homebuilders are motivated to sell this inventory of spec houses quickly because they’ve sunk a lot of capital into them.
From the buyers’ point of view, this is a good thing: Bring on the new supply of essentially move-in-ready houses that builders really need to sell – more choices, lower prices, and bigger incentives.
For the overall housing market, this is also a good thing. It needs this surge of new supply. It’s competition for homeowners selling or thinking about selling their homes, including their vacant homes they’d moved out of years ago but didn’t put on the market to ride up the price spike all the way.
But the publicly traded homebuilders have been singing the blues, and their shares have careened lower from their highs in September, for example, DR Horton [DHI] -33%, Lennar [LEN] -33%, KB Home [KBH] -34%.
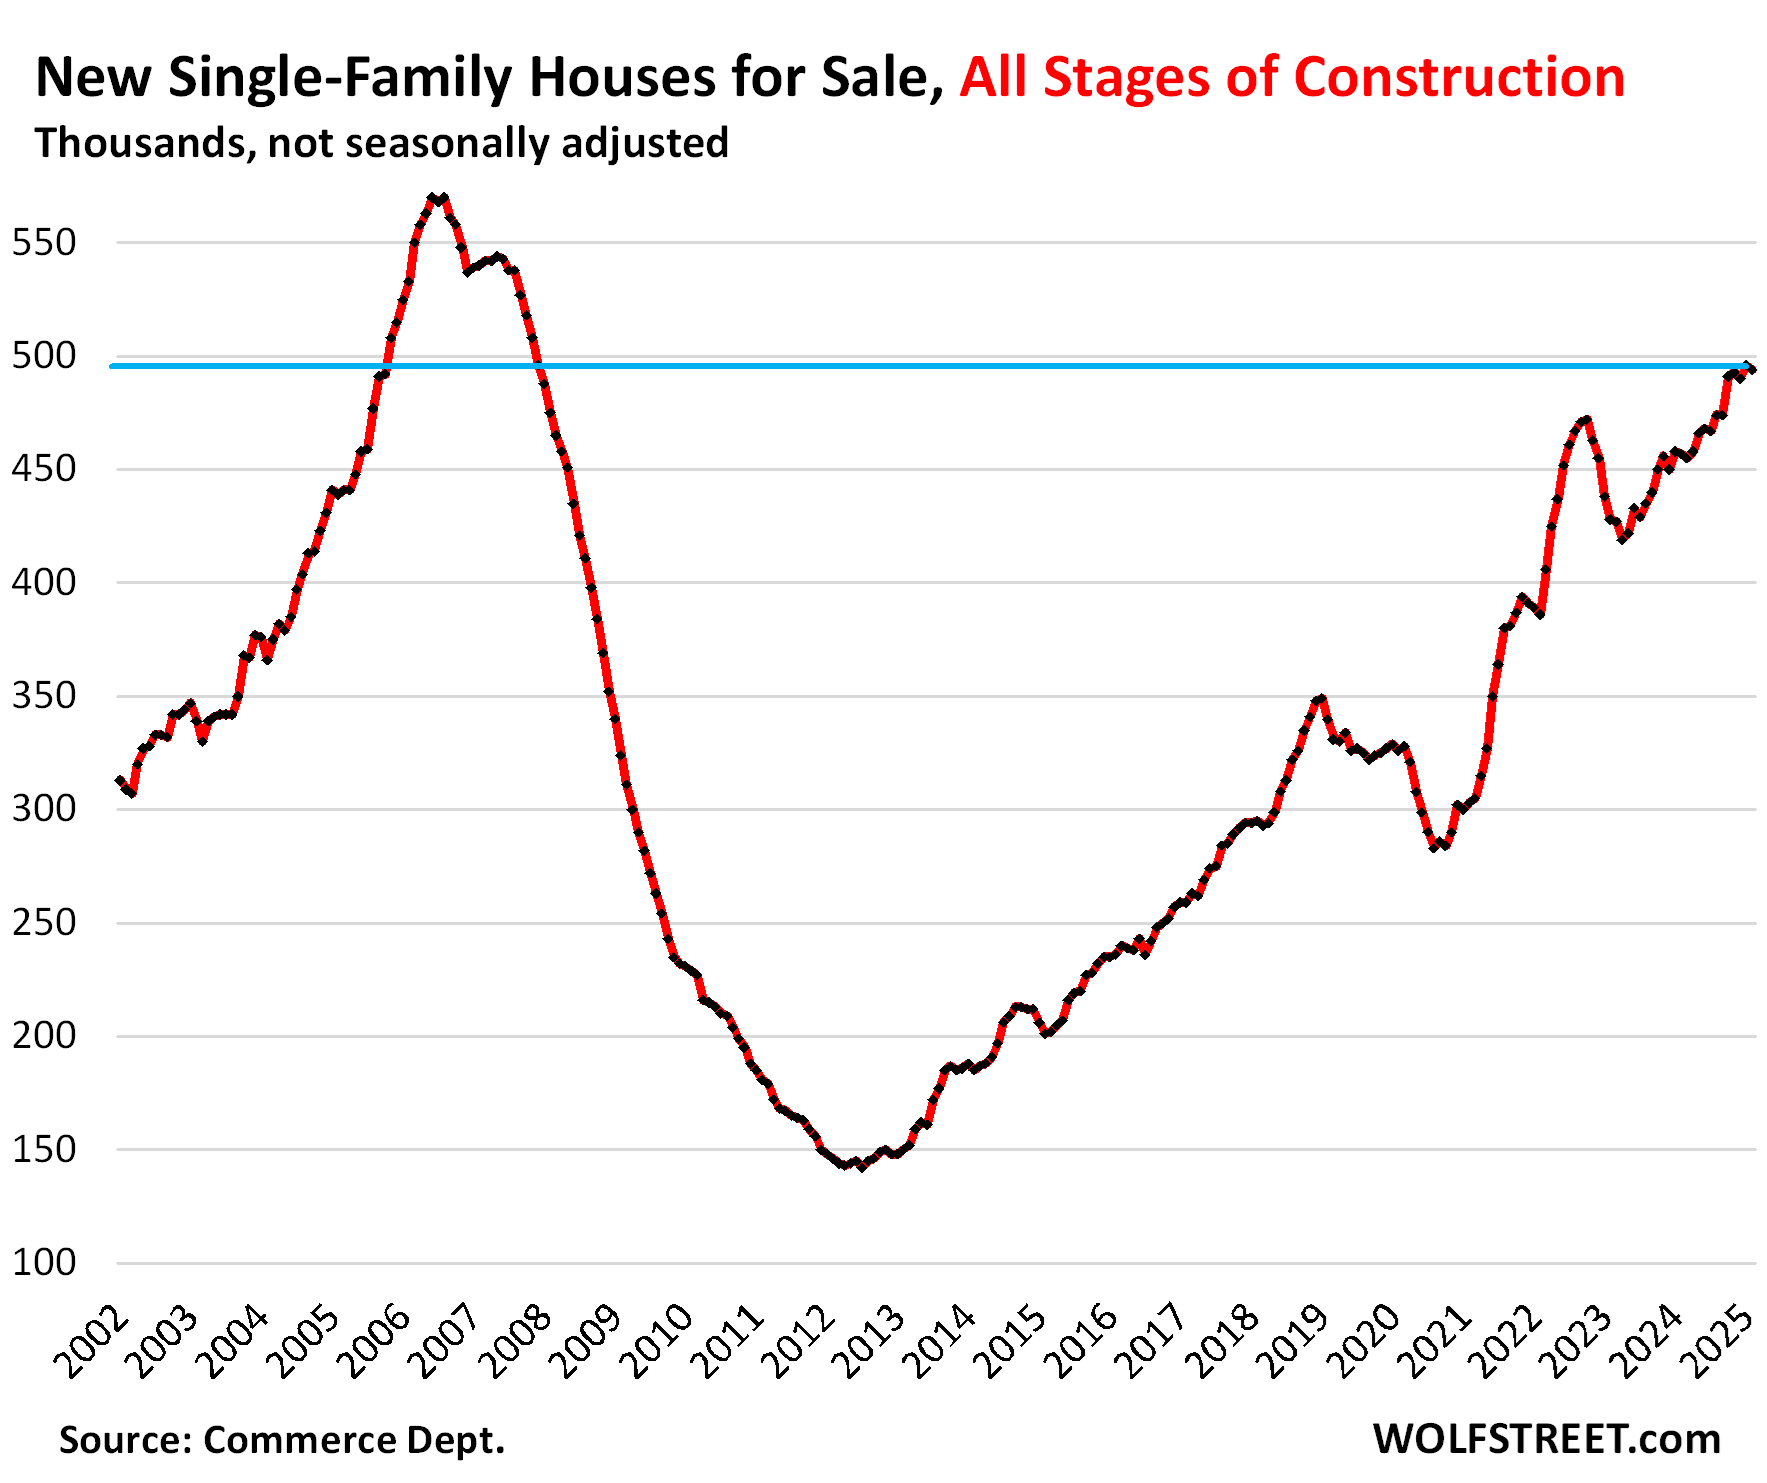
Inventories of single-family houses for sale at all stages of construction in February was essentially unchanged at 494,000 houses, up by 8.1% from the bloated levels a year ago, and up by 45% from February 2019.
Inventories of the past five months have been at the highest level since December 2007, during the Housing Bust.
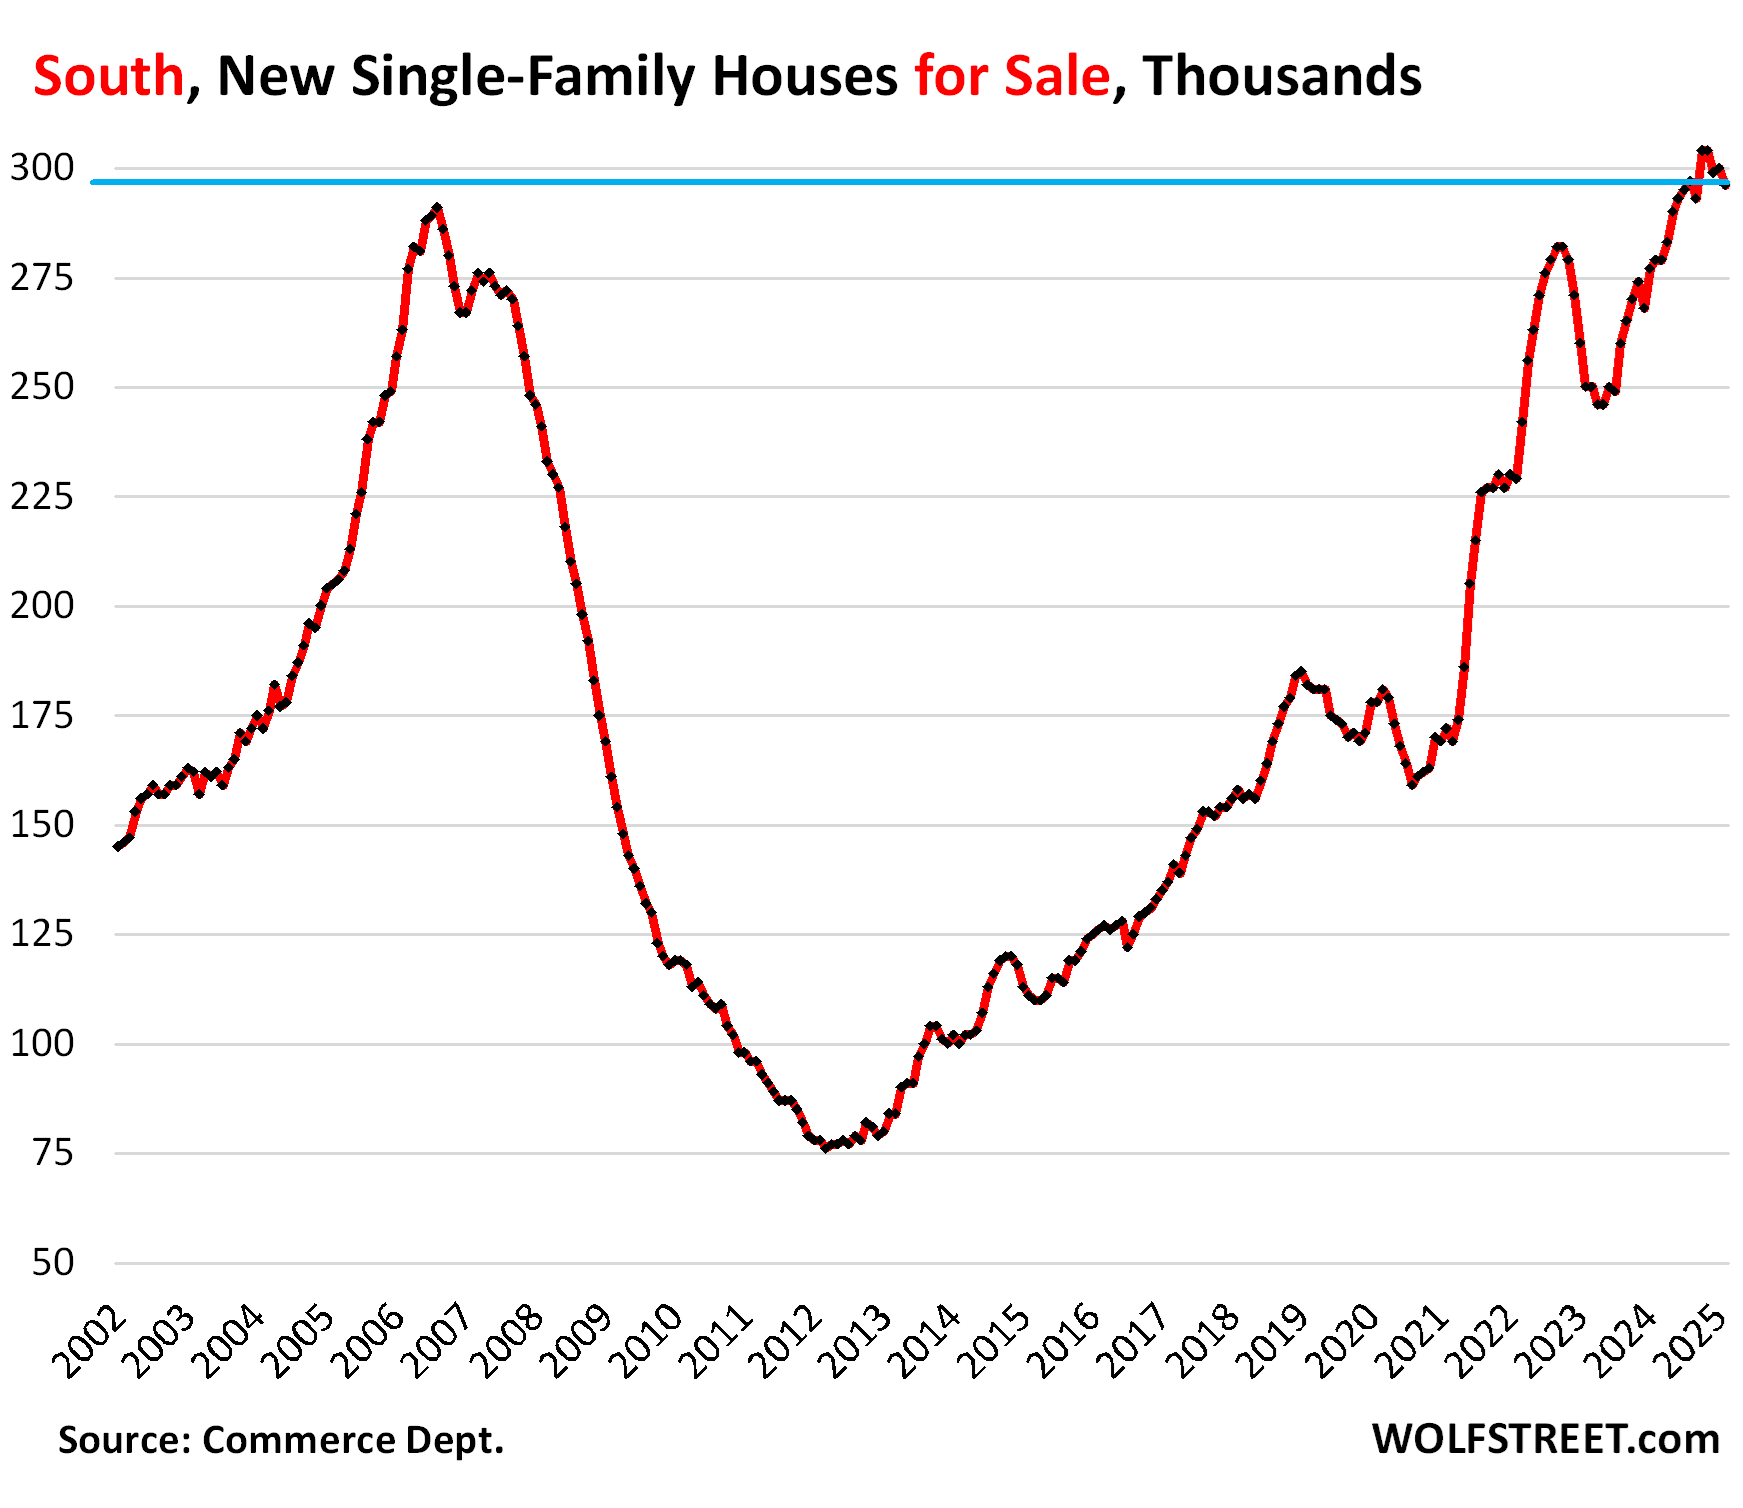
South: Inventory at all-time highs for months.
In the South, inventories of new houses for sale at all stages of construction have been at record highs for months – at 290,000 to 304,000 houses for sale – having surpassed the highs of the Housing Bust for the first time ever in May.
In February, inventory for sale of 296,000 houses was up by 6% from the already bloated levels a year ago, and by 72% from February 2019!
The housing market of the South, a huge Census region, is dominated by Texas and Florida (see map of the four Census regions at the top of the comments). It’s by far the largest market for new houses in the US: In February, it accounted for 60% of new houses for sale in the US, and for 66% of US sales of new houses.
Massive incentives and lower prices by homebuilders have stimulated sales. In February, sales were up by 18% year-over-year.
And supply dipped to 7.6 months, but this was still 38% higher than in 2019.
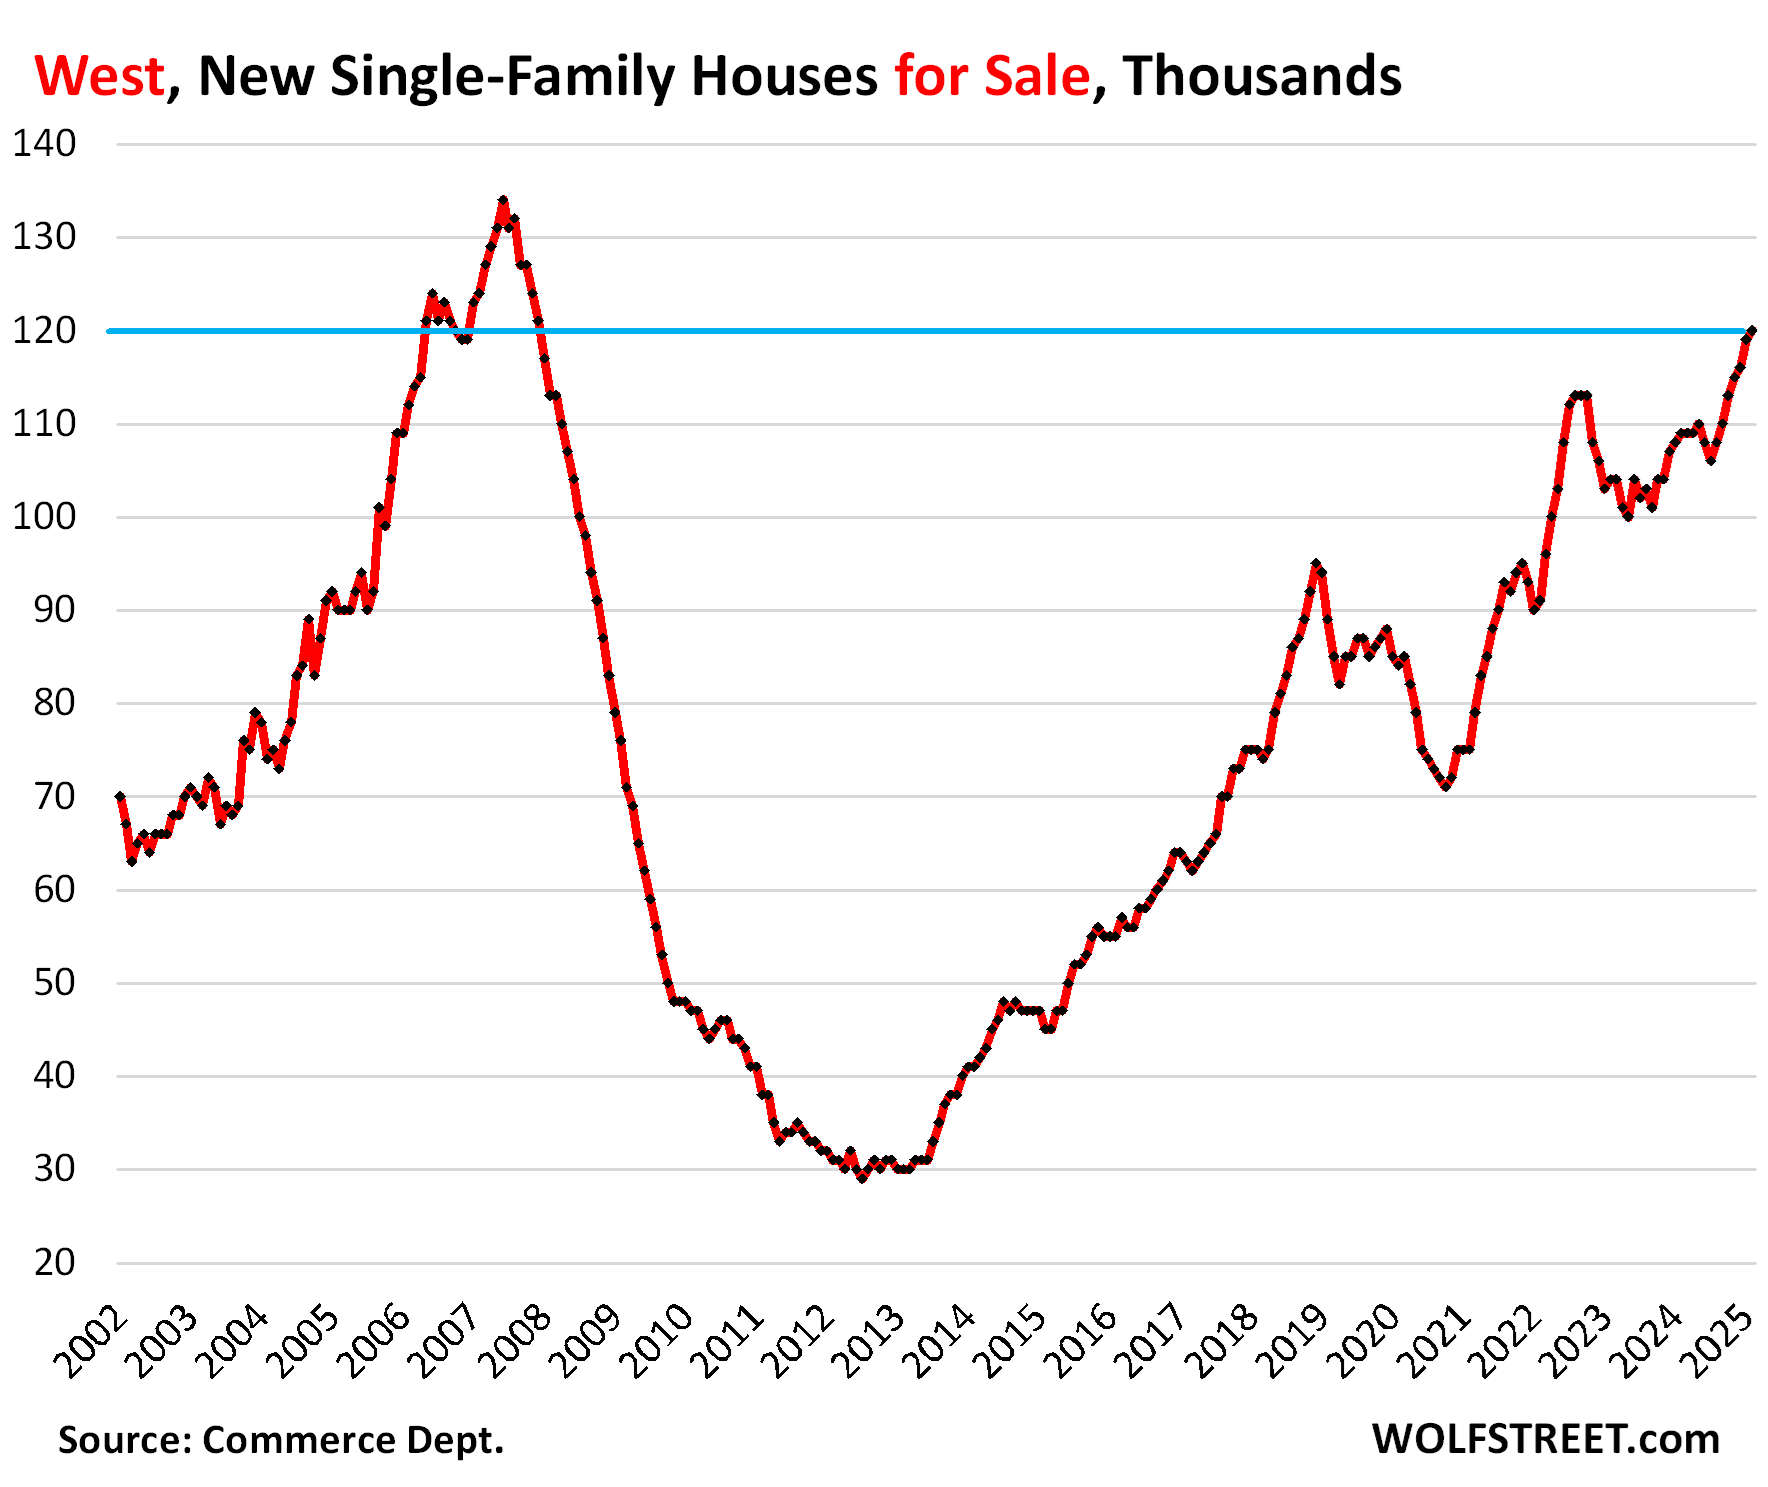
West: Inventory surges to highest since December 2007.
Inventories of new houses for sale at all stages of construction rose to 120,000 houses in the West, the highest level since December 2007, and up by 10% year-over-year, and up by 60% from 2019 (see map of Census Regions at the top of the comments below).
The market for new houses in the West, the second-largest in the US, accounted for 24% of the US inventory of new houses and for 20% of US sales of new houses.
But sales in the West fell by 14% year-over-year and by 25% from February 2019.
Supply in February rose to 10 months, the highest of any region, up by 28% from a year ago, and up by 80% from 2019! Homebuilders need to sharpen their pencils to get this inventory moving:
The other two regions.
The South and West combined accounted for 84% of new house inventory and 86% of new house sales in the US. They move the needle.
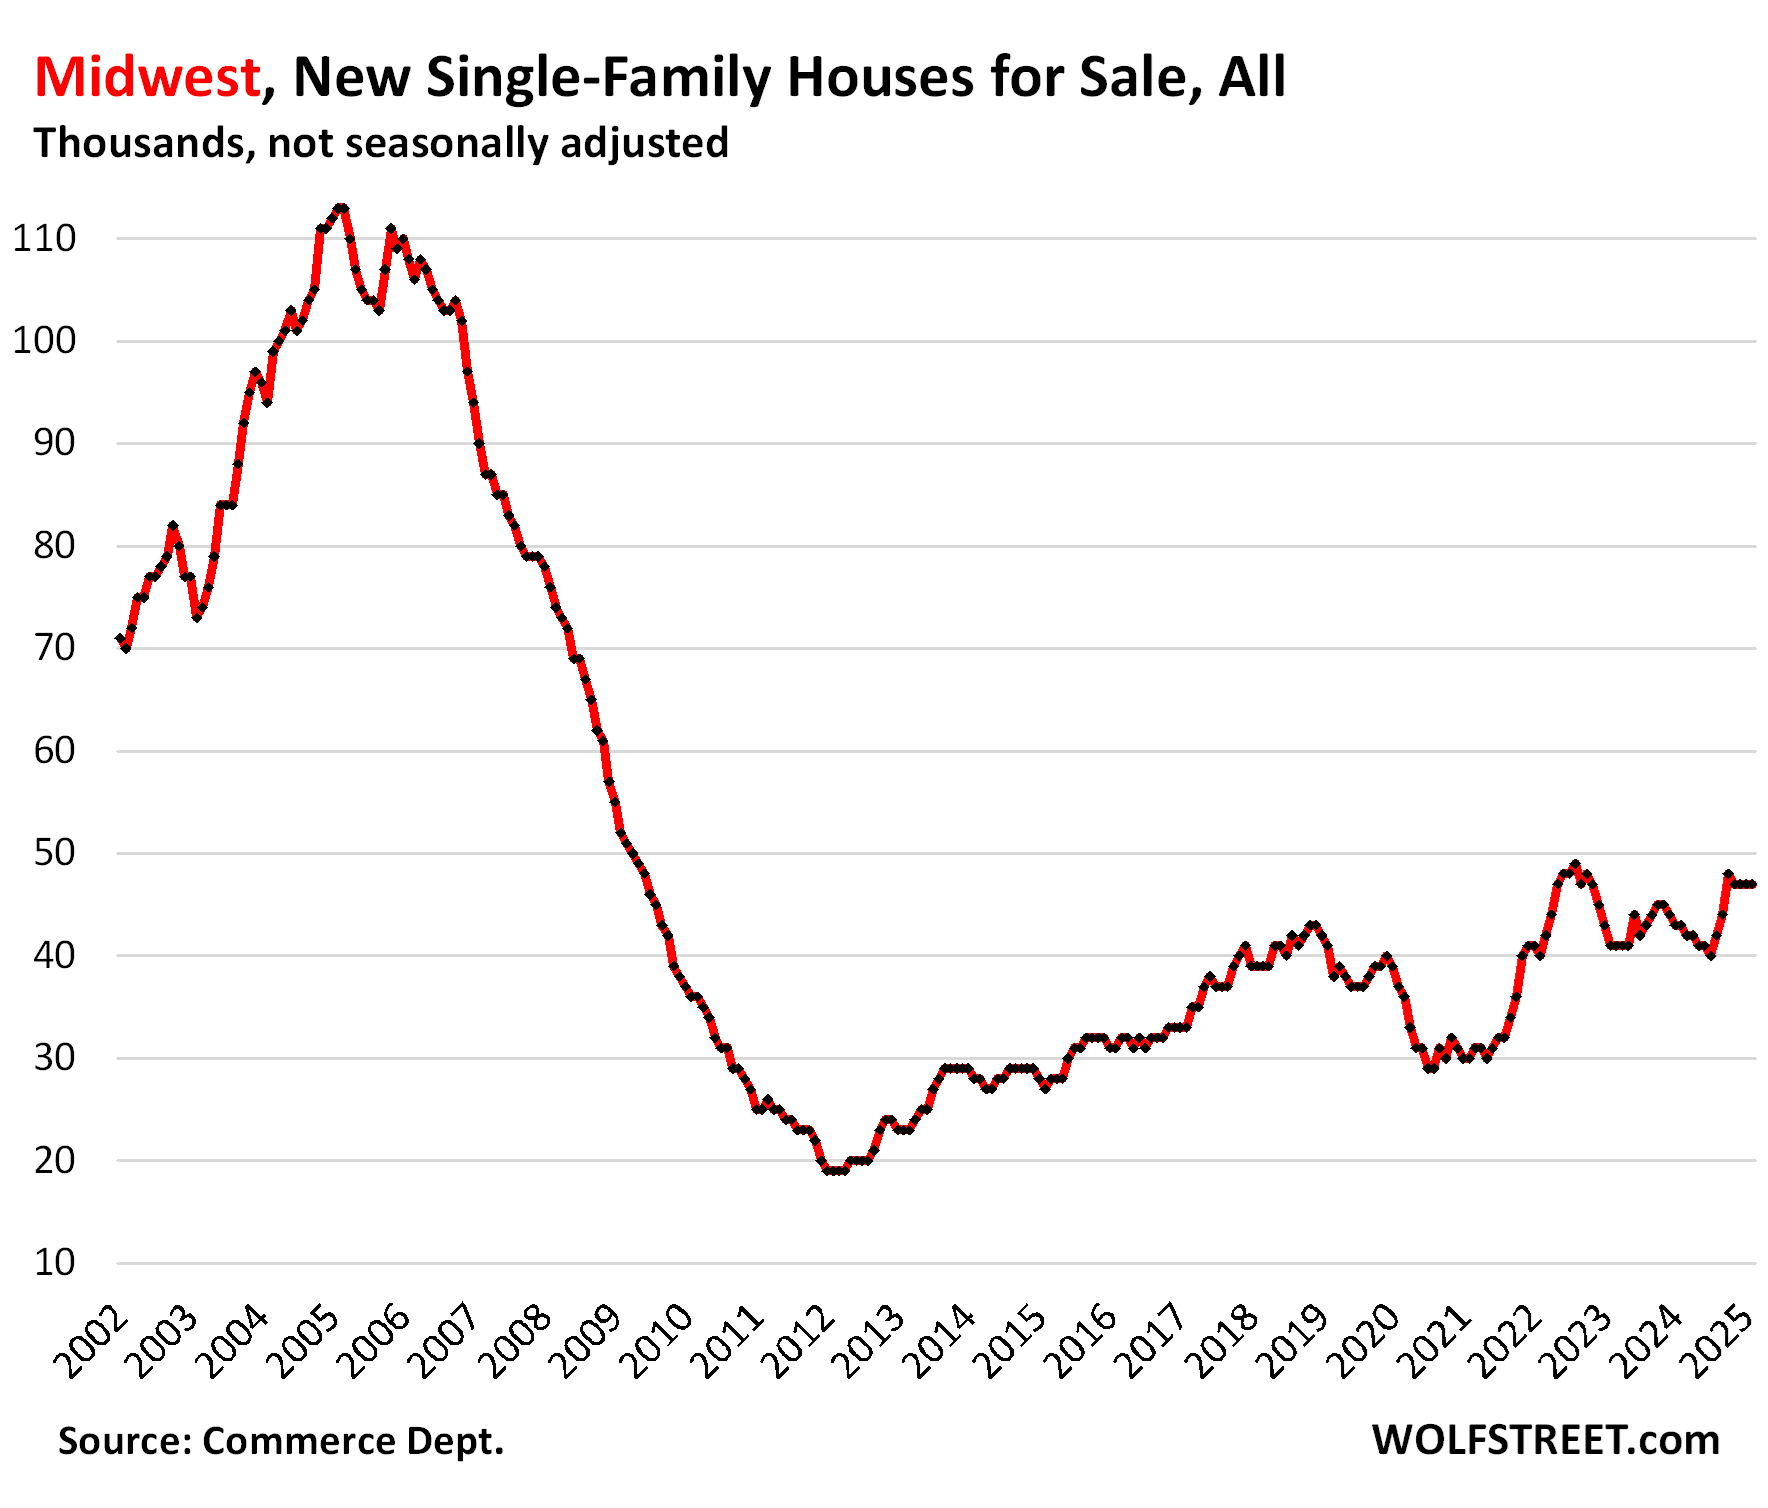
The Midwest and the Northeast carve up amongst themselves the remaining 16% of the new-house inventory and 14% of new-house sales. Some of the big states in those regions have lost population over the years, the cities are already dense and huge, and big new developments are not a big priority.
Inventory in the Midwest remained for the fourth month in a row at 47,000 new houses for sale, up by 9.3% year-over-year and up by 15% from February 2019.
Sales at about 6,000 houses in February were down from a year ago, but roughly the same as in 2019. Supply remained at about 8 months.
Caution with these small numbers of sales: Census rounds its sales estimates to the nearest 1,000: these “6,000” sales could mean anything between 5,501 and 6,499.
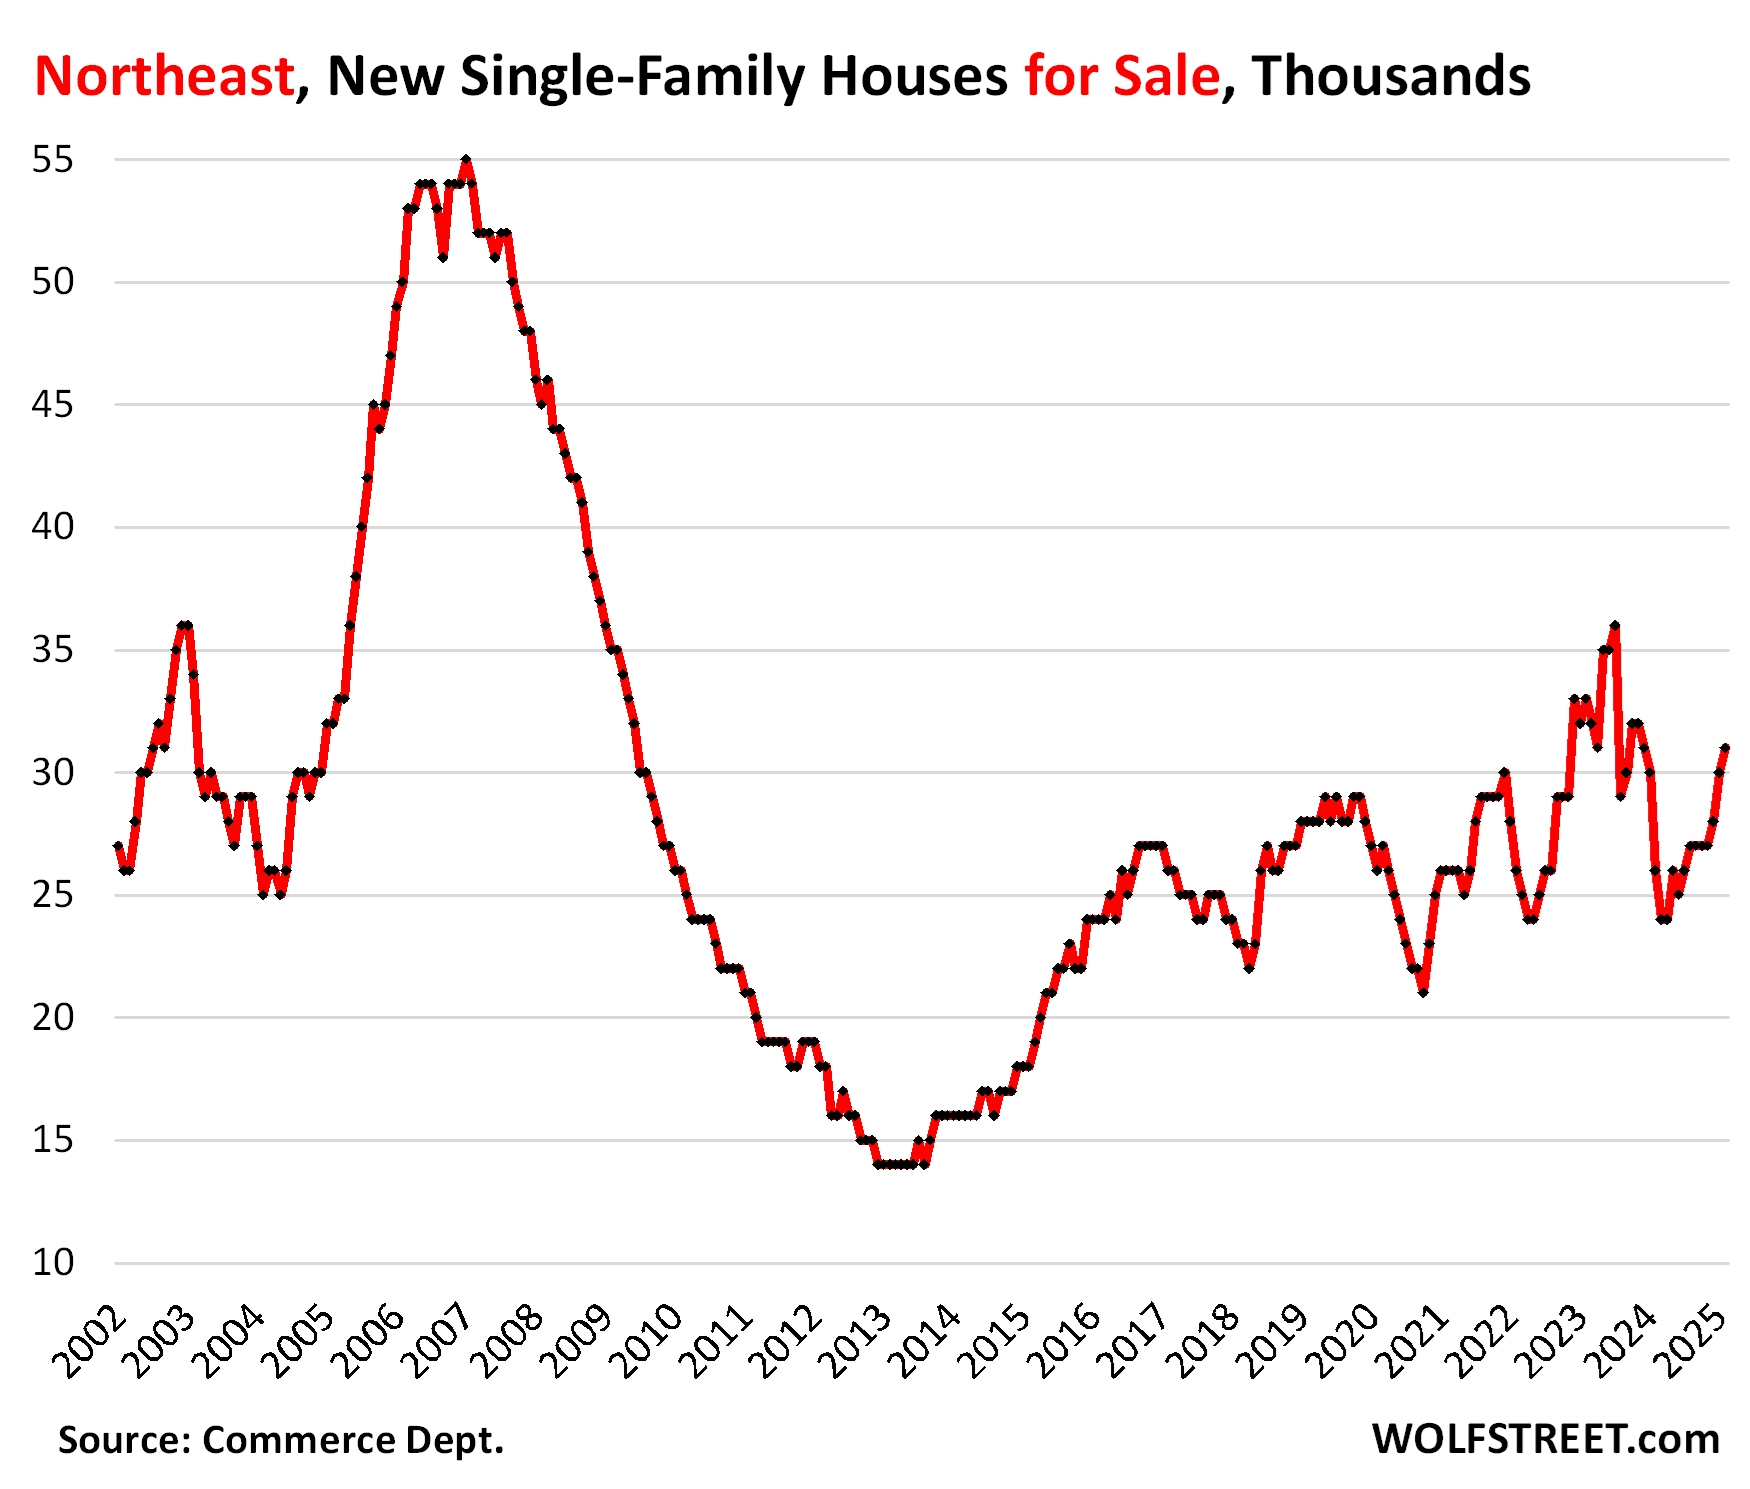
Inventory in the Northeast rose to 31,000 new houses for sale, up by 19% year-over-year and up by 11% from February 2019.
Sales of about 2,000 houses in February were down from a year ago, likely the bad weather. Supply remained at about 8 months.
Even greater caution: There are minuscule sales figures rounded to the nearest 1,000.
US sales dip YoY despite price cuts & incentives.
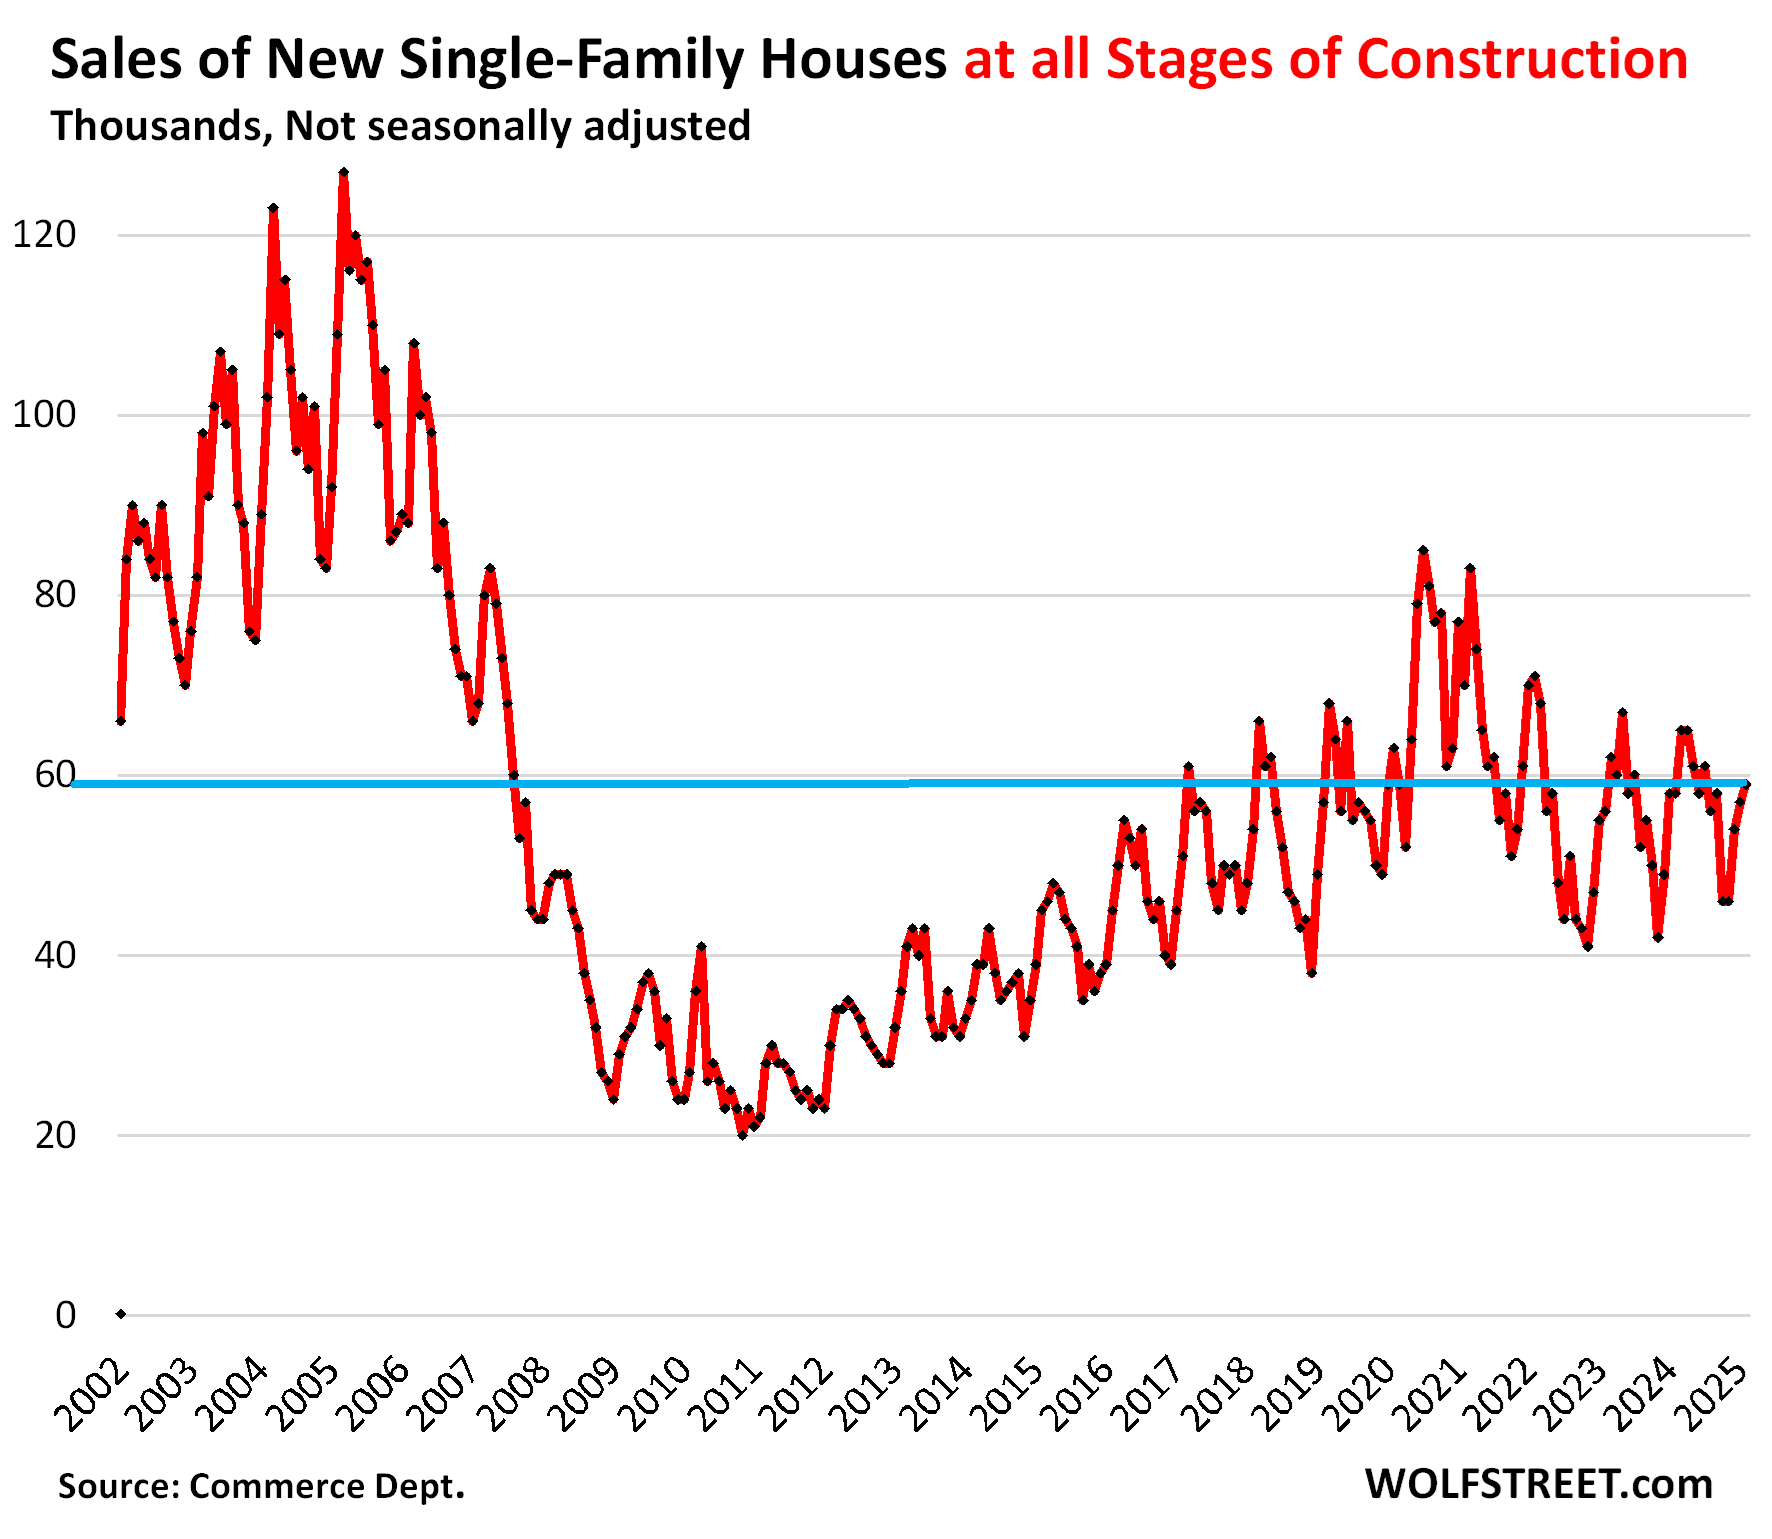
Sales of new houses at all stages of construction rose in February by 1.7% year-over-year, to 59,000 deals, not seasonally adjusted, driven by the sales increase in the South that more than made up for the drop in the West. Compared to February 2019, sales were still down by 6%.
These sales are based on contract sales, not on closed sales. Things can happen that prevent contracts from closing, such as not being able to get affordable insurance or financing falling through.
Homebuilders overall have been selling houses at a slower clip than they’ve been building them, which is why inventory levels of new houses for sale in the US overall have continued to surge.
Supply at 8.4 months was up by 6% from a year ago and by 40% from February 2019.
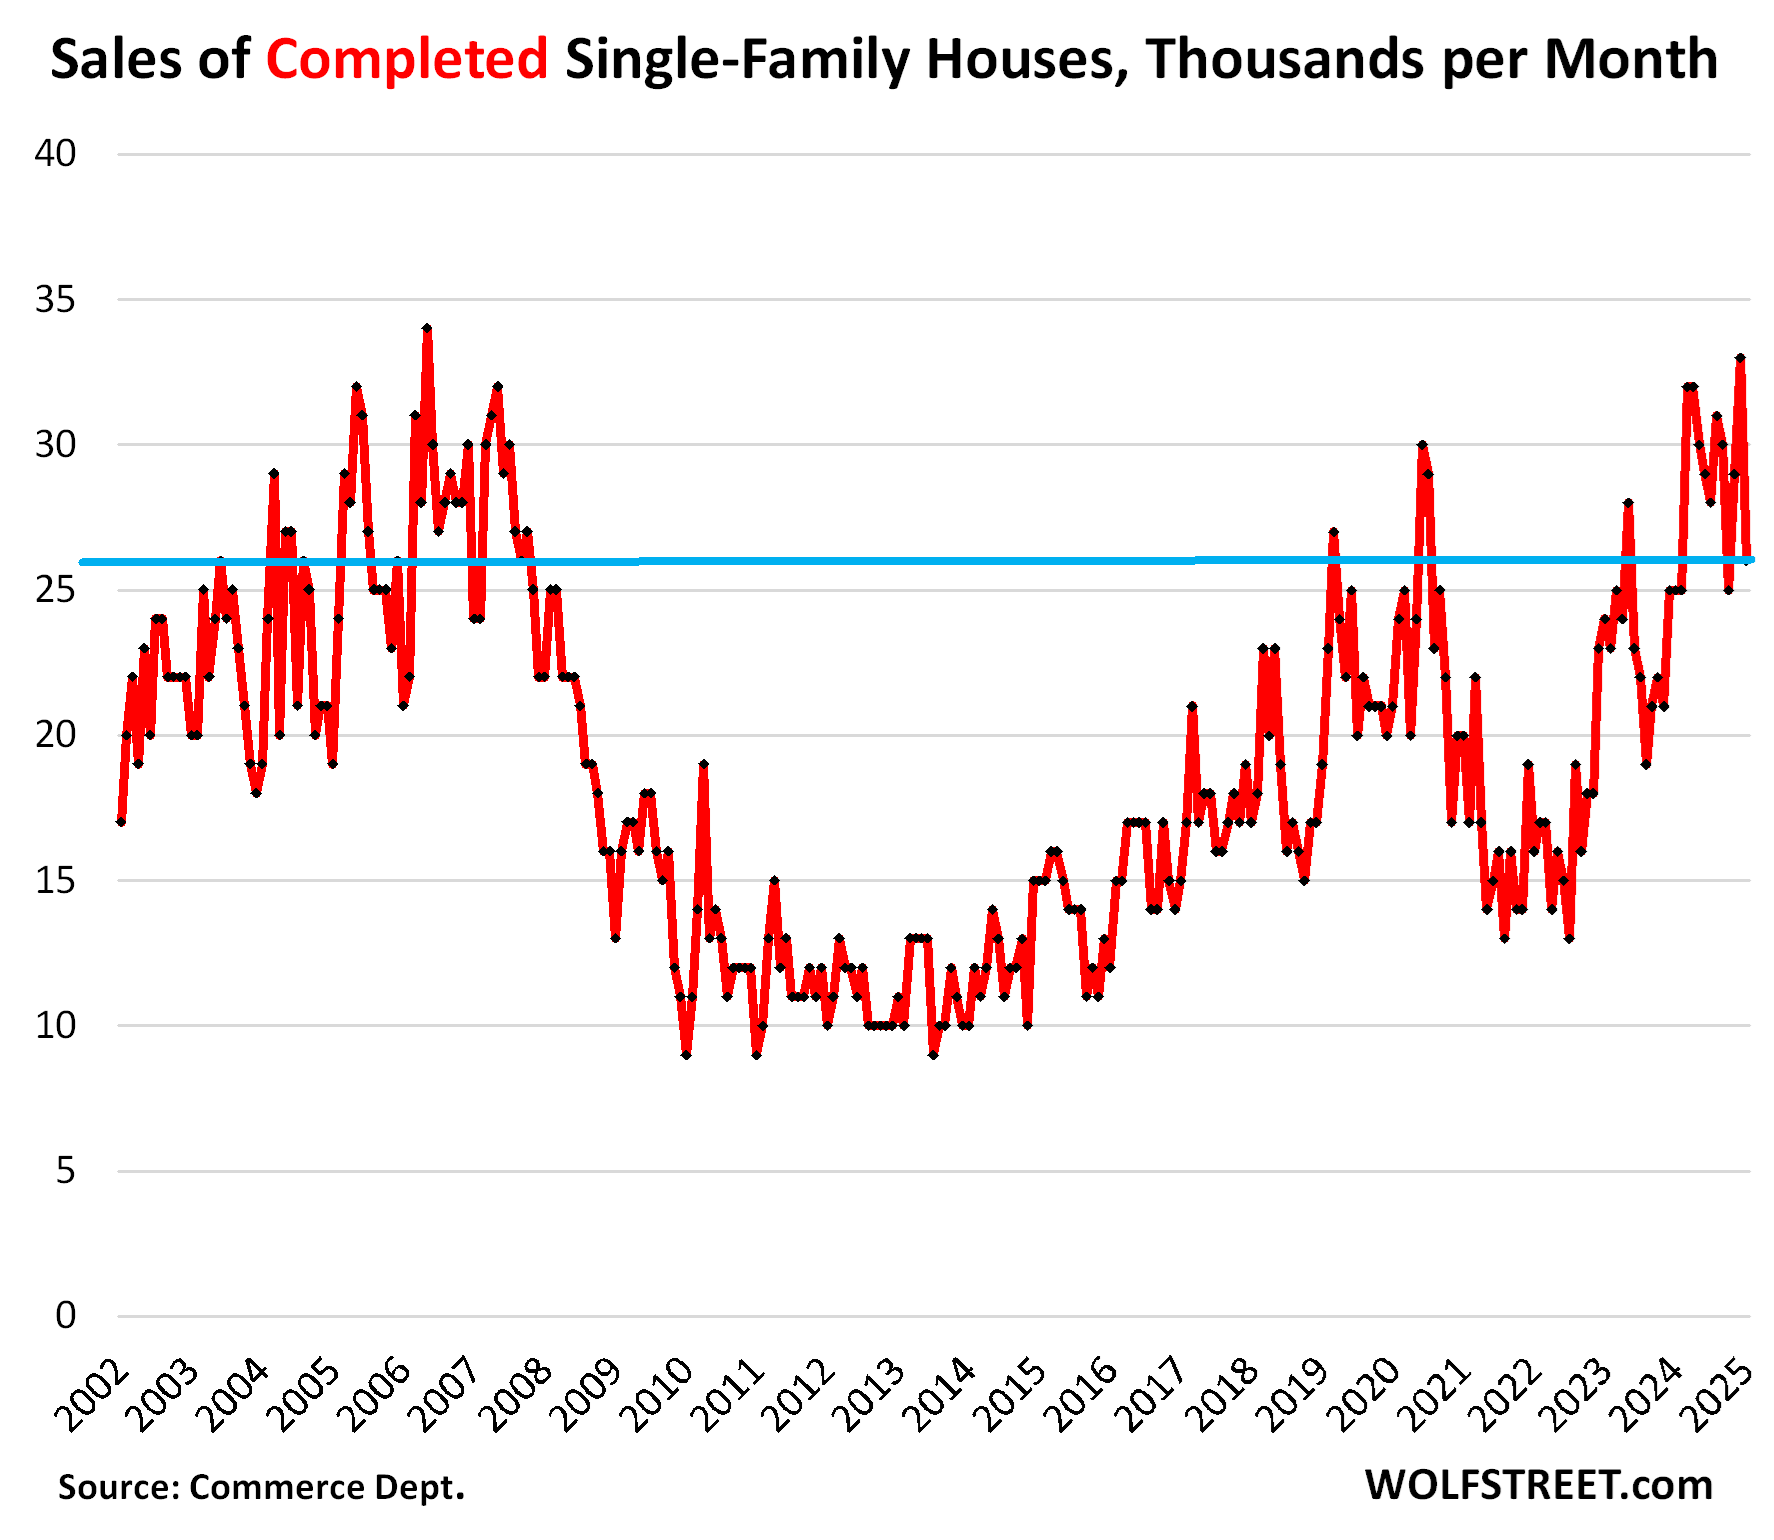
Thanks to the incentives, promos, lower prices, and mortgage-rate buydowns, sales of new houses have held up at decent levels – though they’re nothing to write home about – while sales of existing homes experienced the worst February since February 2009:
Sales of completed houses rose 16% year-over-year in February to 29,000 houses and were up by 26% from February 2019, as builders have given up profit margins – some of the biggest have given up 2 to 4 percentage points from the fat margins a few years ago – to aggressively sell what they built.
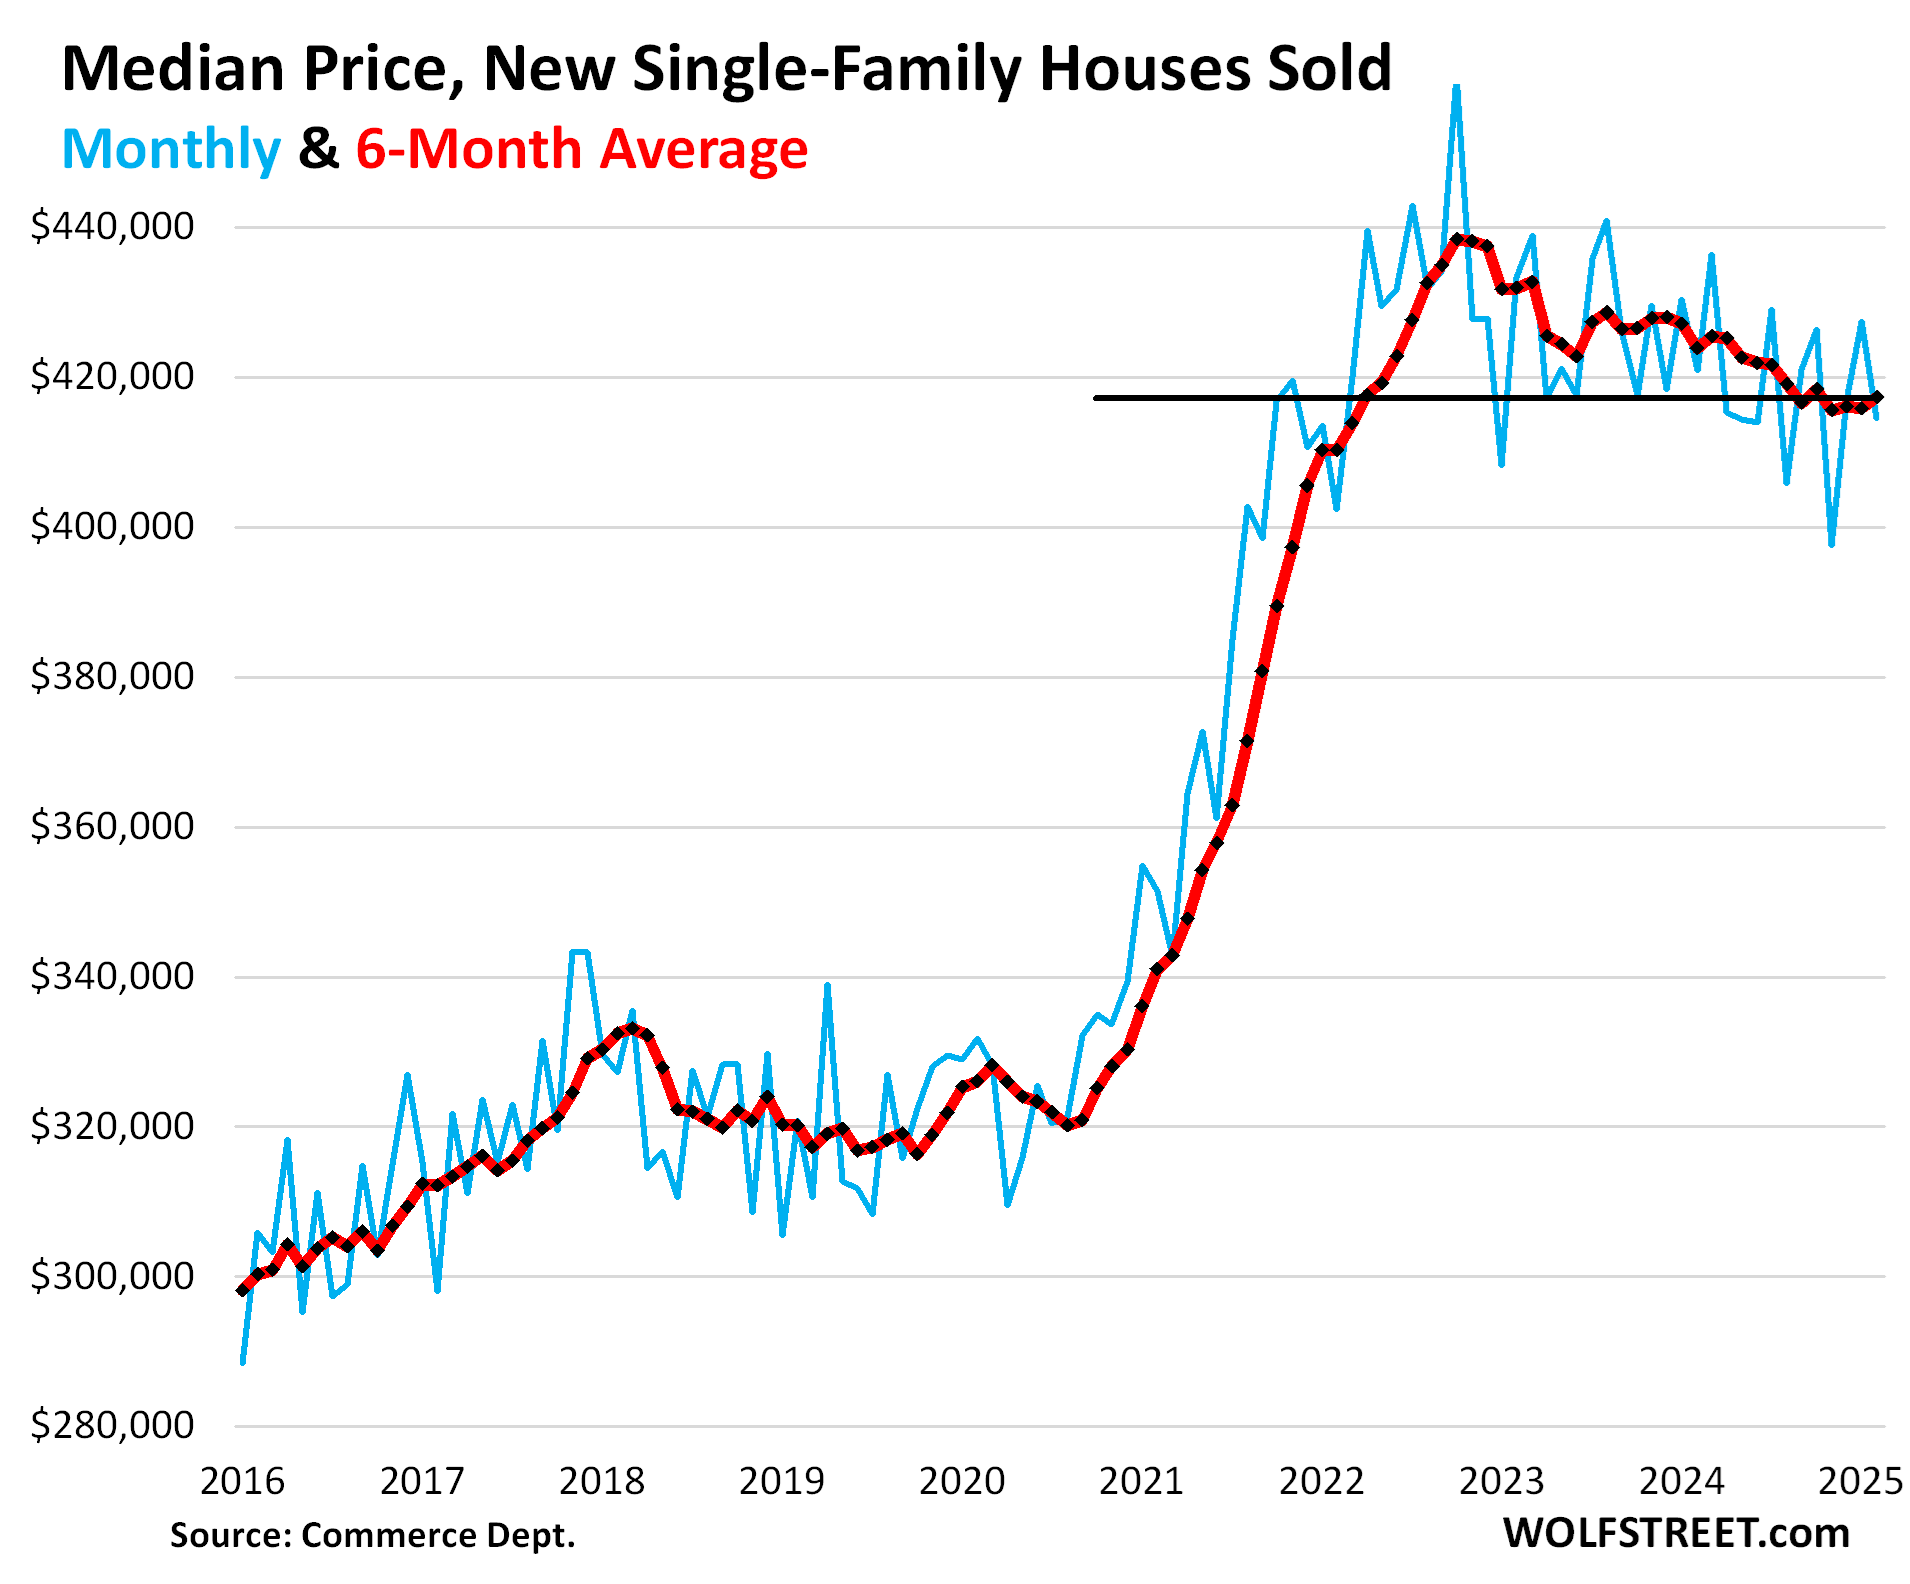
Median price wobbles along below the 2022 peak.
The median contract price of new single-family houses at all stages of construction that sold in February fell to $414,500, down by 10% from the peak in October 2022. January’s originally reported spike to $446,300 was revised down to $427,400.
The six-month average, which irons out the random volatility and the revisions, ticked up to $417,300, below where it had been in October, back where it had first been in April 2022, down by 1.5% year-over-year, and down by 5% from the peak in late 2022. In recent months, it has been roughly stable (red).
But note: these are contract prices that do not include the costs of the mortgage-rate buydowns (which show up on builders’ financial statements in gross margins as a cost) and certain incentives, such as free upgrades. So these median prices are not a great reflection of how aggressive actual pricing – including mortgage-rate buydowns and incentives – is in the market.
Enjoy reading WOLF STREET and want to support it? You can donate. I appreciate it immensely. Click on the mug to find out how:

![]()
The post New “Spec” Houses for Sale Jump 34% YoY, Highest since 2009. In the South, Inventory of New Houses at Record Highs for Months, in the West Jump to Highest since 2007 appeared first on Energy News Beat.
“}]]
Energy News Beat