[[{“value”:”
Fed’s assets-to-GDP ratio dropped to 22.6%, first seen in 2013. Quantitative Tightening has shed 25% of total assets from peak.
By Wolf Richter for WOLF STREET.
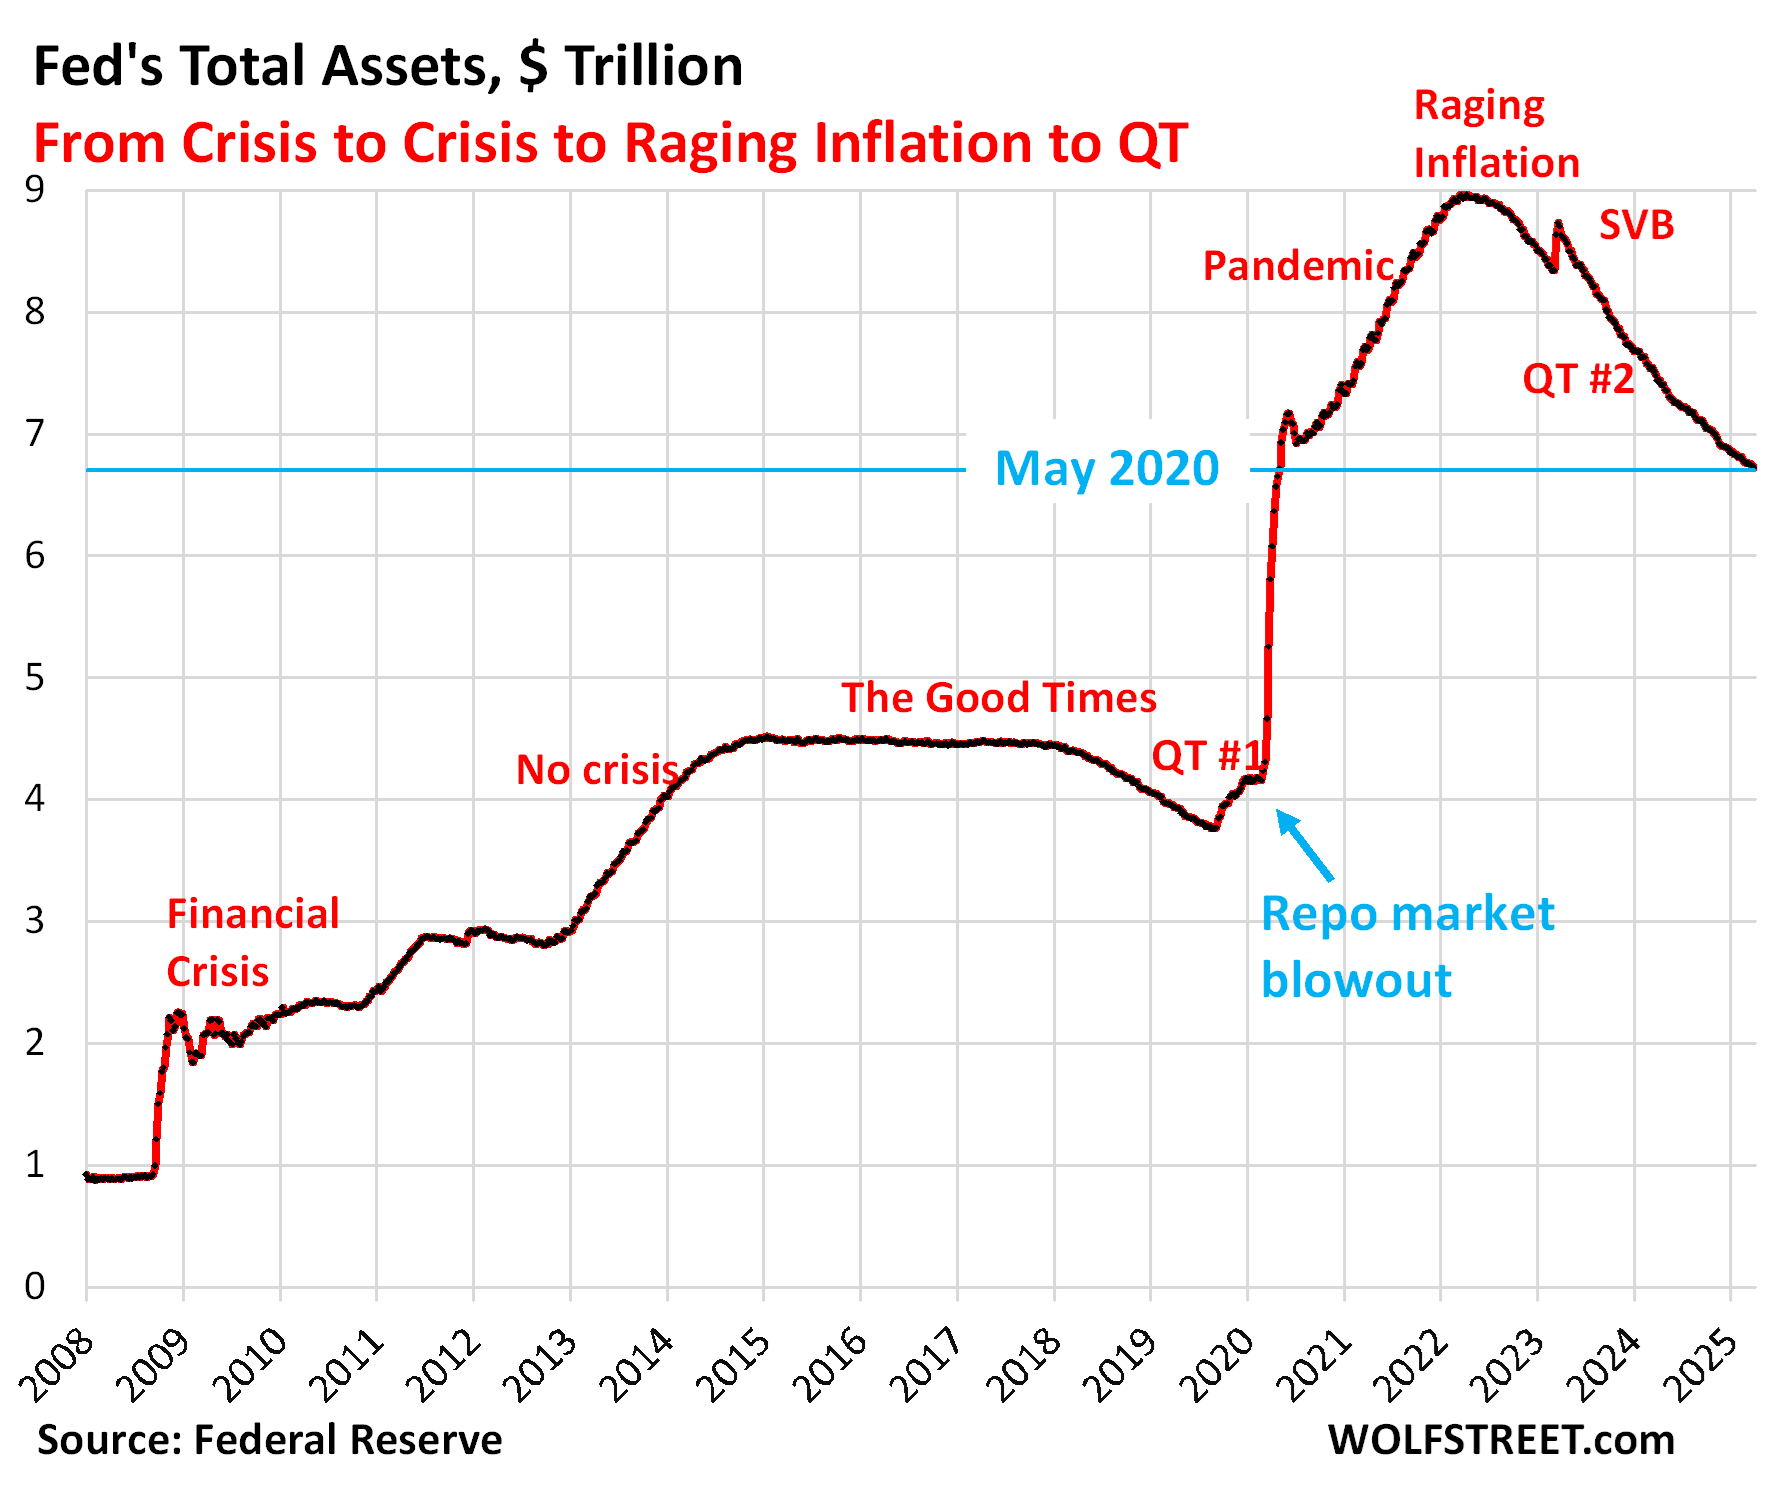
Total assets on the Fed’s balance sheet fell by $33 billion in March, to $6.72 trillion, the lowest since May 6, 2020, according to the Fed’s weekly balance sheet today.
Since the end of QE in April 2022, the Fed’s balance sheet has declined by $2.24 trillion, or by 25%. In terms of the $4.81 trillion of pandemic QE from March 2020 through April 2022, QT has shed nearly half of them.

QT assets.
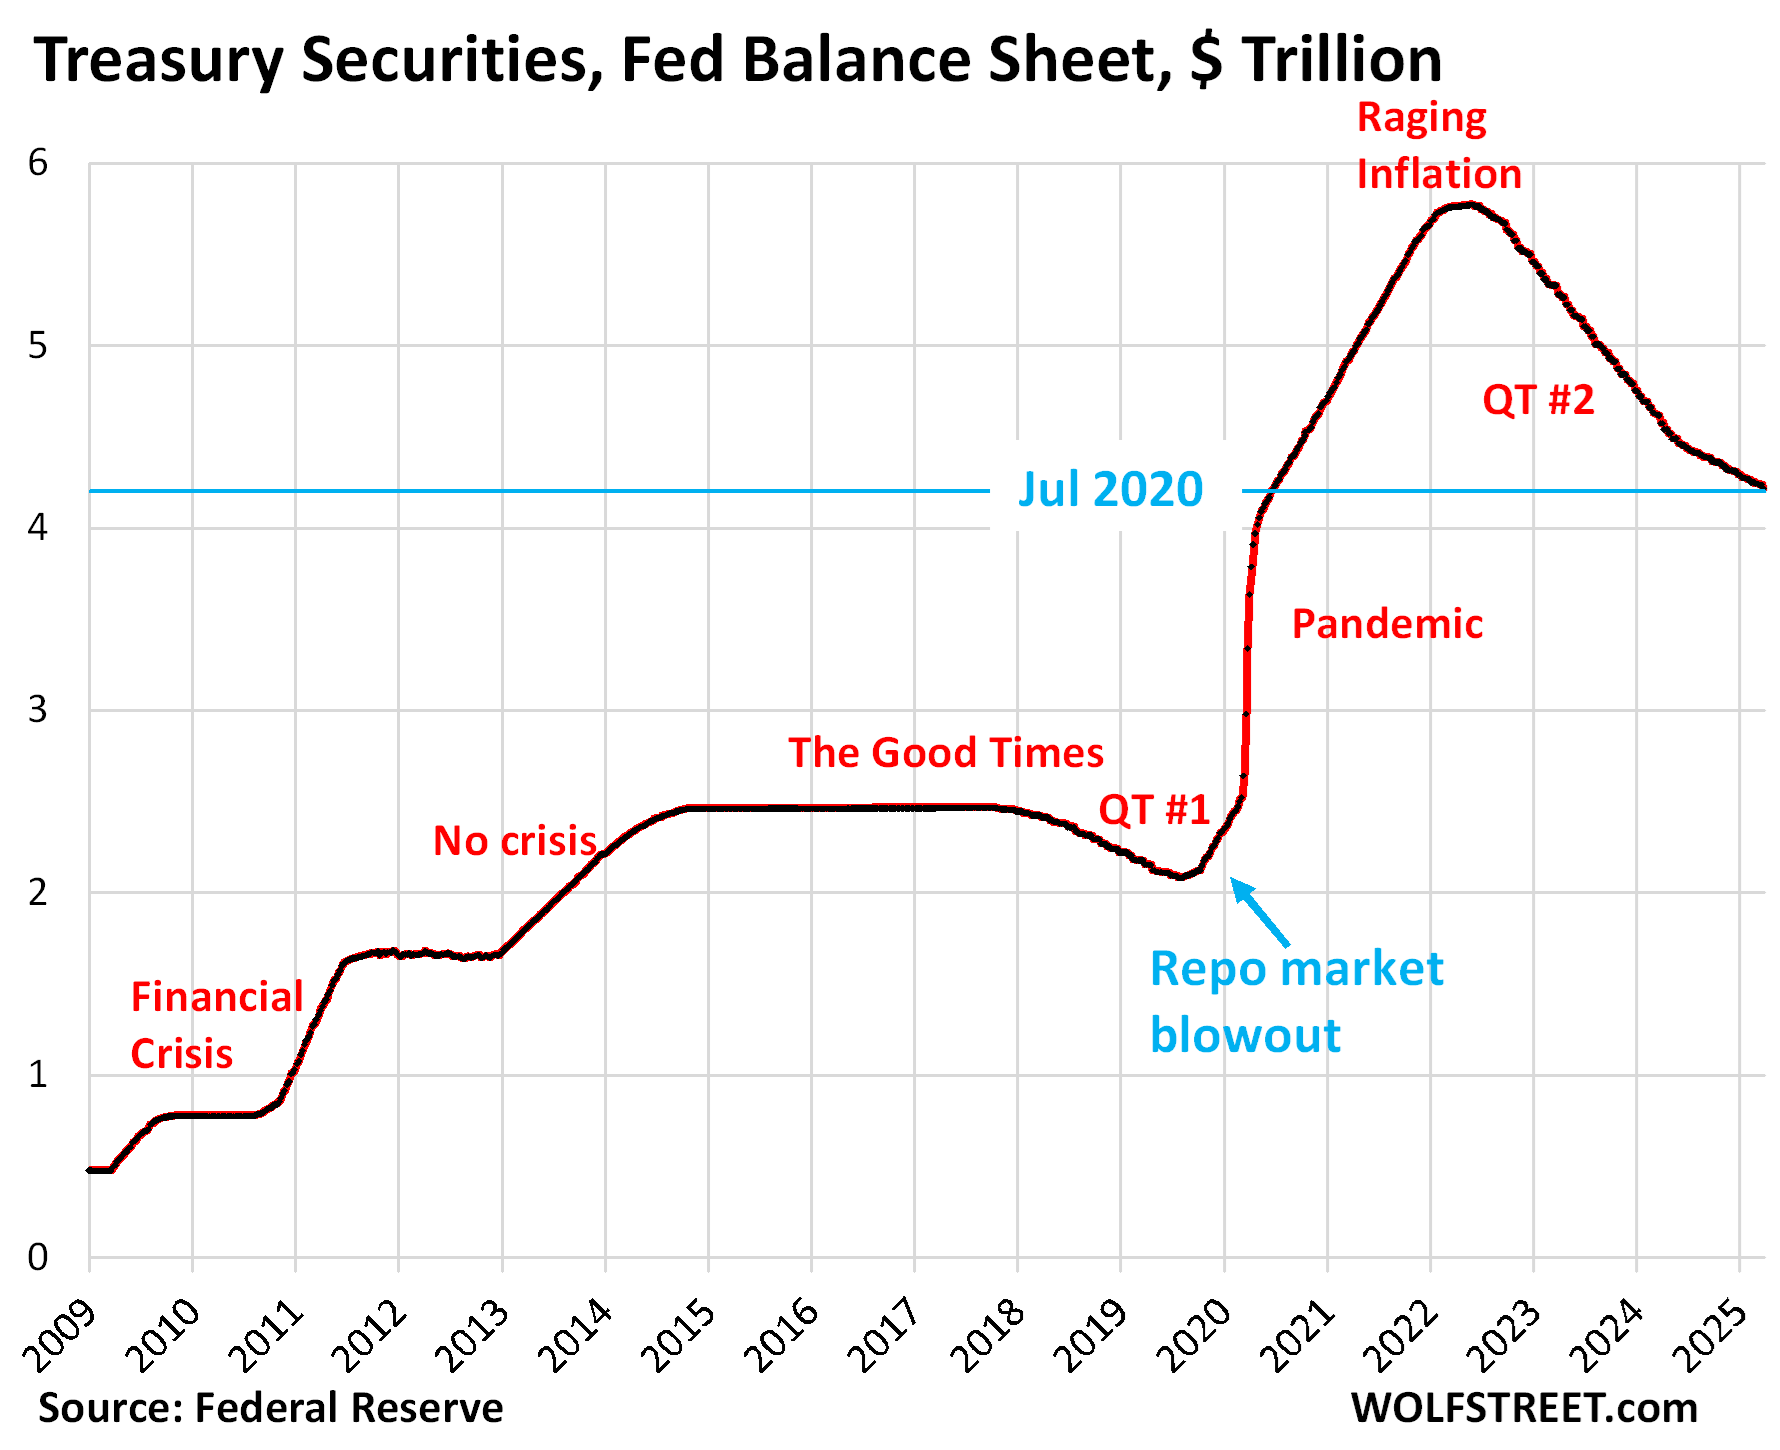
Treasury securities: -$22.5 billion in March, -$1.55 trillion from peak in June 2022, or -27% since the peak, to $4.22 trillion, the lowest since July 1, 2020.
In terms of the $3.27 trillion in Treasury securities piled on during pandemic QE, the Fed has shed now 47.5% of them.
Treasury notes (2- to 10-year) and Treasury bonds (20- & 30-year) “roll off” the balance sheet mid-month and at the end of the month when they mature and the Fed gets paid face value. Since June 2024, the roll-off has been capped at $25 billion per month. About that much has been rolling off, minus the amount of inflation protection the Fed earns on its Treasury Inflation Protected Securities (TIPS) that is added to the principal of the TIPS.
In March, the Fed received $2.5 billion in inflation protection, which was added to the TIPS principal. Without it, $25.0 billion in Treasury securities rolled off the balance sheet.

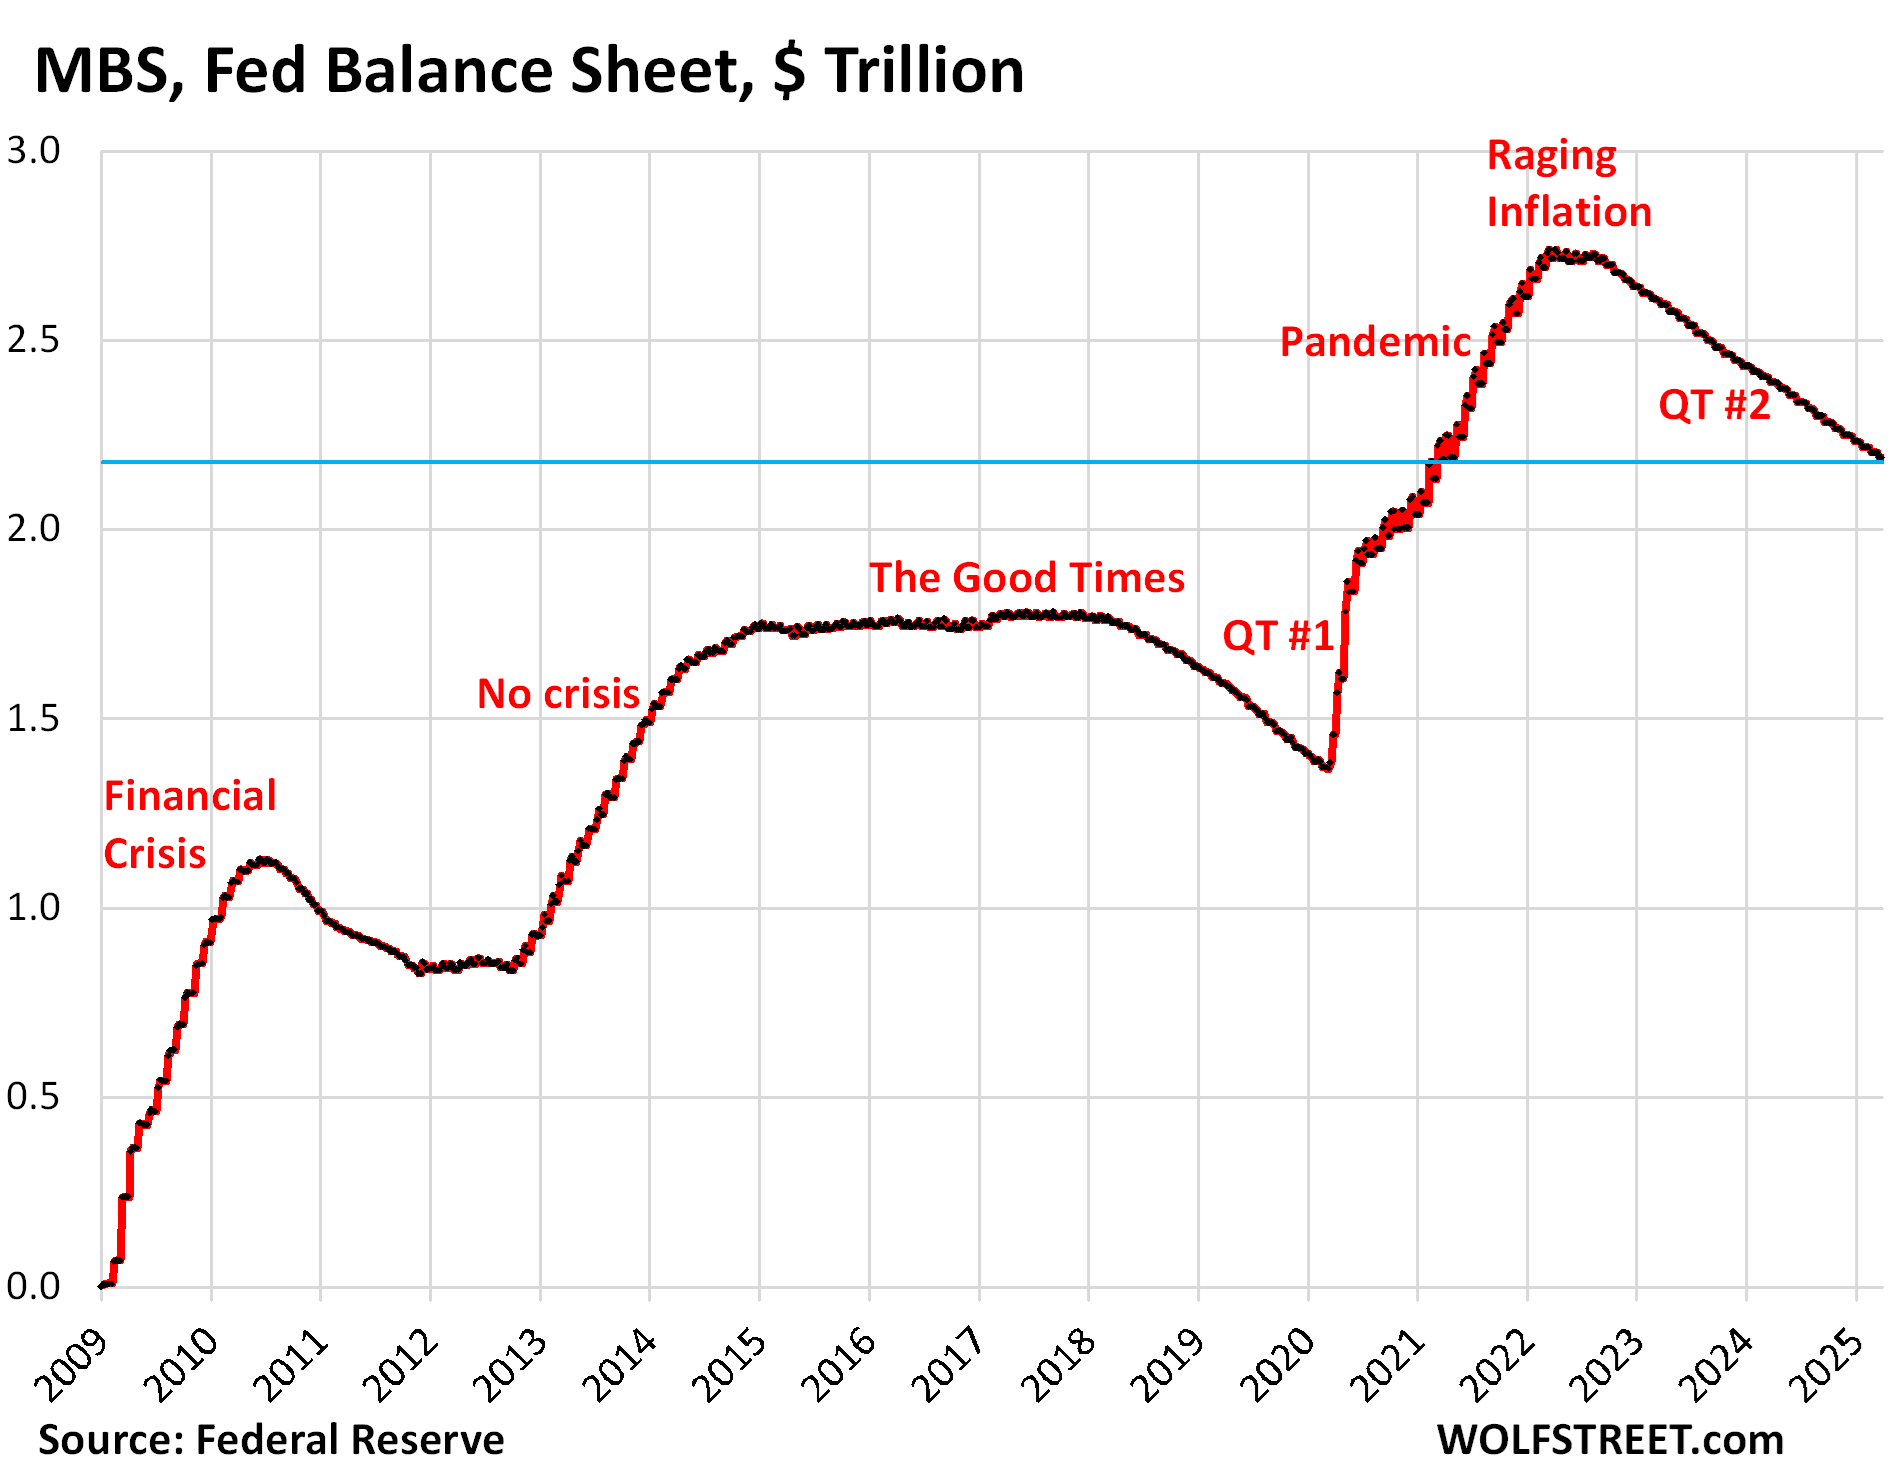
Mortgage-Backed Securities (MBS): -$14.3 billion in March, -$551 billion from the peak, to $2.19 trillion, where they’d first been in March 2021.
The Fed has shed 20% of its MBS since the peak in April 2022. In terms of the $1.37 trillion in MBS that the Fed added during pandemic QE, it has shed 40% of them.
MBS come off the balance sheet primarily via pass-through principal payments that holders receive when mortgages are paid off (mortgaged homes are sold, mortgages are refinanced) and when mortgage payments are made. But as sales of existing homes have plunged and mortgage refinancing has collapsed, far fewer mortgages got paid off, and passthrough principal payments to MBS holders, such as the Fed, have become a trickle. As a result, MBS have come off the Fed’s balance sheet at a pace that has been mostly in the range of $14-17 billion a month.
The Fed holds only “agency” MBS that are guaranteed by the government, where the taxpayer would eat the losses when borrowers default on mortgages, not the Fed.

Bank liquidity facilities: inactive.
The Fed had five bank liquidity facilities. The two that were invented during the March 2023 bank panic to deal with the fallout from the SVB collapse are now shut down: the Bank Term Funding Program (BTFP) and the Loans to the FDIC.
And the other three are essentially inactive:
- Central Bank Liquidity Swaps ($95 million)
- Repos ($0)
- Discount Window: $2.2 billion, down a tad from February. During the SVB panic, it had spiked to $153 billion.
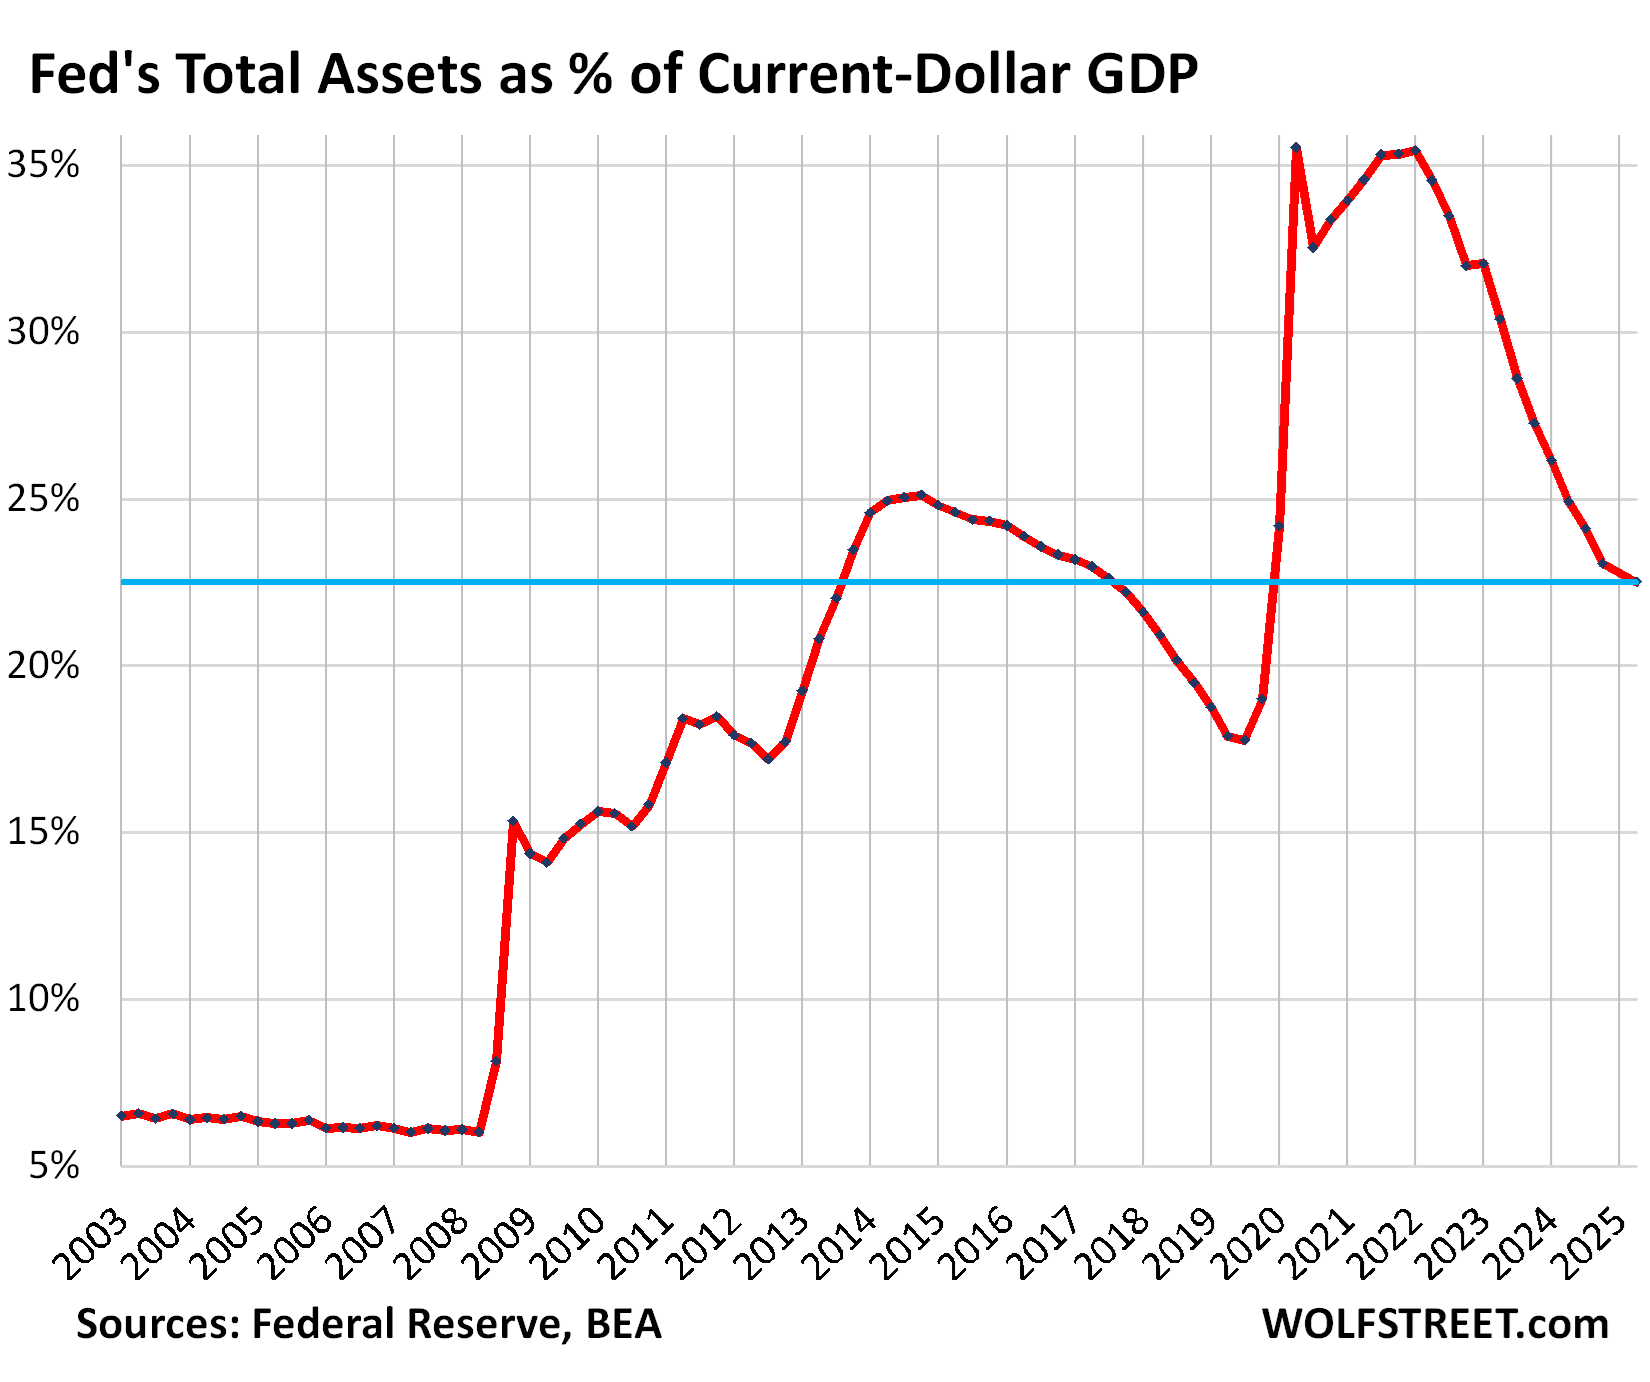
The assets-to-GDP ratio. Before QE started in 2009, the Fed’s balance sheet grew over the years roughly in line with the economy as measured by “current dollar” GDP. So the ratio of assets not adjusted for inflation to GDP not adjusted for inflation was roughly stable. This assets-to-GDP ratio was 6.0% in 2008.
During the first rounds of QE, the ratio maxed out at 25% by the end of 2014. During pandemic QE, it maxed out at 35.5% of GDP in Q1 2020 as GDP had collapsed, and then, as GDP recovered while QE continued even faster, the ratio returned to 35.4% in Q1 2022, when QE stopped.
After $2.24 trillion in QT and three years of economic growth since Q1 2022, the ratio has dropped to 22.6% in Q1 (estimate), first seen in 2013:

Enjoy reading WOLF STREET and want to support it? You can donate. I appreciate it immensely. Click on the mug to find out how:
![]()
The post Fed Balance Sheet QT: -$33 Billion in March, -$2.24 Trillion from Peak, to $6.72 Trillion, Lowest since May 2020 appeared first on Energy News Beat.
“}]]
Energy News Beat

