[[{“value”:”
Epic demand destruction has ensued after prices spiked by 50% in three years. And now supply is piling up.
By Wolf Richter for WOLF STREET.
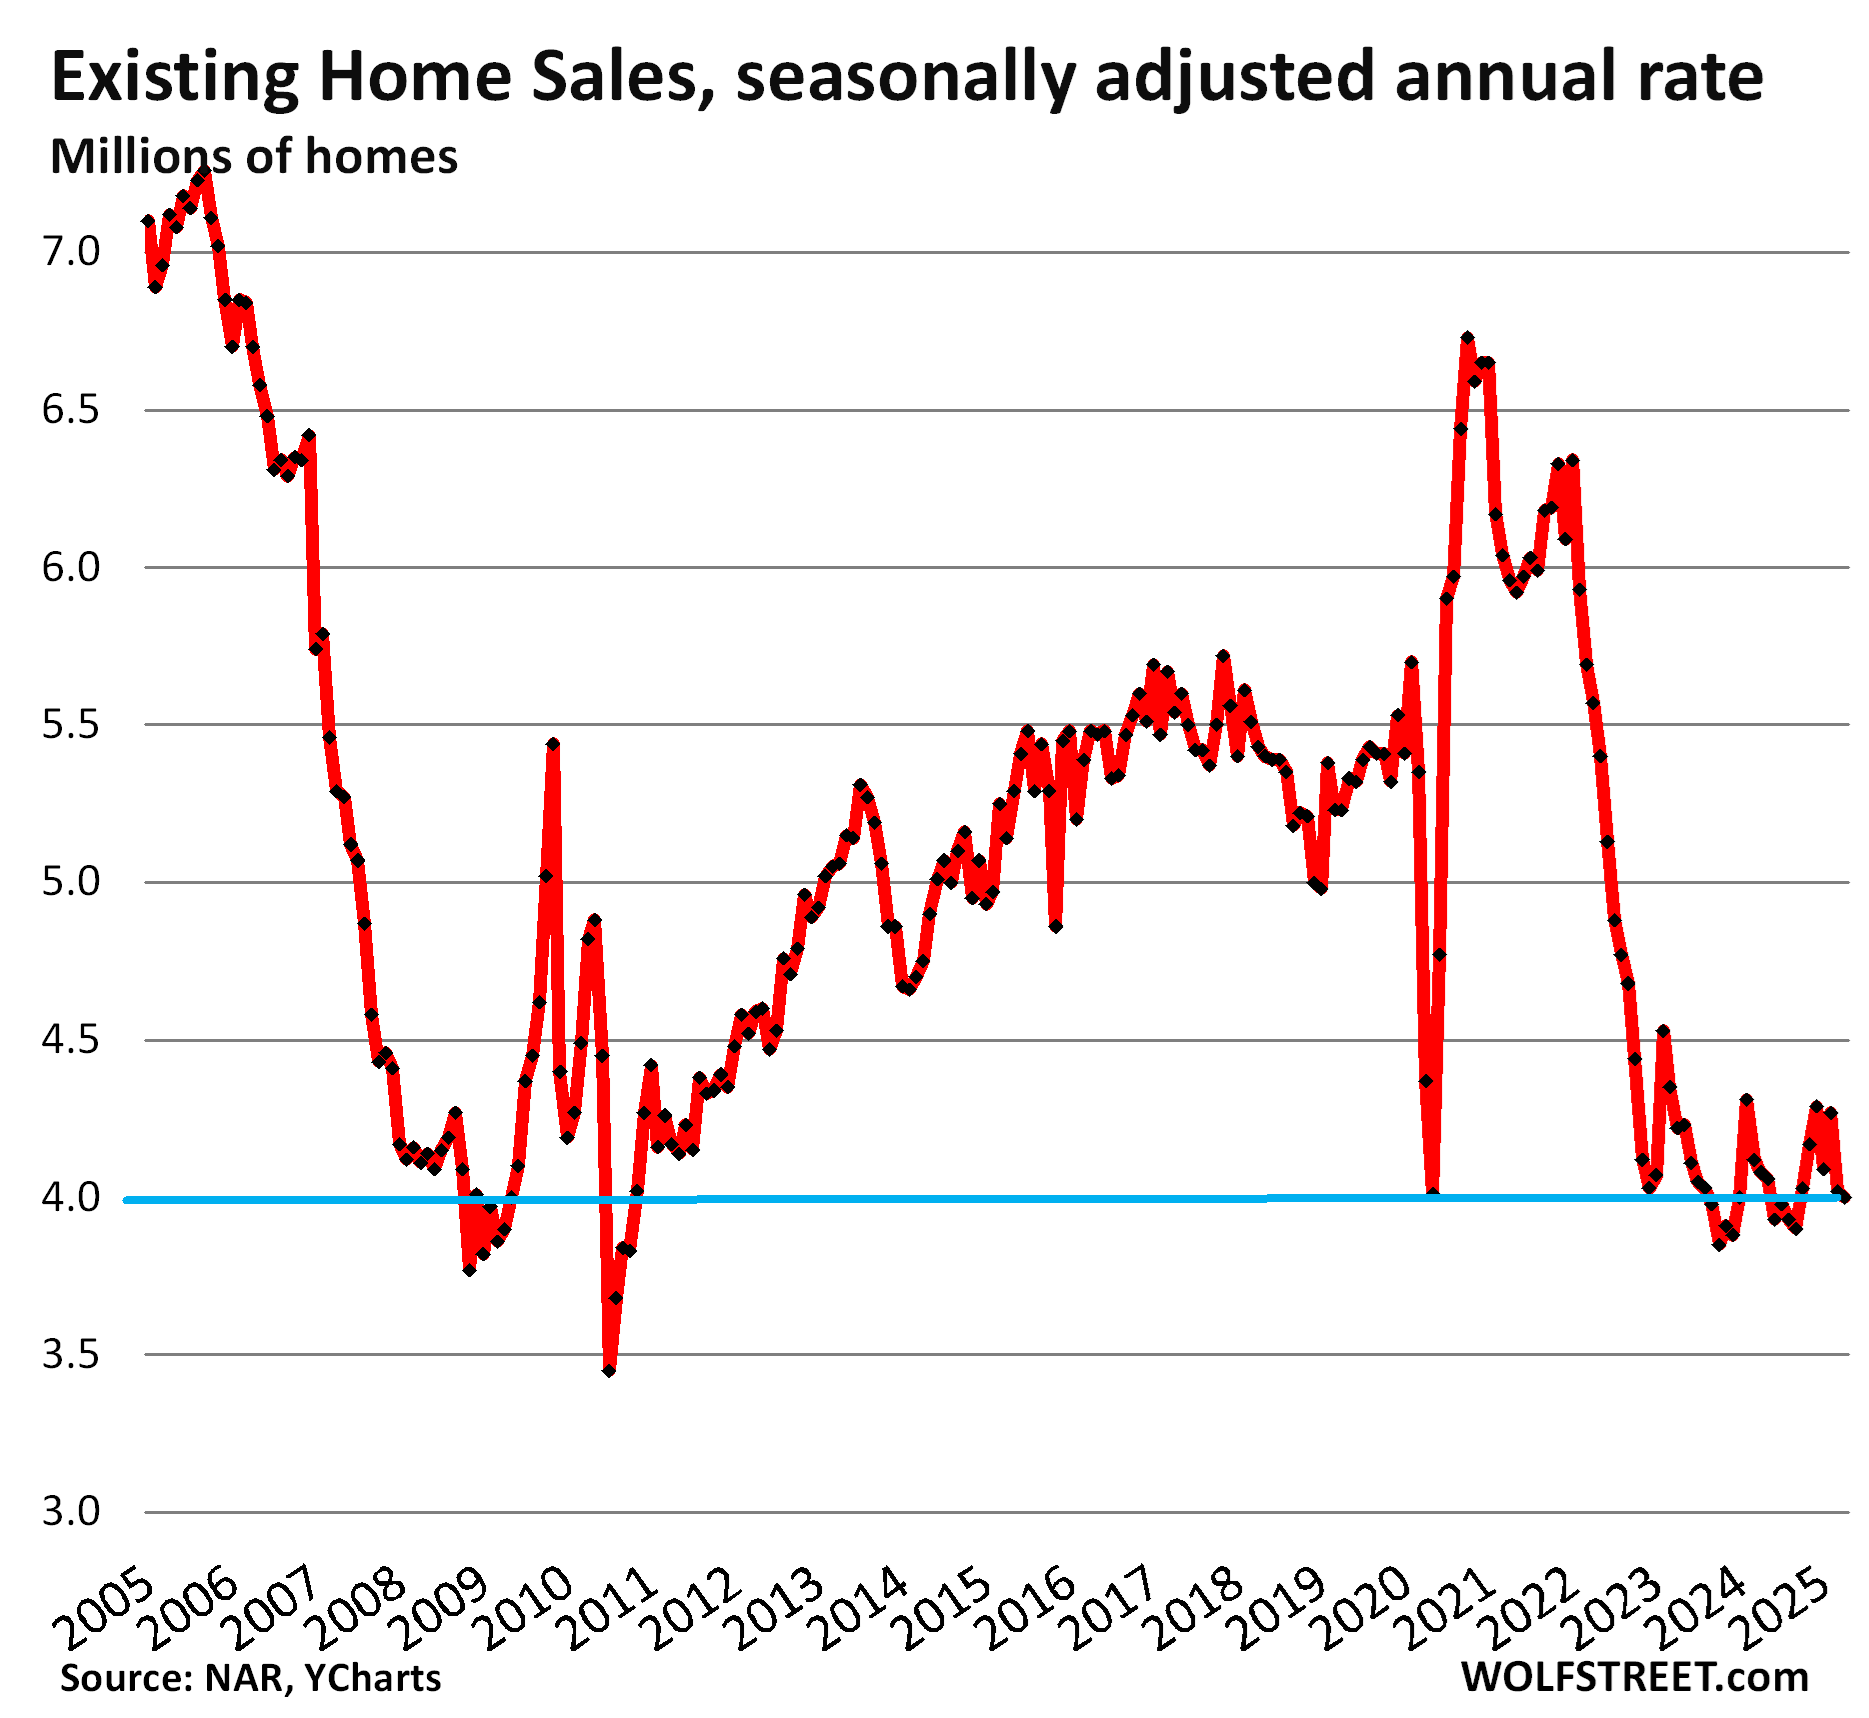
Sales of existing single-family homes, townhouses, condos, and co-ops that closed in April fell by 0.5% from the prior month and by 2.0% year-over-year to a seasonally adjusted annual rate of 4.0 million homes, the worst April since 2009, according to data from the National Association of Realtors today.
Sales began collapsing in early 2022, after the national median price had spiked by 50% in just three years, which was more than the market could bear. At the same time, mortgage rates were on their way to the 7% range. And demand destruction ensued. At first, in 2022, low inventories were blamed for the collapse in sales, but now supply has soared to the highest level in years, and sales have plunged further.
The seasonally adjusted annual rate of sales in April of 4.0 million compared to Aprils in prior years (historical data from YCharts):
- 2024: -2.0%
- 2023: -5.2%
- 2022: -28.2%
- 2019: -23.5%
- 2018: -26.3%
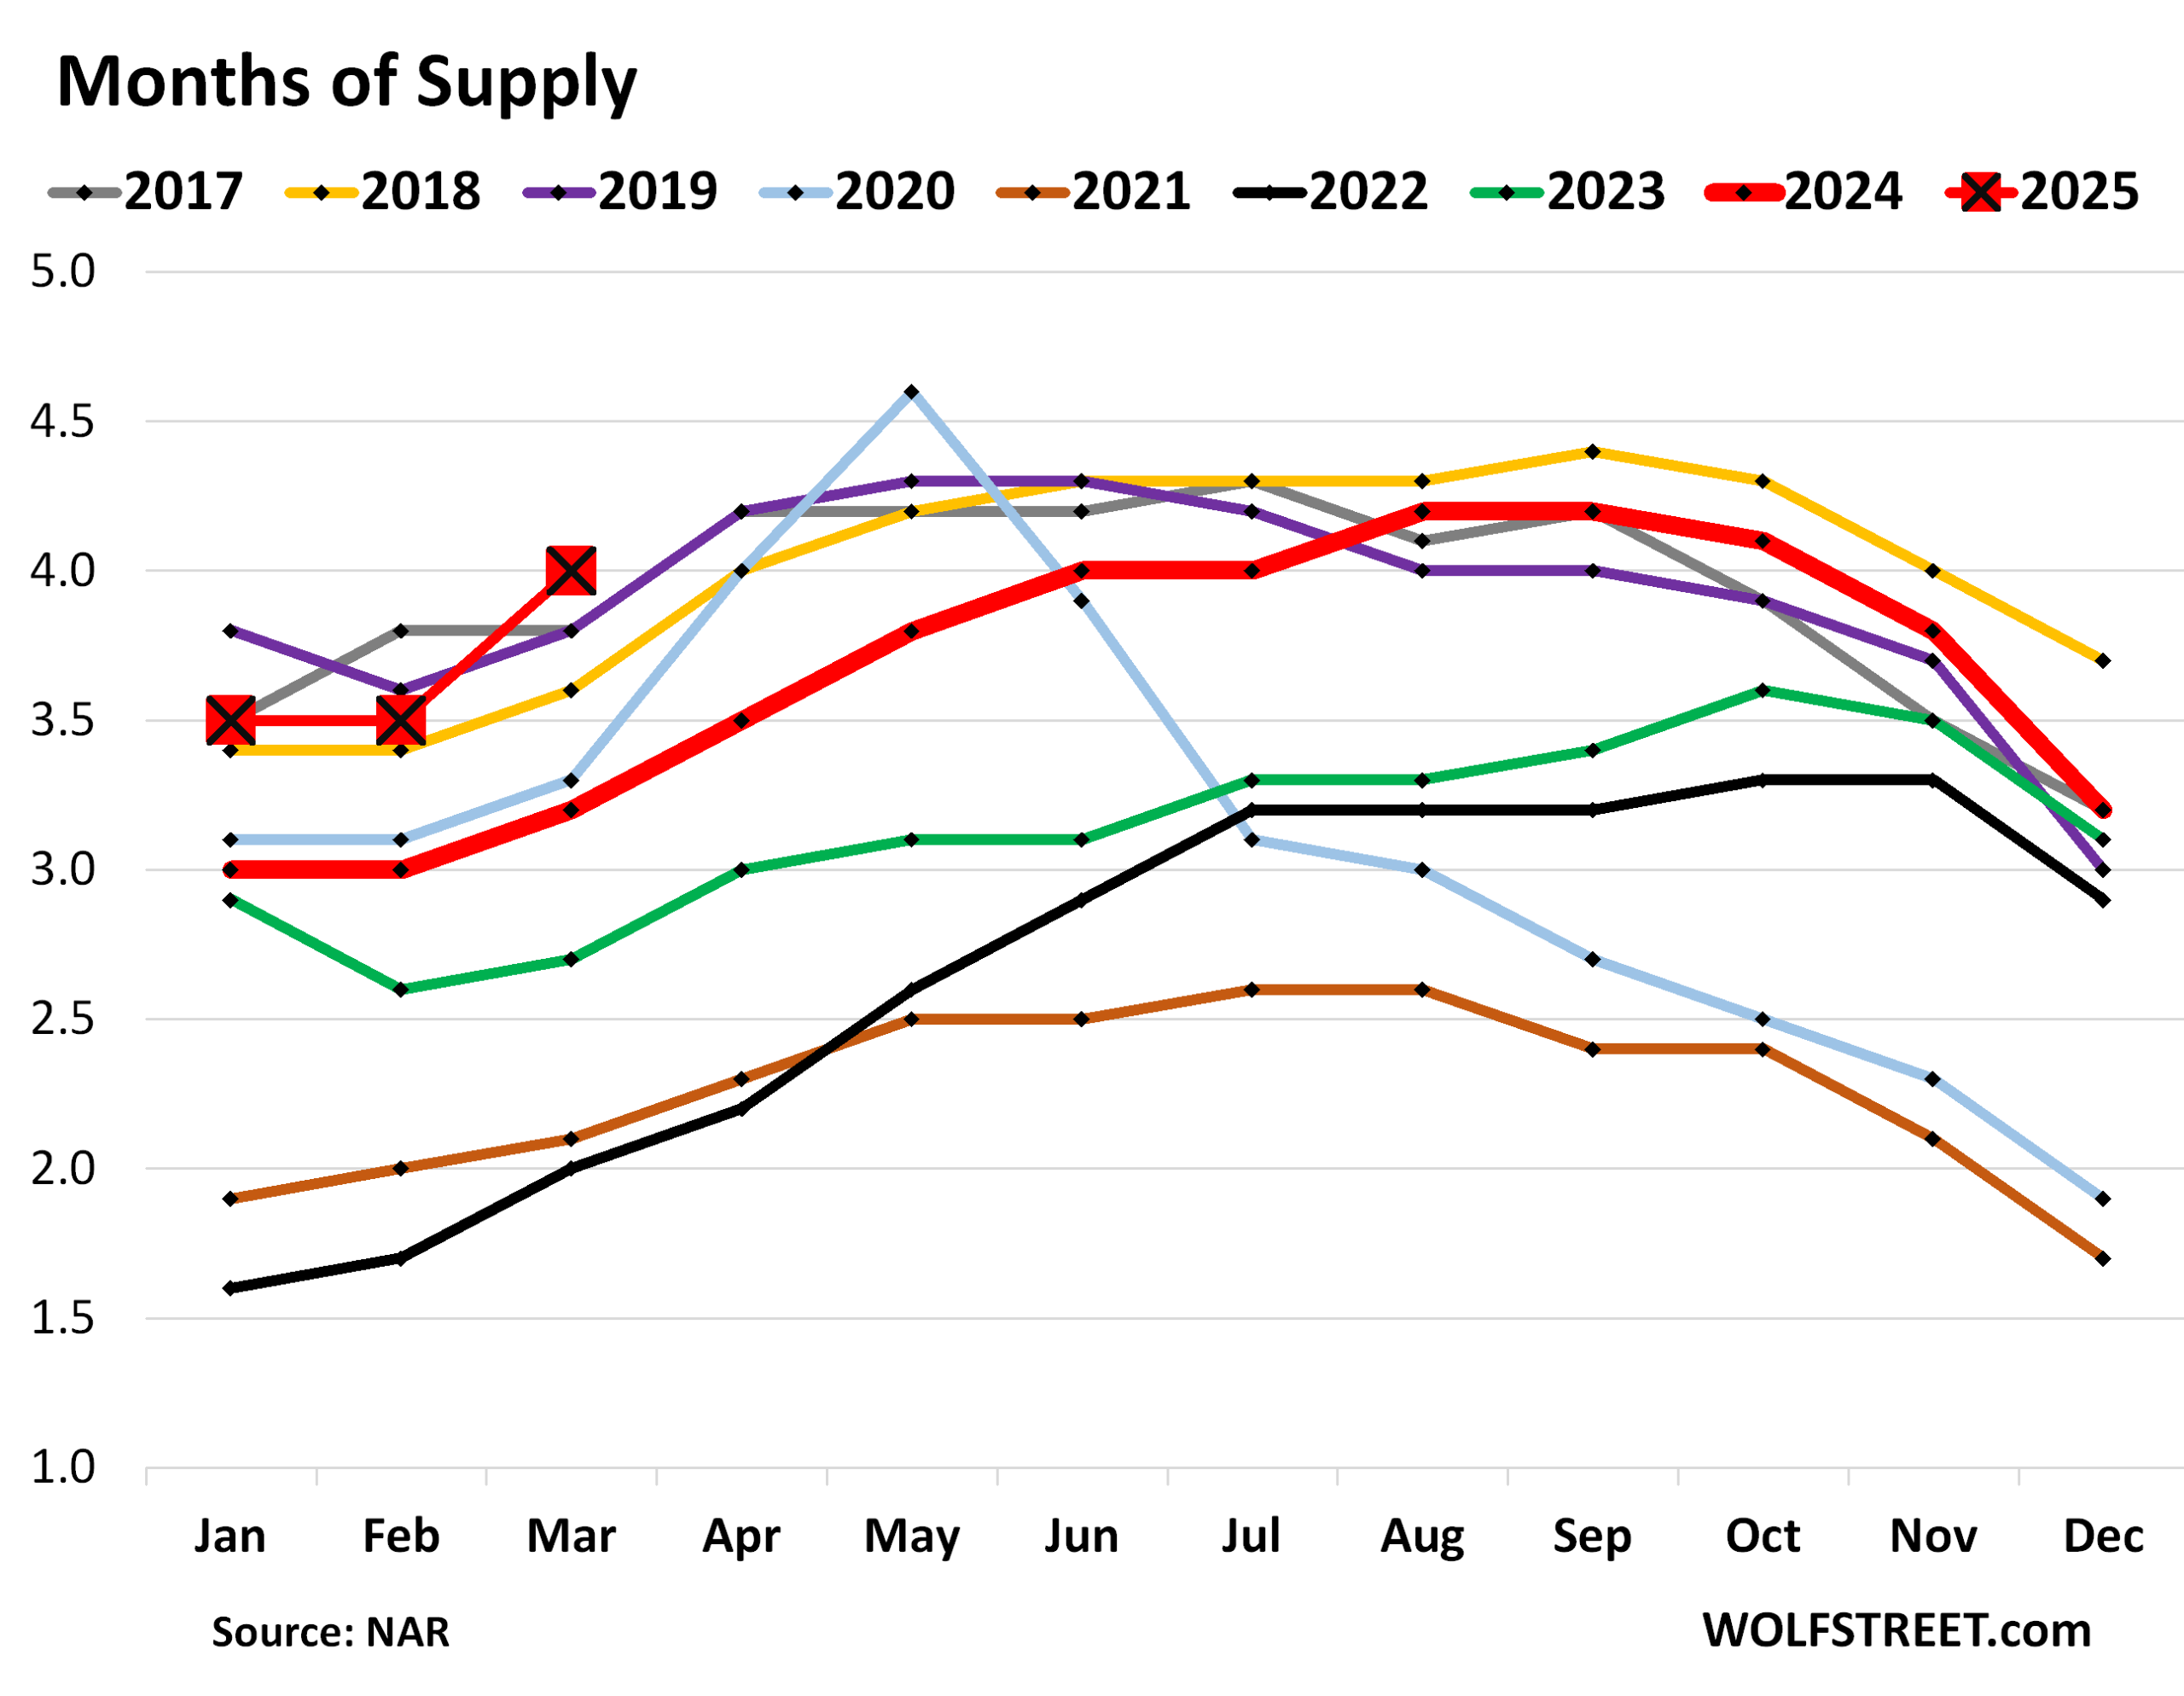
Highest supply for April since 2016.
Inventory of homes listed for sale jumped by 9.0% in April from March, and by 20.8% year-over-year, to 1.45 million listings. This jump in inventory occurred because buyers were on strike and weren’t buying enough of the homes for sale, and inventory is piling up.
Even in the formerly hottest markets, there are now big surges in inventory, such as in the major markets in Florida and the top four markets in California.
Supply of unsold homes on the market jumped to 4.4 months at the April rate of sales, the highest supply for any April since 2016. The months of 2025 are shown as the red squares:
Demand destruction by region.
The hotly awaited spring selling season has fizzled across all four Census Regions. A map of the regions is in the comments below the article.
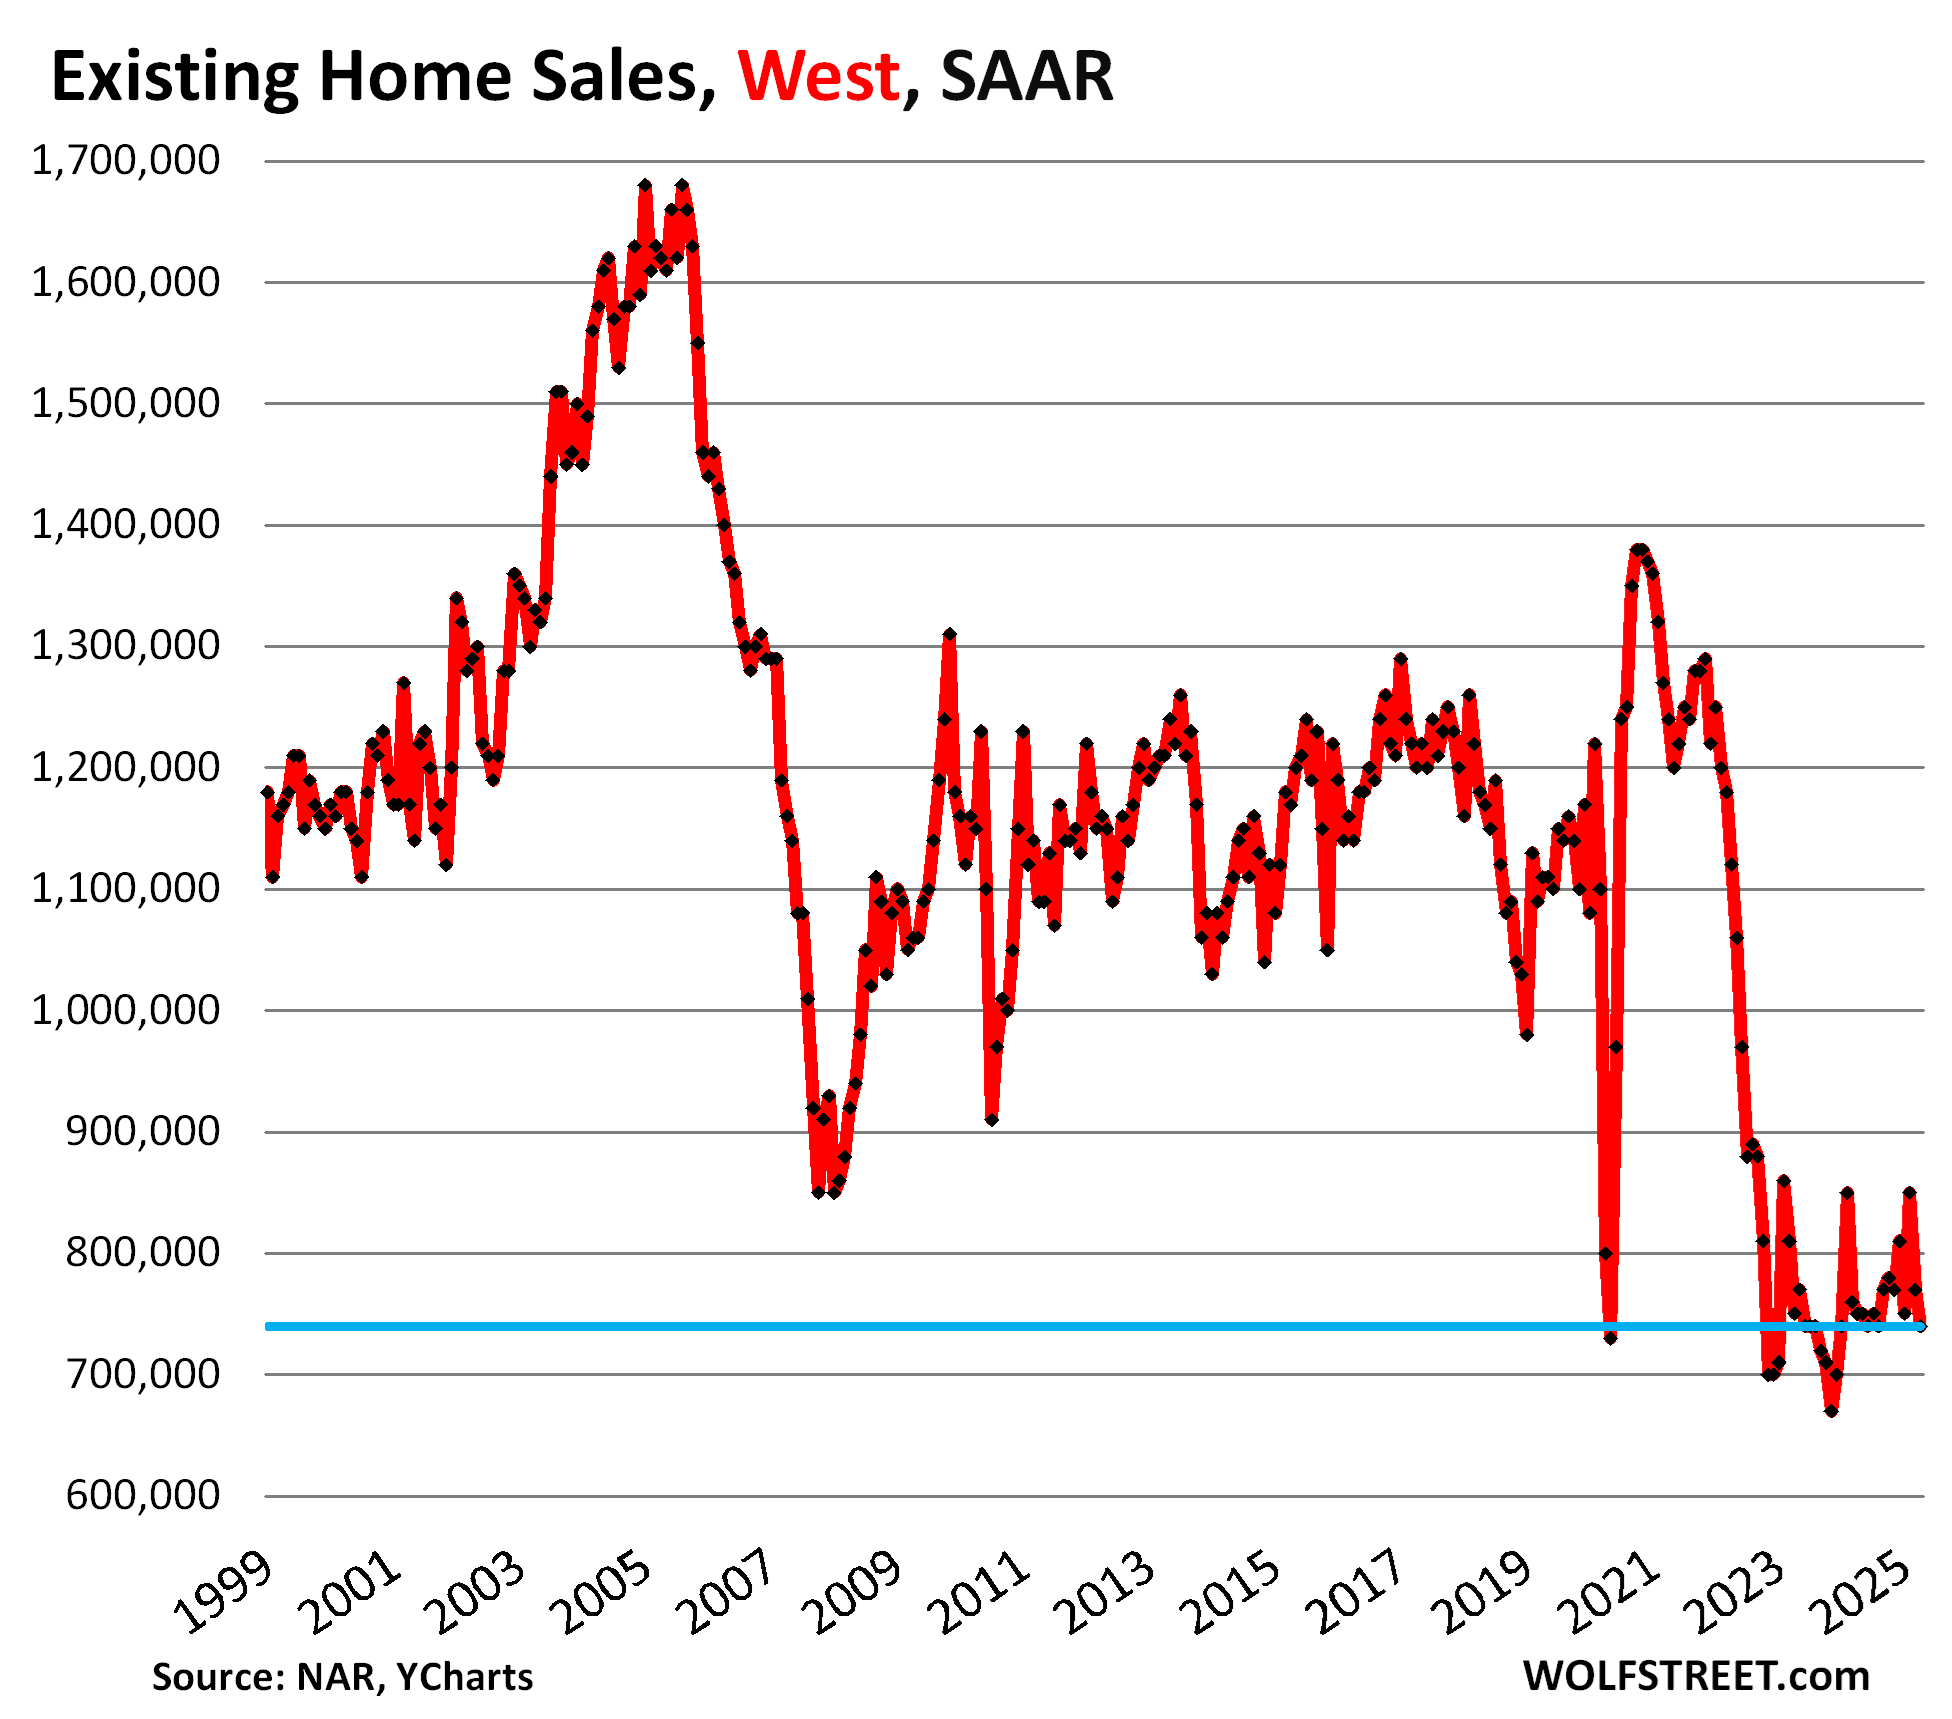
In the West, the seasonally adjusted annual rate of sales (SAAR) fell to 740,000 homes in April, the worst April in the data going back to the 1990s, and down by 1.3% from the already dismal sales in Aprils in 2024 and 2023:
| Sales in the West, compared to April in: | |
| 2024 | -1.3% |
| 2023 | -1.3% |
| 2022 | -33.9% |
| 2019 | -33.3% |
| 2018 | -37.3% |
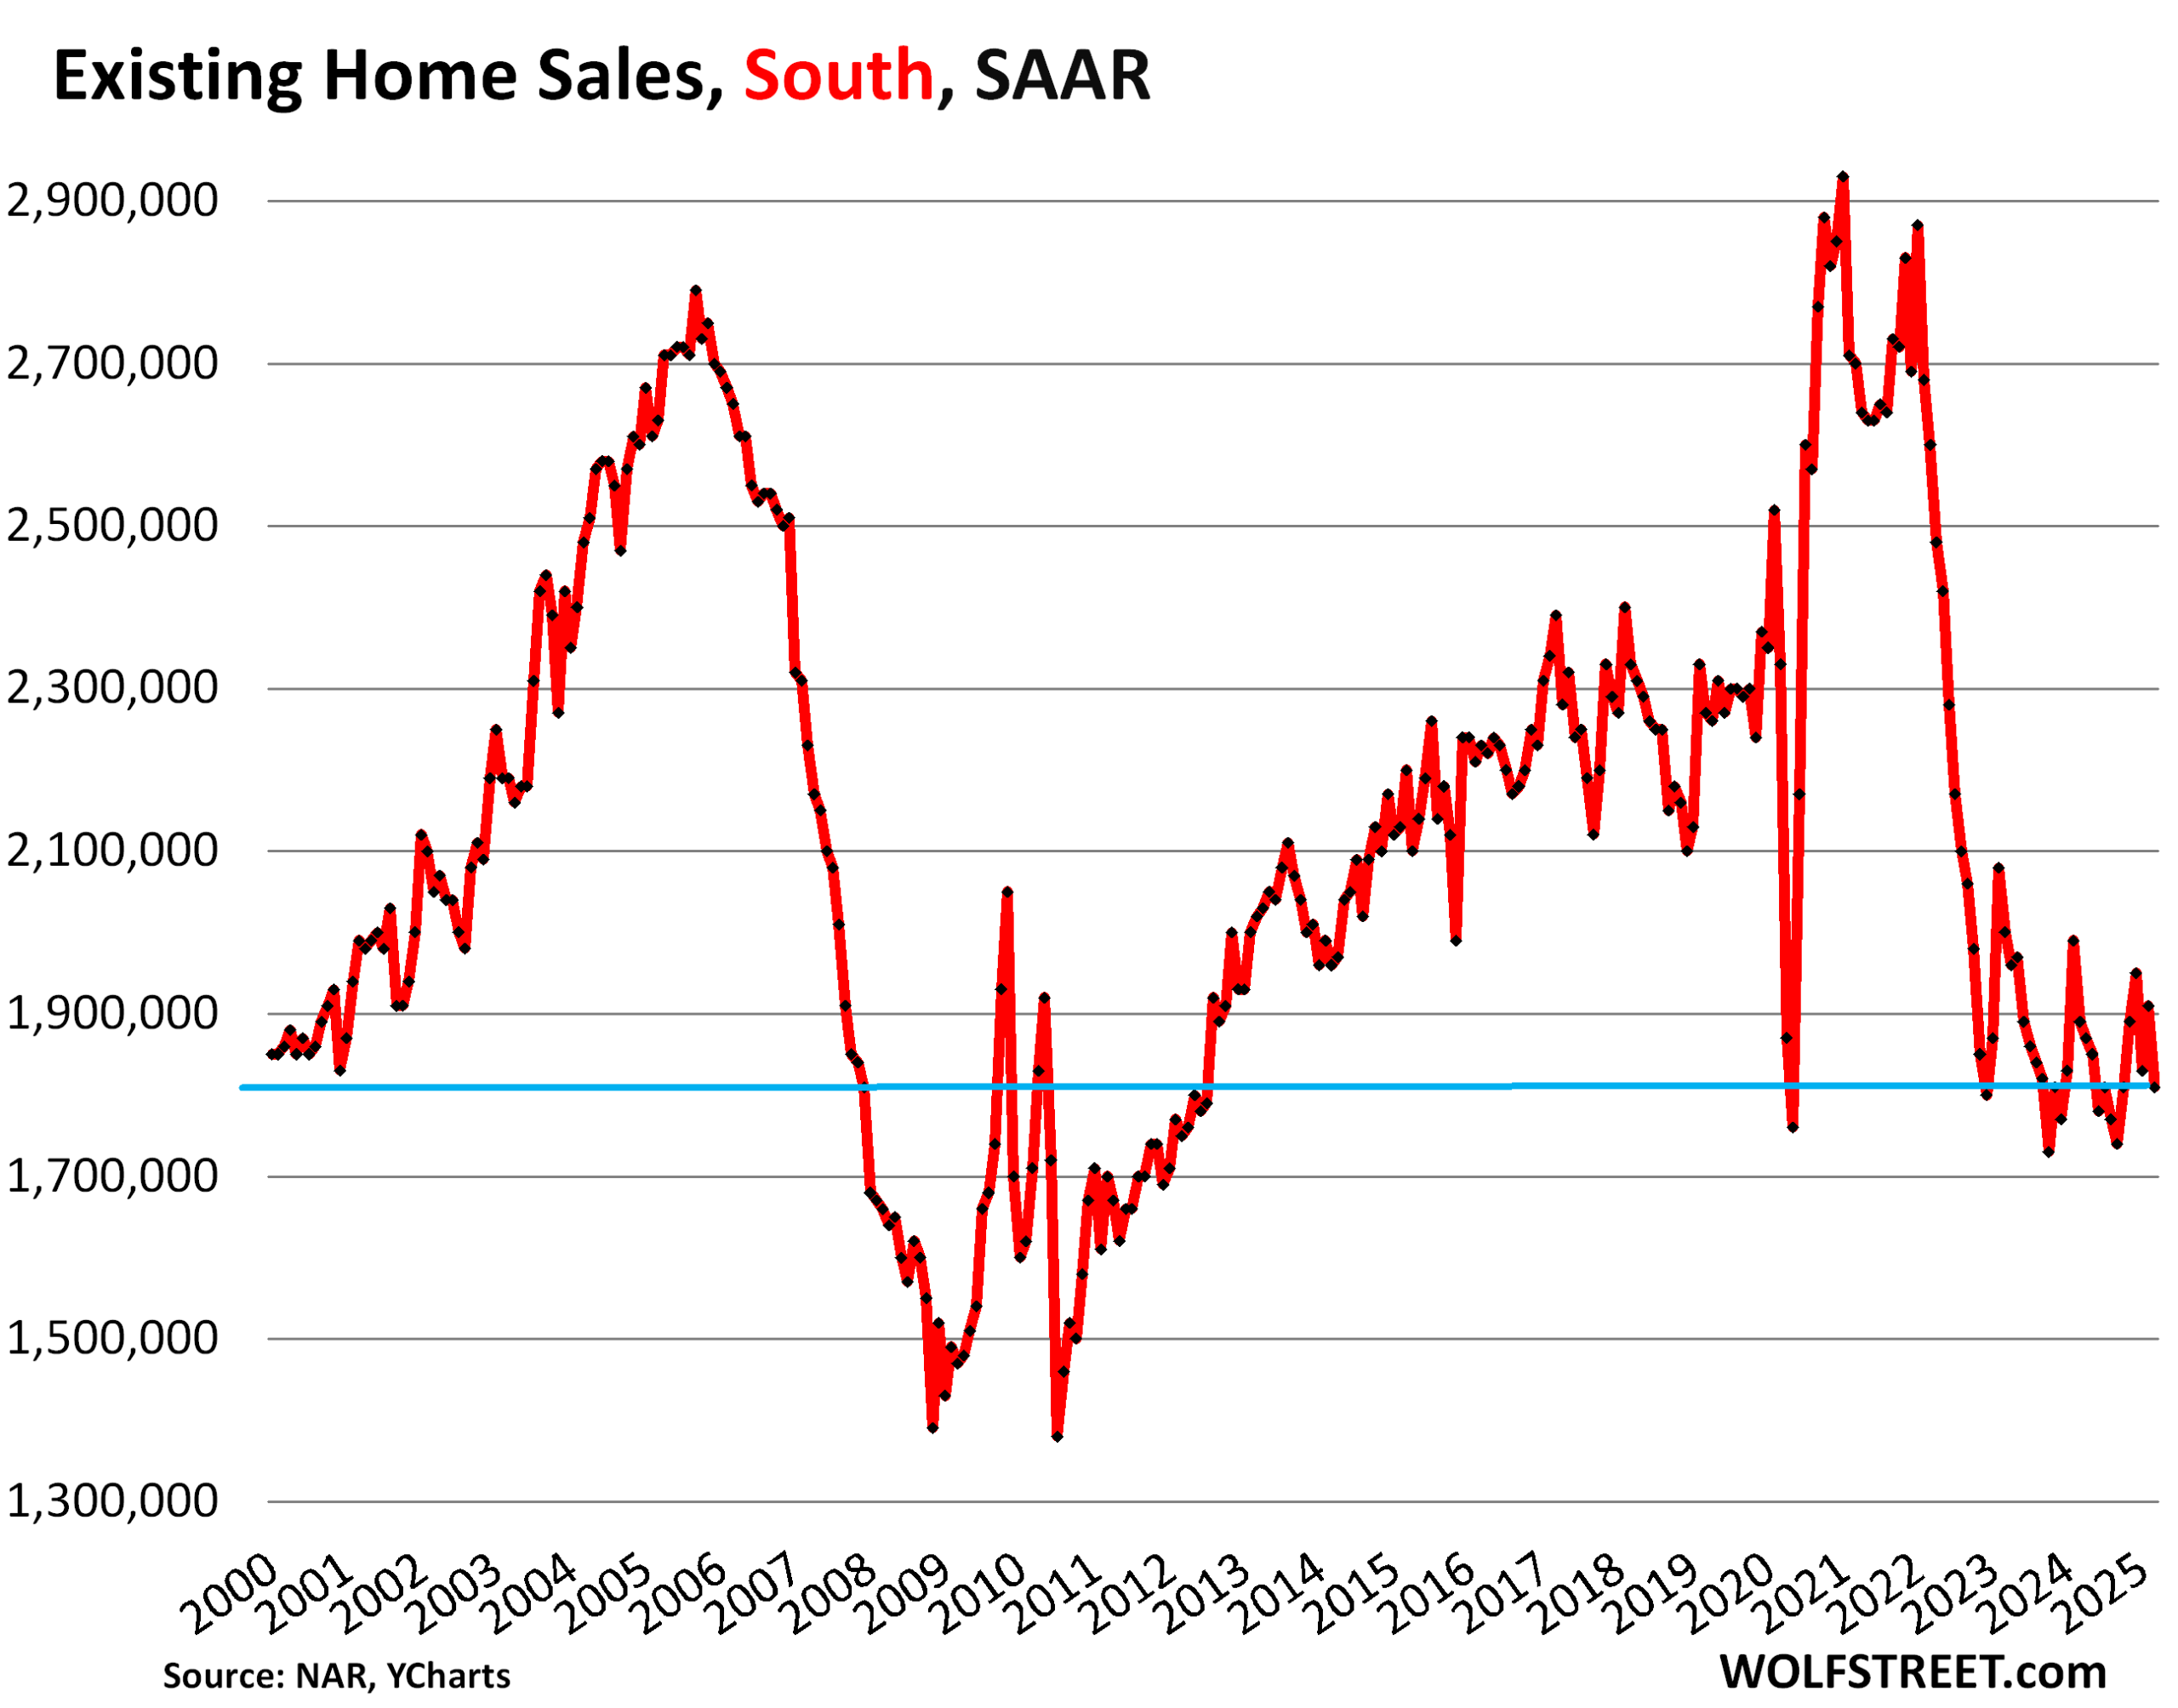
In the South, the sales remained at 1.81 million homes SAAR in April, worst April since 2012.
| Sales in the South, compared to April in: | |
| 2024 | -3.2% |
| 2023 | -7.7% |
| 2022 | -27.0% |
| 2019 | -19.9% |
| 2018 | -21.6% |
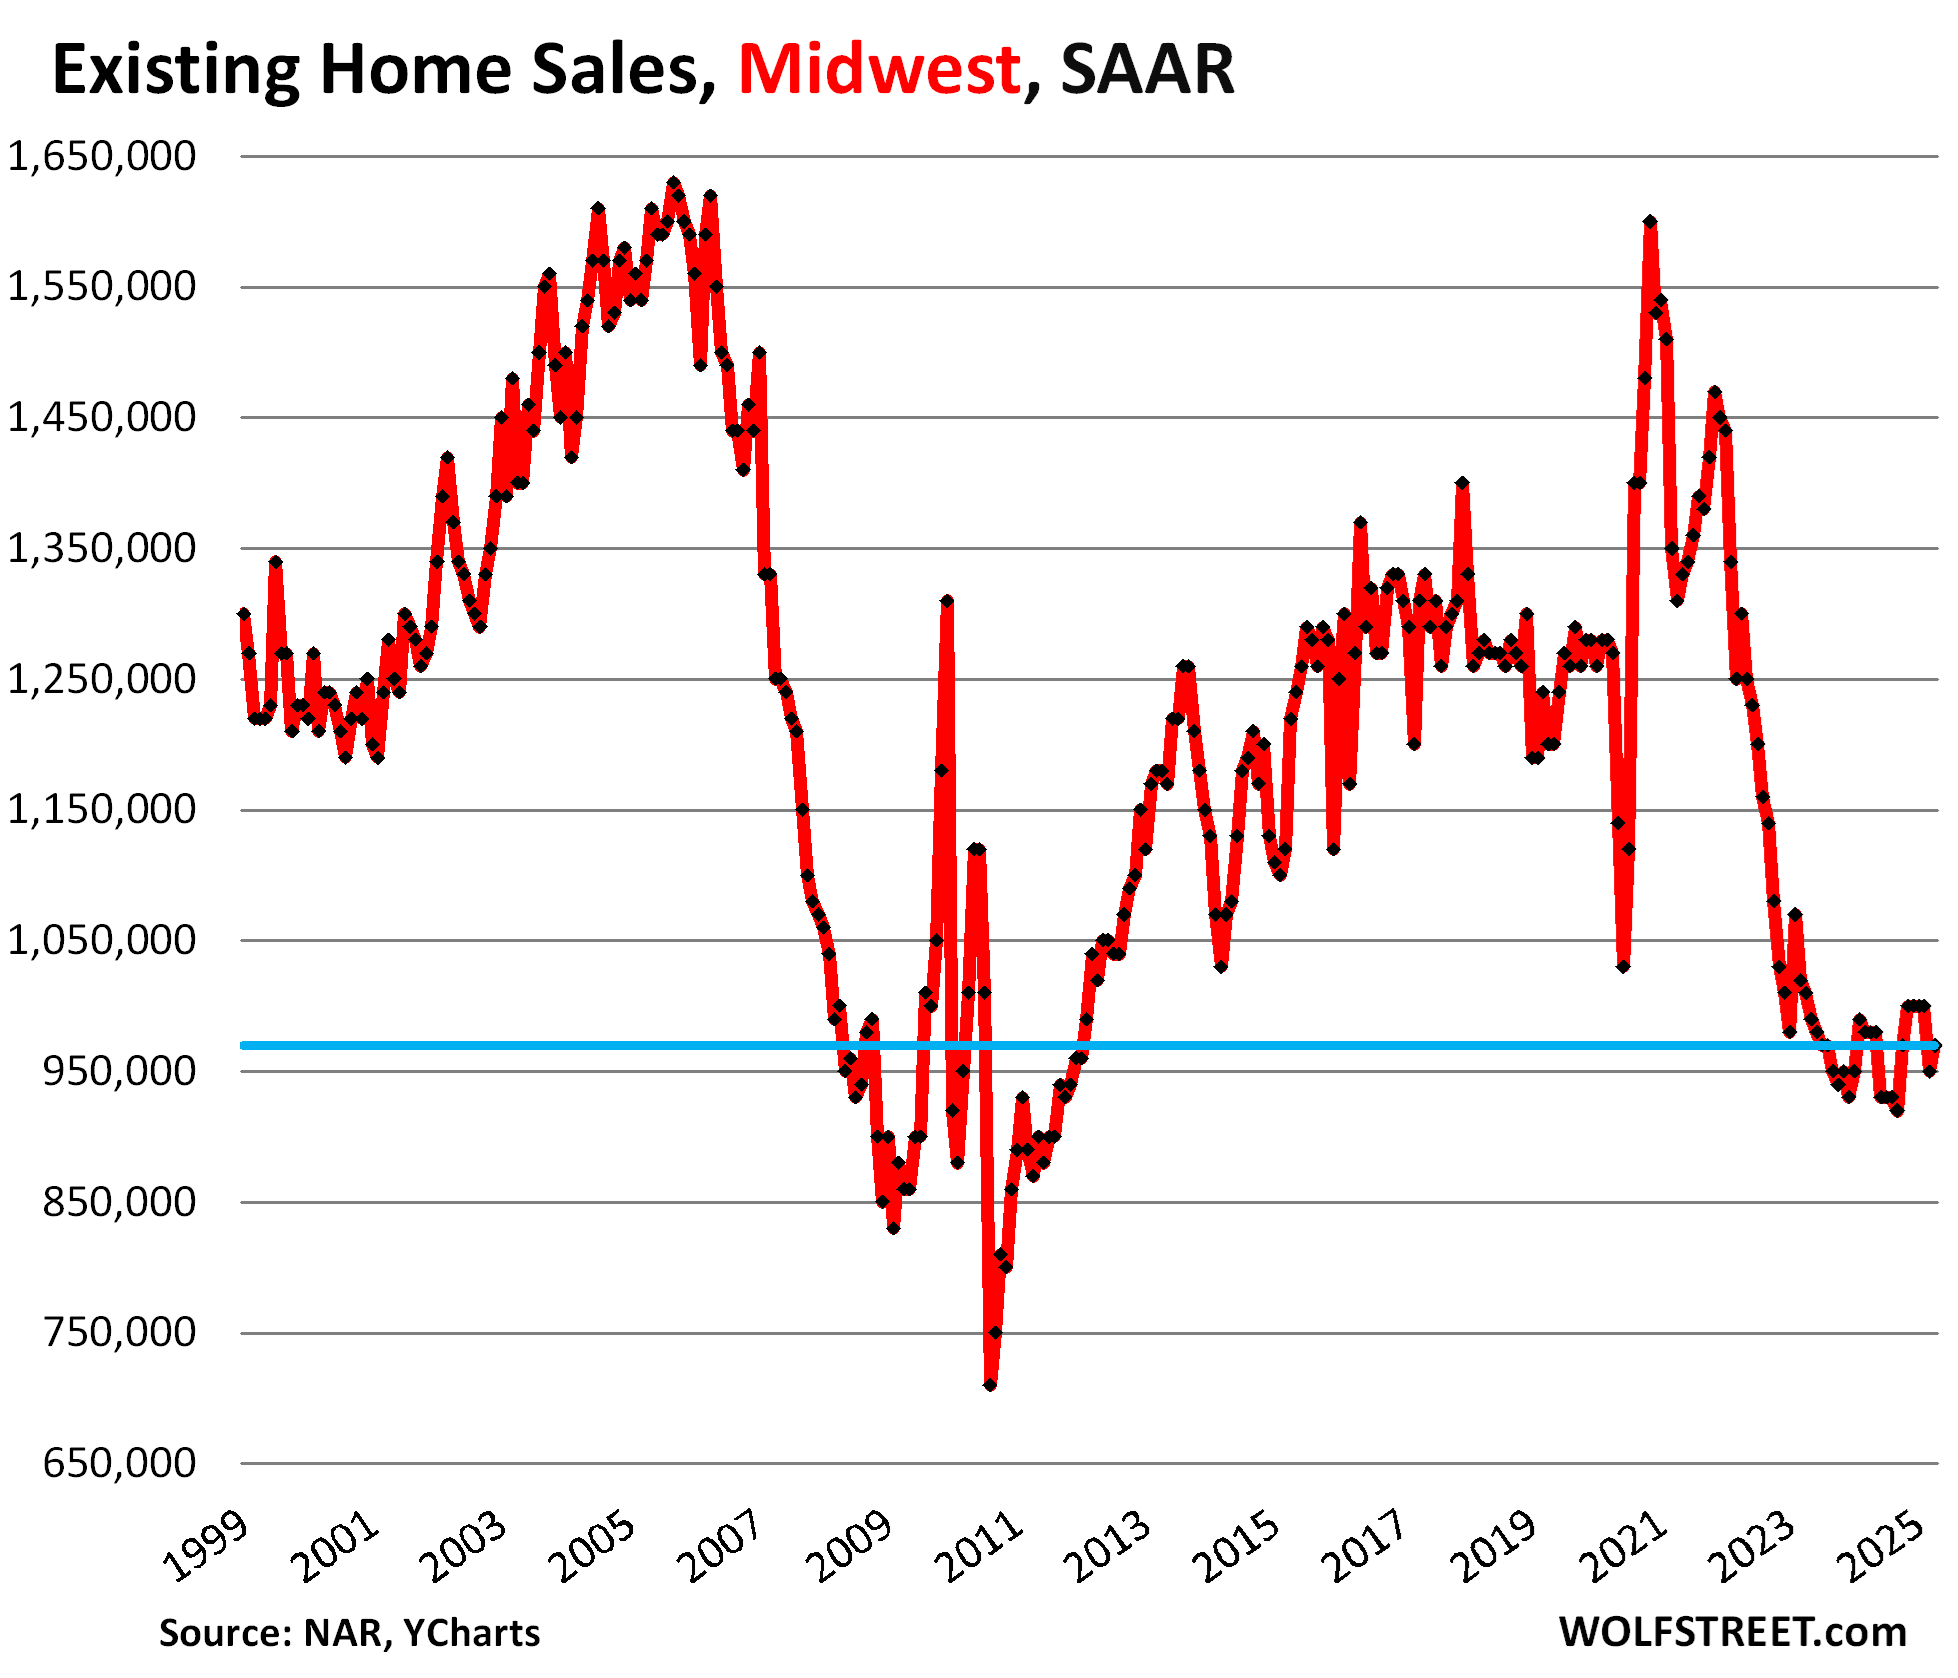
In the Midwest, sales rose to 970,000 homes SAAR, the worst April since 2011.
| Sales in the Midwest, compared to April in: | |
| 2024 | -1.0% |
| 2023 | -4.0% |
| 2022 | -25.4% |
| 2019 | -19.2% |
| 2018 | -24.2% |
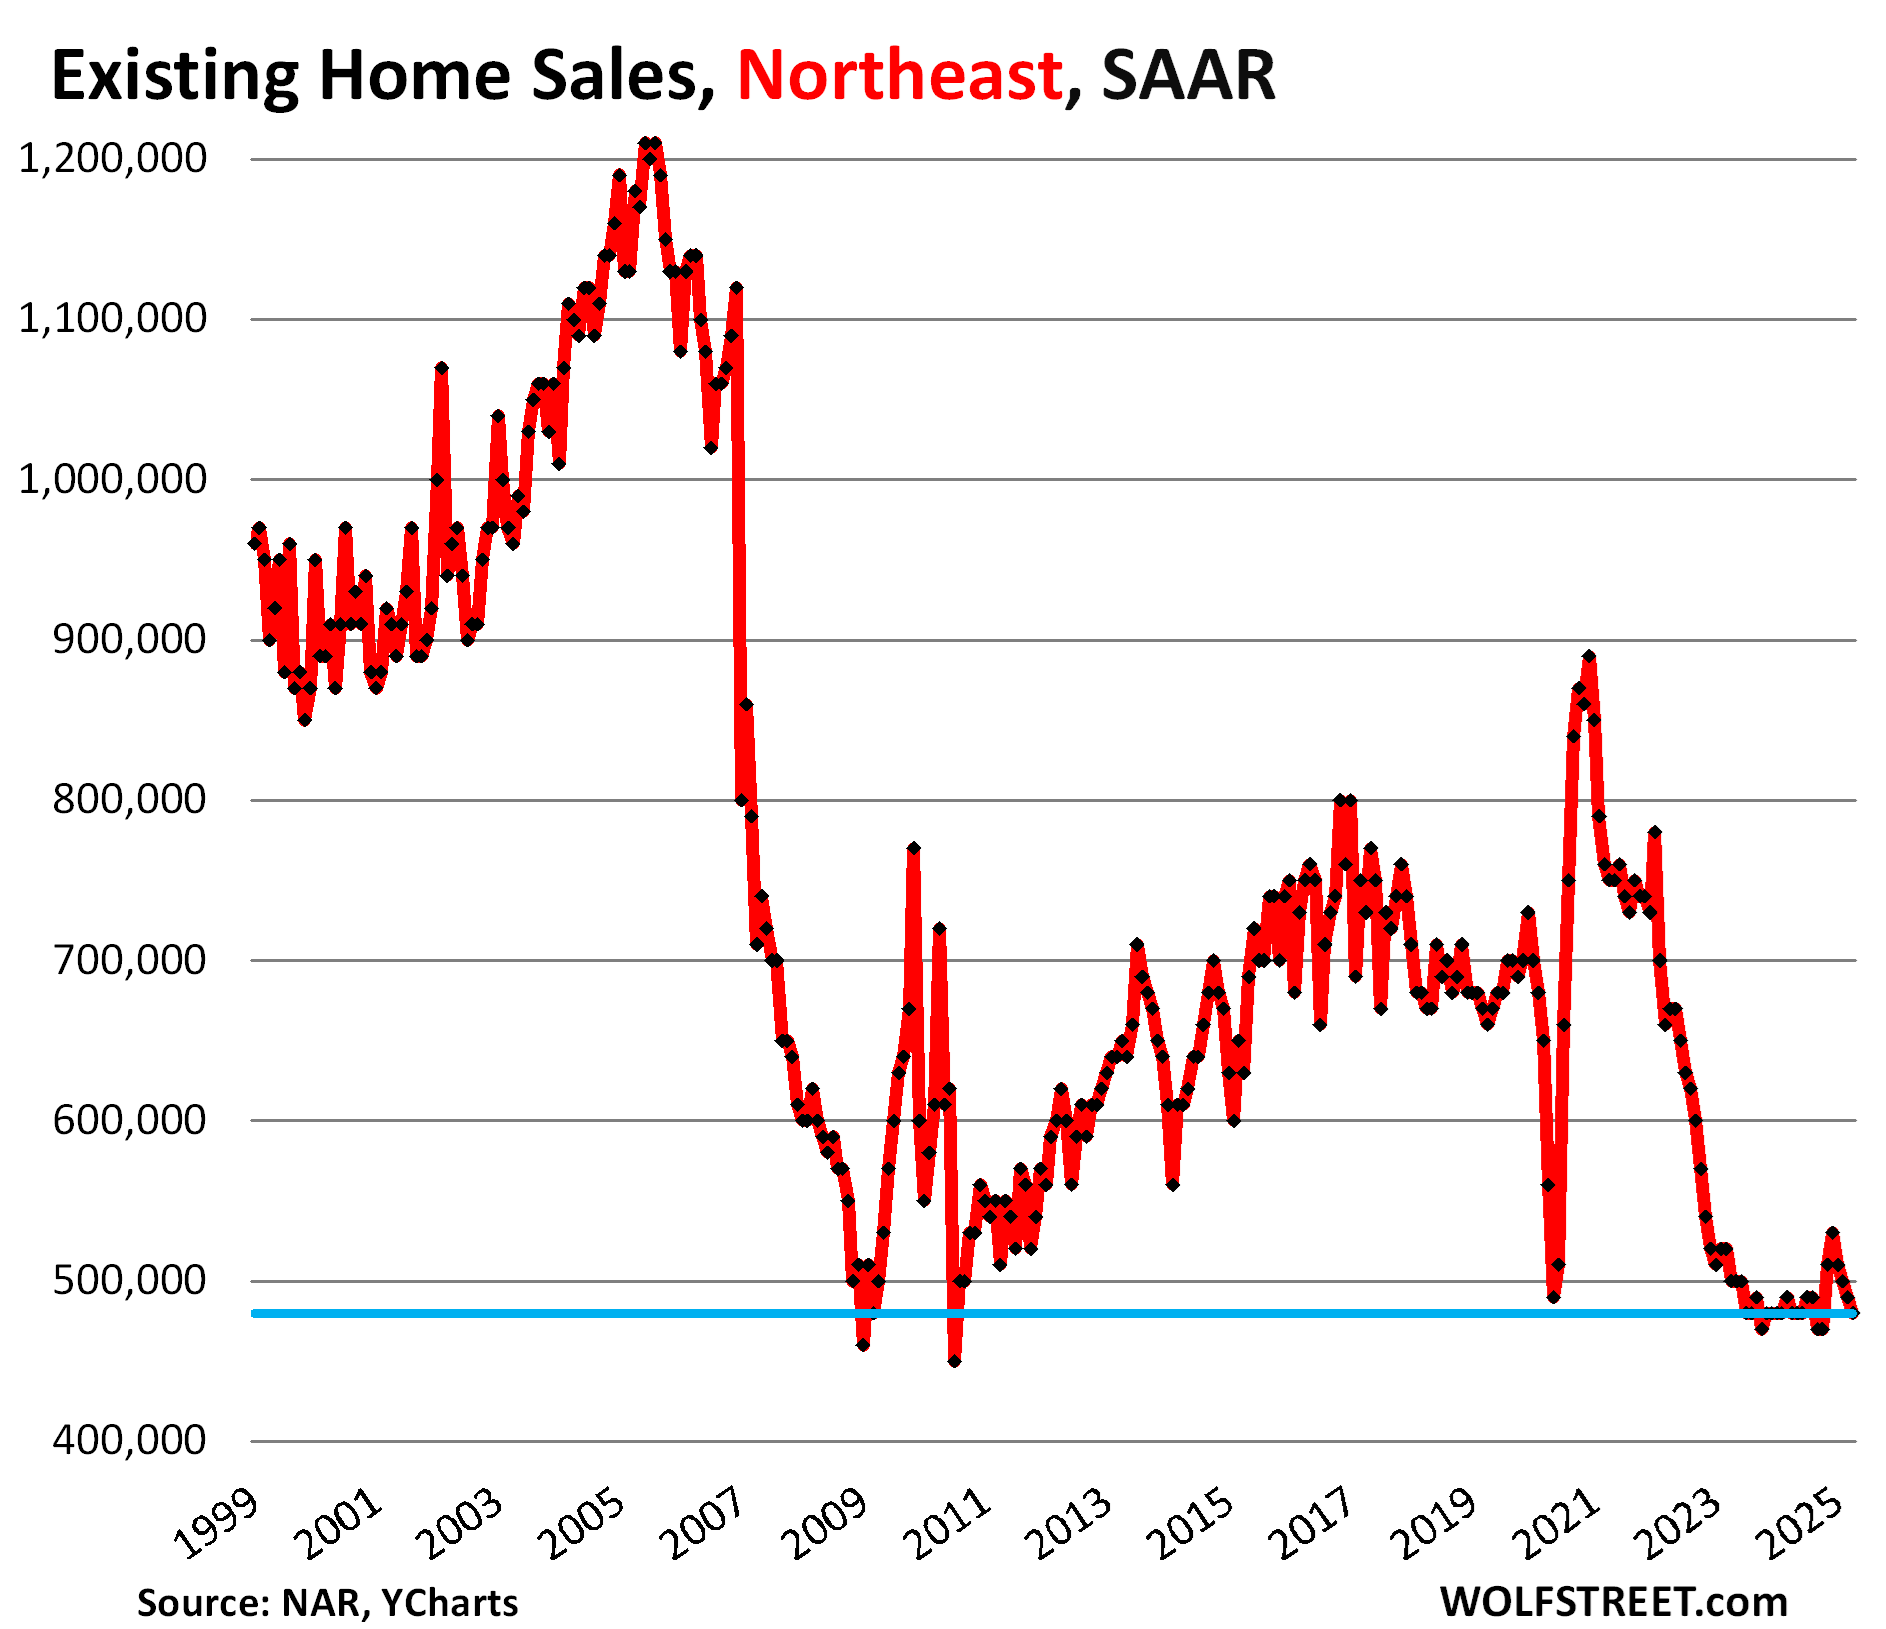
In the Northeast, sales dipped to 480,000 homes SAAR in April, same as in April 2024, both the worst Aprils since the 1990s.
| Sales in the Northeast, compared to April in: | |
| 2024 | 0.0% |
| 2023 | -4.0% |
| 2022 | -28.4% |
| 2019 | -27.3% |
| 2018 | -28.4% |
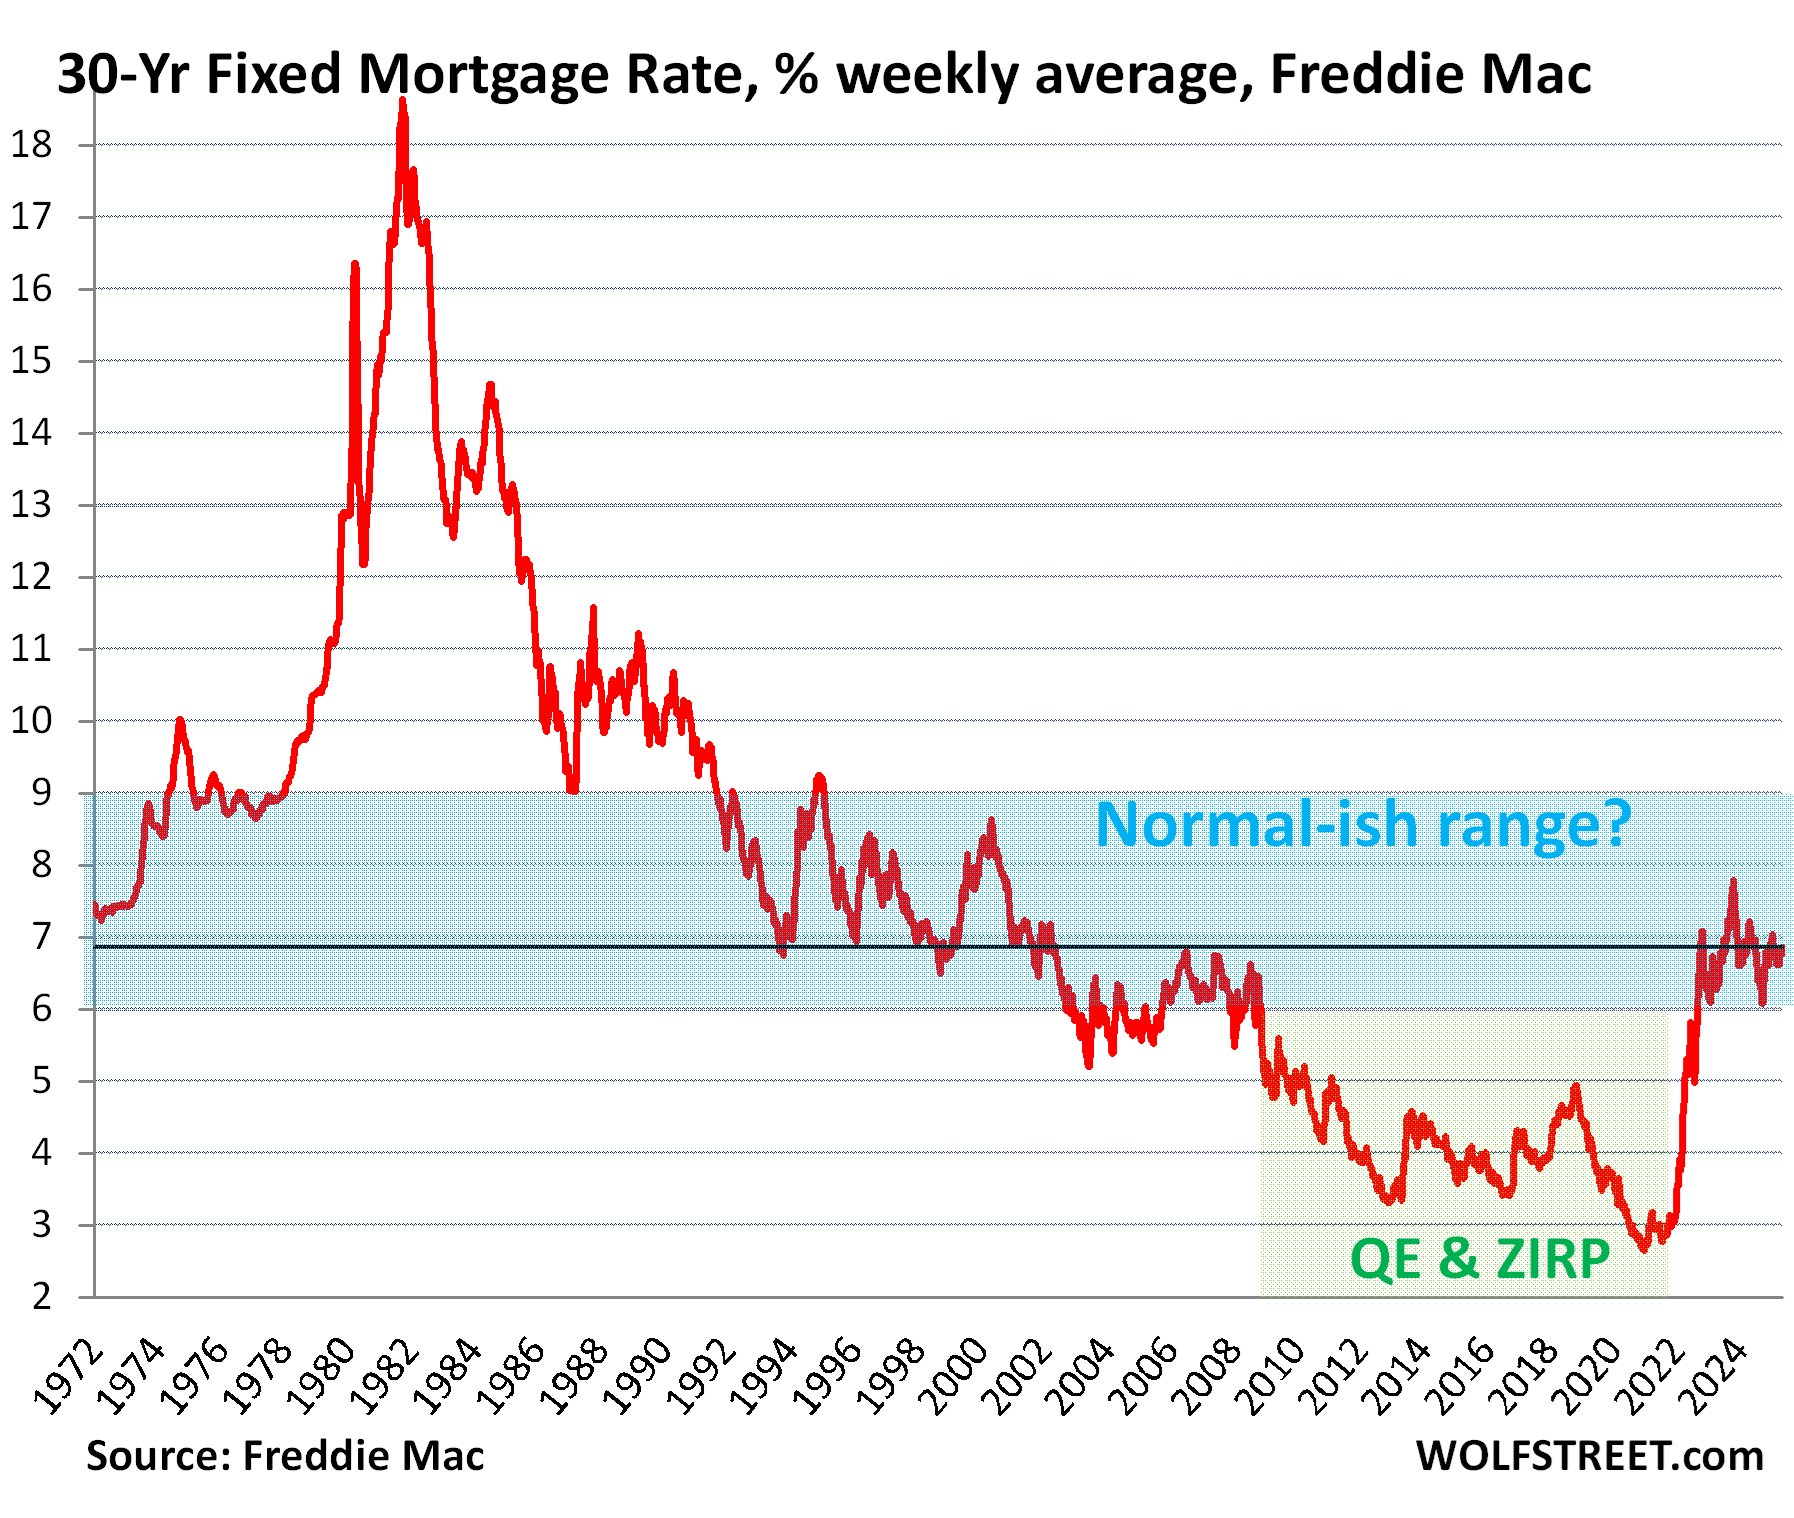
Mortgage rates are in the historically normal-ish range.
The average 30-year fixed mortgage rate ticked up to 6.86% in the latest reporting week, according to Freddie Mac today. This measure of mortgage rates has been between 6% and 8% since the fall of 2022, and most of the time just above or below 7%.
Historically – with exception of the outlier period of interest-rate repression by the Fed through QE that started with the Financial Crisis – these rates are roughly normal-ish.
The housing industry obviously loved the Fed’s interest-rate repression because it caused home prices to explode, and so the industry blames the historically normal-ish mortgage rates for the plunge in sales without blaming the ridiculously inflated prices that the ultra-low mortgage rates produced and that are now far higher than the market can bear.
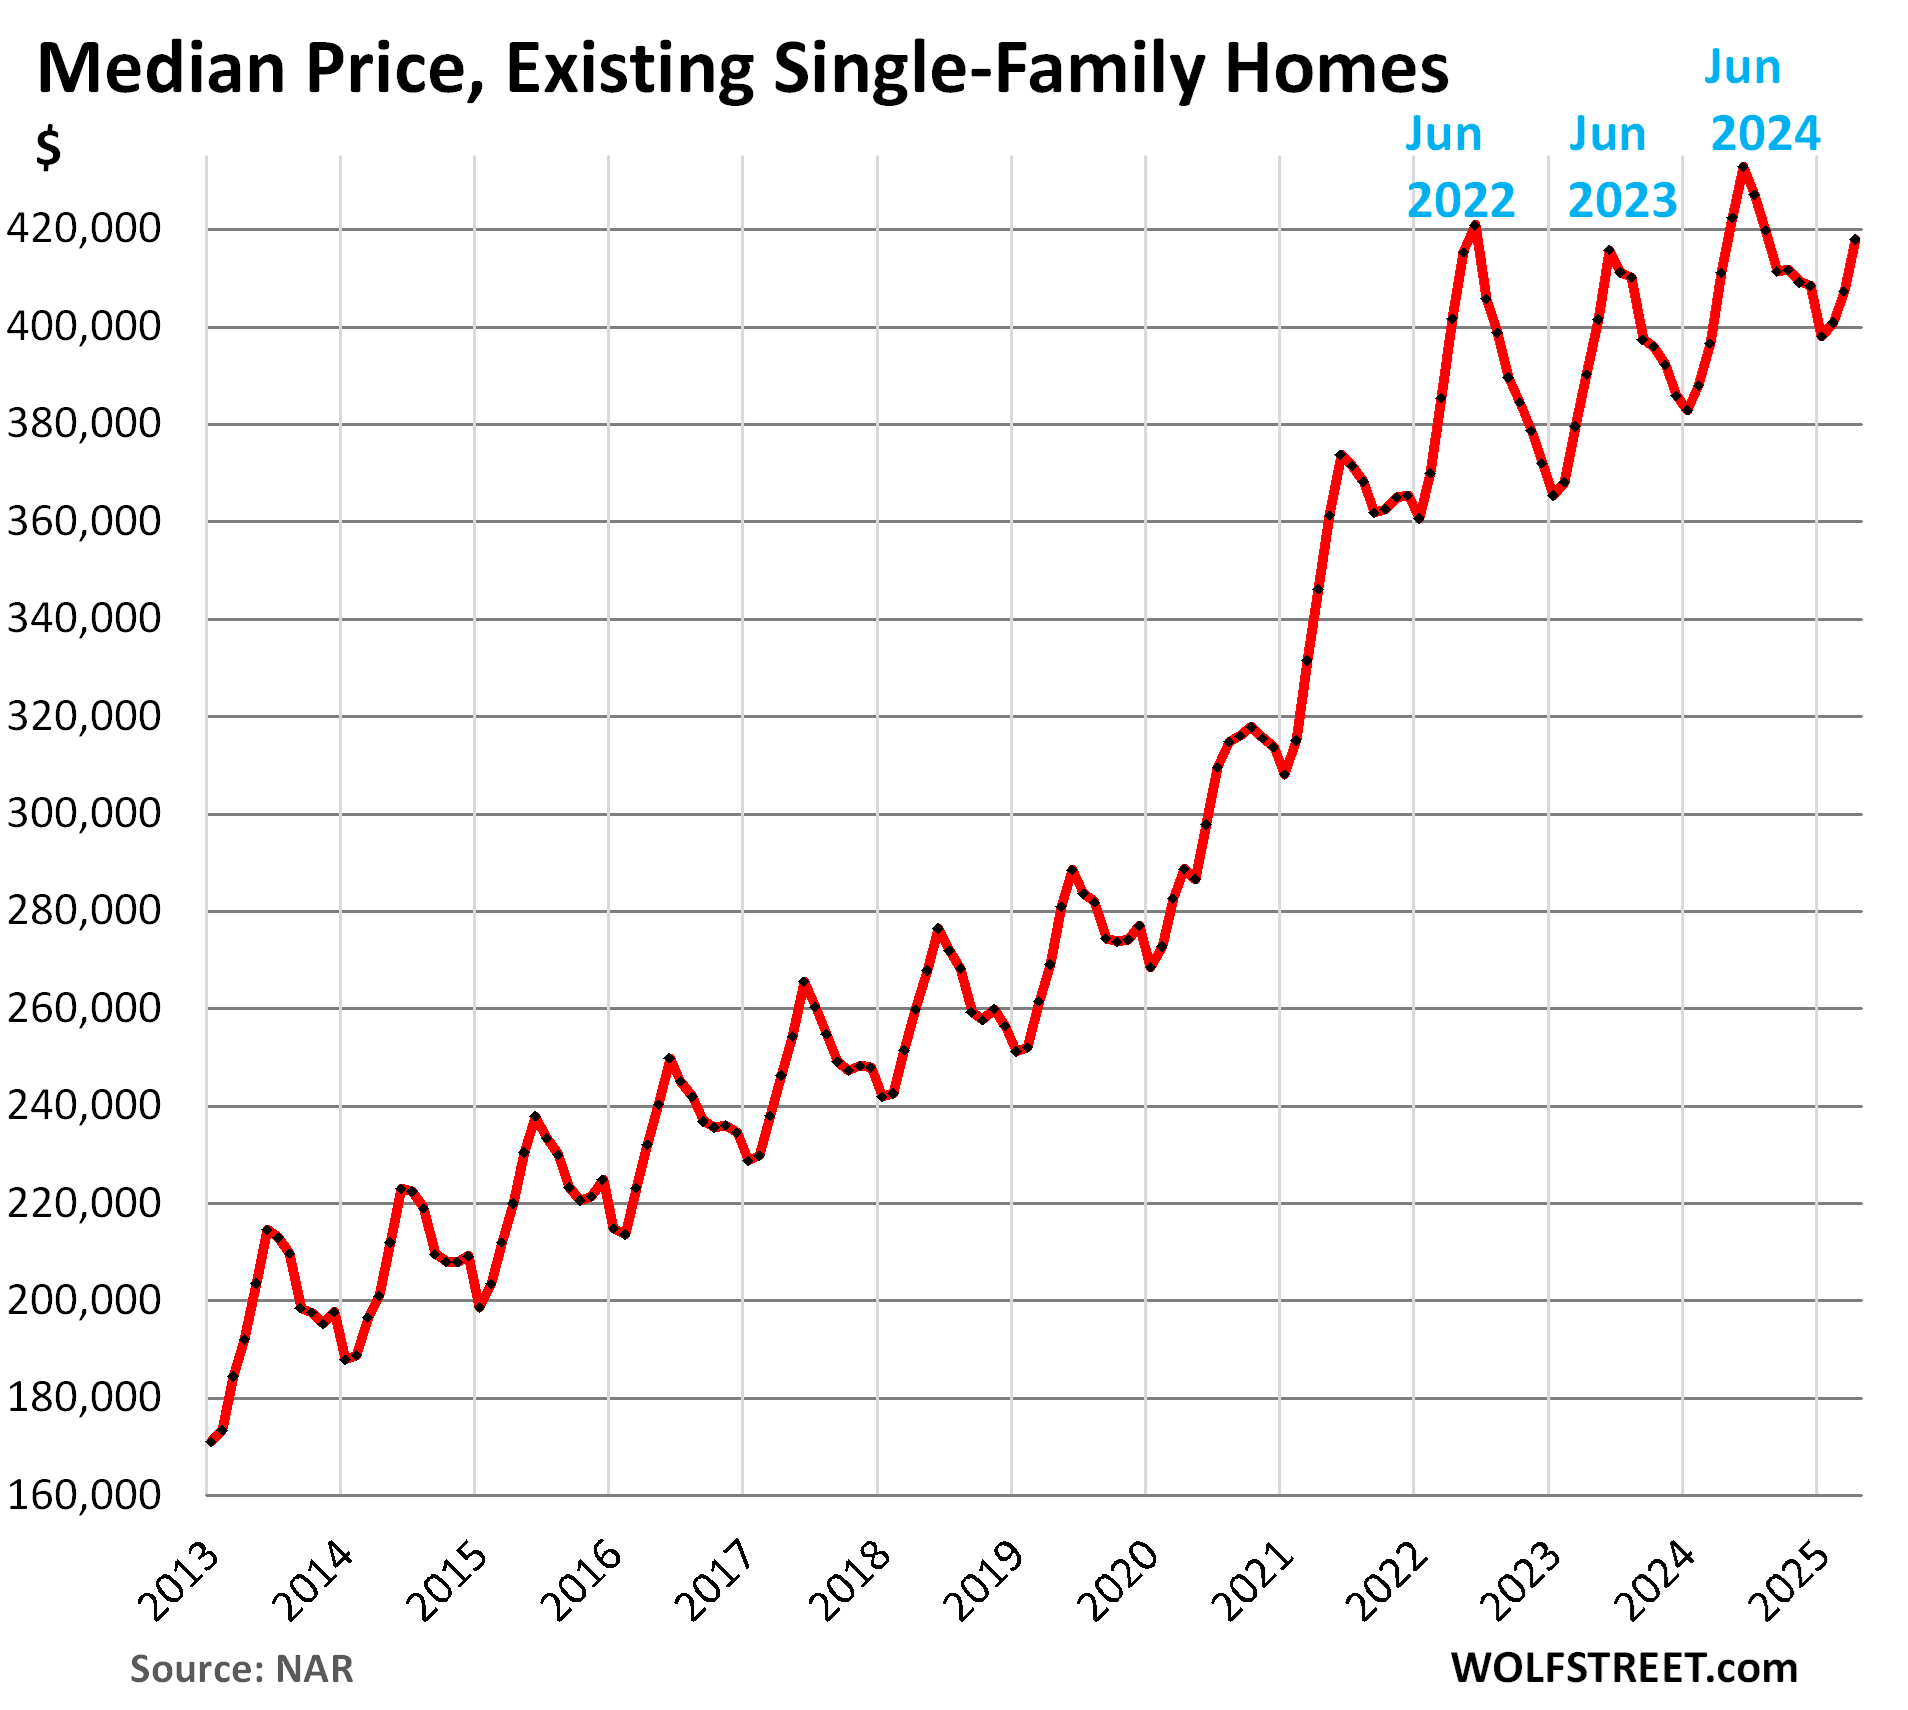
Median price for single-family homes and condos.
The median price can be heavily skewed by changes in the mix of homes that sold. In the spring, nationally, more higher-end homes come on the market and sell, which changes the mix of what sold and shifts the median price higher. It does the reverse in the fall and winter and shifts the median price lower. Hence the seasonal ups and downs in median prices.
Single-family homes: The national median price rose to $418,000 in April, whittling the year-over-year increase down further to just 1.7%, the fourth month in a row of narrowing year-over-year increases (from +5.9% in December).
This measure of the national median price had exploded by 50% in the three years between June 2019 and June 2022, on top of the large price gains in the prior 10 years, driven by the Fed’s interest-rate repression. Now prices are simply way too high and don’t make economic sense. Textbook demand destruction has ensued.
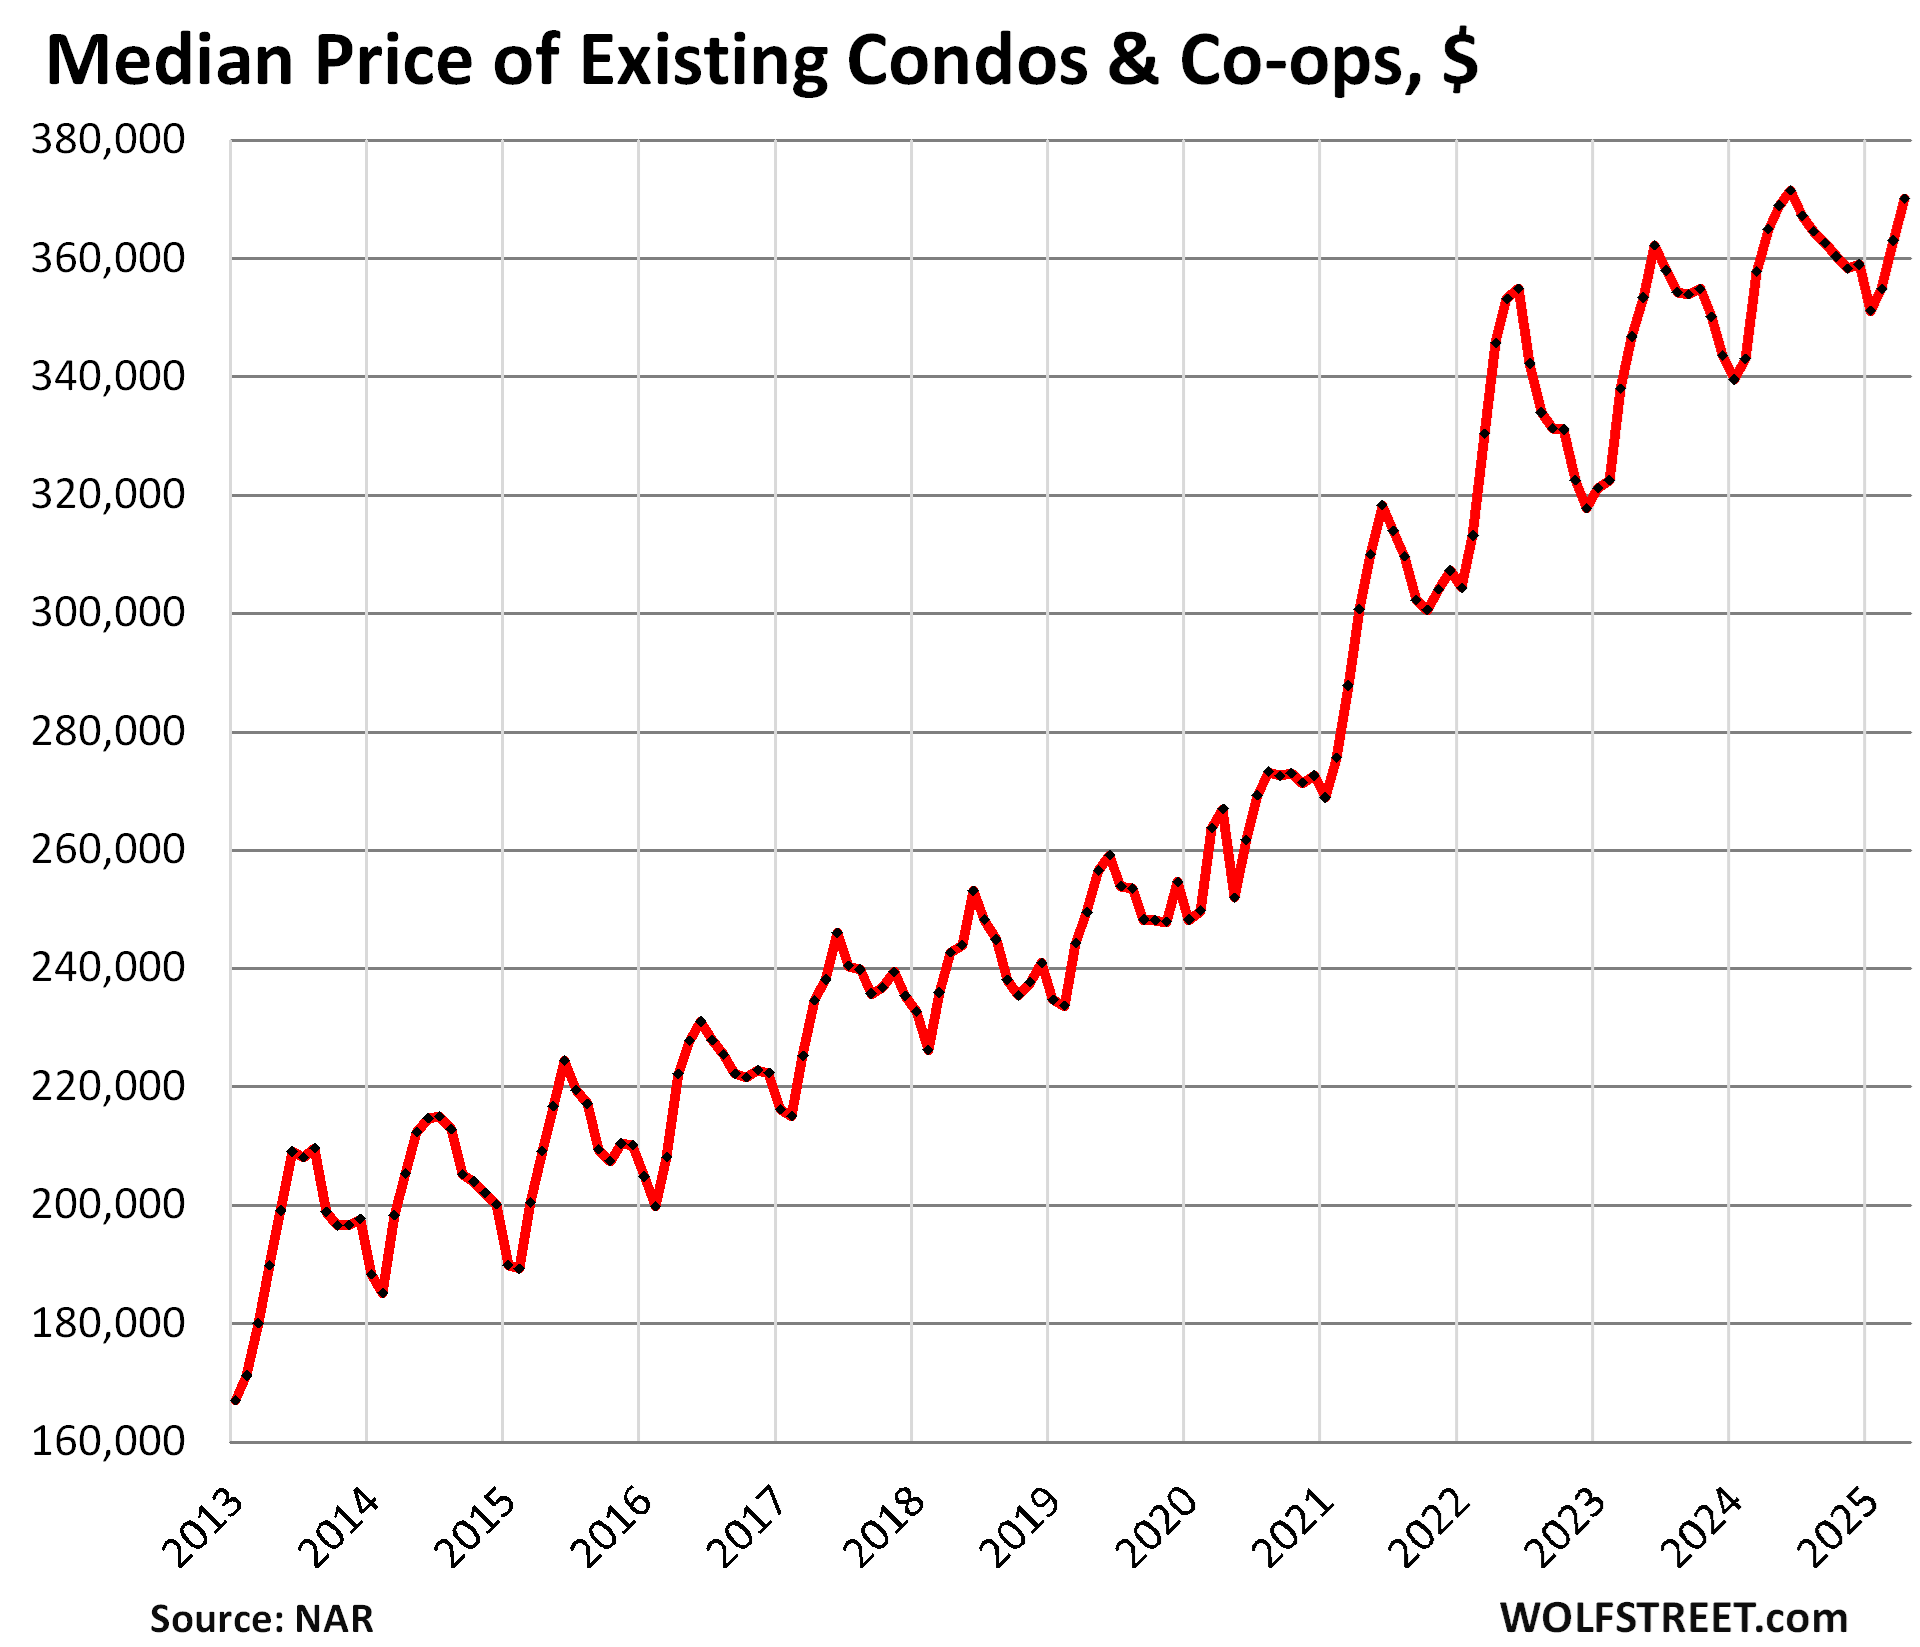
Condos and co-ops. The national median price rose to $370,000 in April, which whittled down the year-over-year gain to 1.4%, the fourth month in a row of narrowing year-over-year gains (from +4.5% in December).
But every market has its own dynamics. Some have significant price drops, others are still booking gains. I track home prices in the largest and most expensive 33 markets, quite a few of which are seeing home prices substantially below their peaks in mid-2022: The Most Splendid Housing Bubbles in America, April 2025: The Price Drops & Gains in 33 of the Largest Housing Markets
Enjoy reading WOLF STREET and want to support it? You can donate. I appreciate it immensely. Click on the mug to find out how:

![]()
The post Spring Selling Season Fizzles, Worst April for Home Sales since 2009, Supply Surges to Highest since 2016, YoY Price Gains Fade appeared first on Energy News Beat.
“}]]
Energy News Beat