[[{“value”:”
Homebuilders get more aggressive to sell the inventory, but prices are still far too high.
By Wolf Richter for WOLF STREET.
Despite huge inventories of new houses for sale, including completed houses, homebuilders have continued to build homes at an aggressive pace. Some of the big homebuilders, such as Lennar, have cut prices and thrown large incentives on the market, and their sales increased; while other homebuilders, such as PulteGroup, have been less aggressive on pricing and incentives, and their sales fell.
That kind of mix seen in Q1 earnings reports is also what the data from the Census Bureau today show: Inventories for sale are sky high, even of completed spec homes, but sales overall grew and were decent, while prices continue to wobble lower.
Single-family houses for sale at all stages of construction in March remained at 493,000 houses, roughly unchanged for the fifth month in a row, up by 8.4% from the bloated levels a year ago, and up by 49% from March 2019. All five months were the highest since November 2007. Inventories reached this level for the first time in October 2005, on the eve of the Housing Bust when oversupply and lack of demand nearly wiped out the homebuilders.
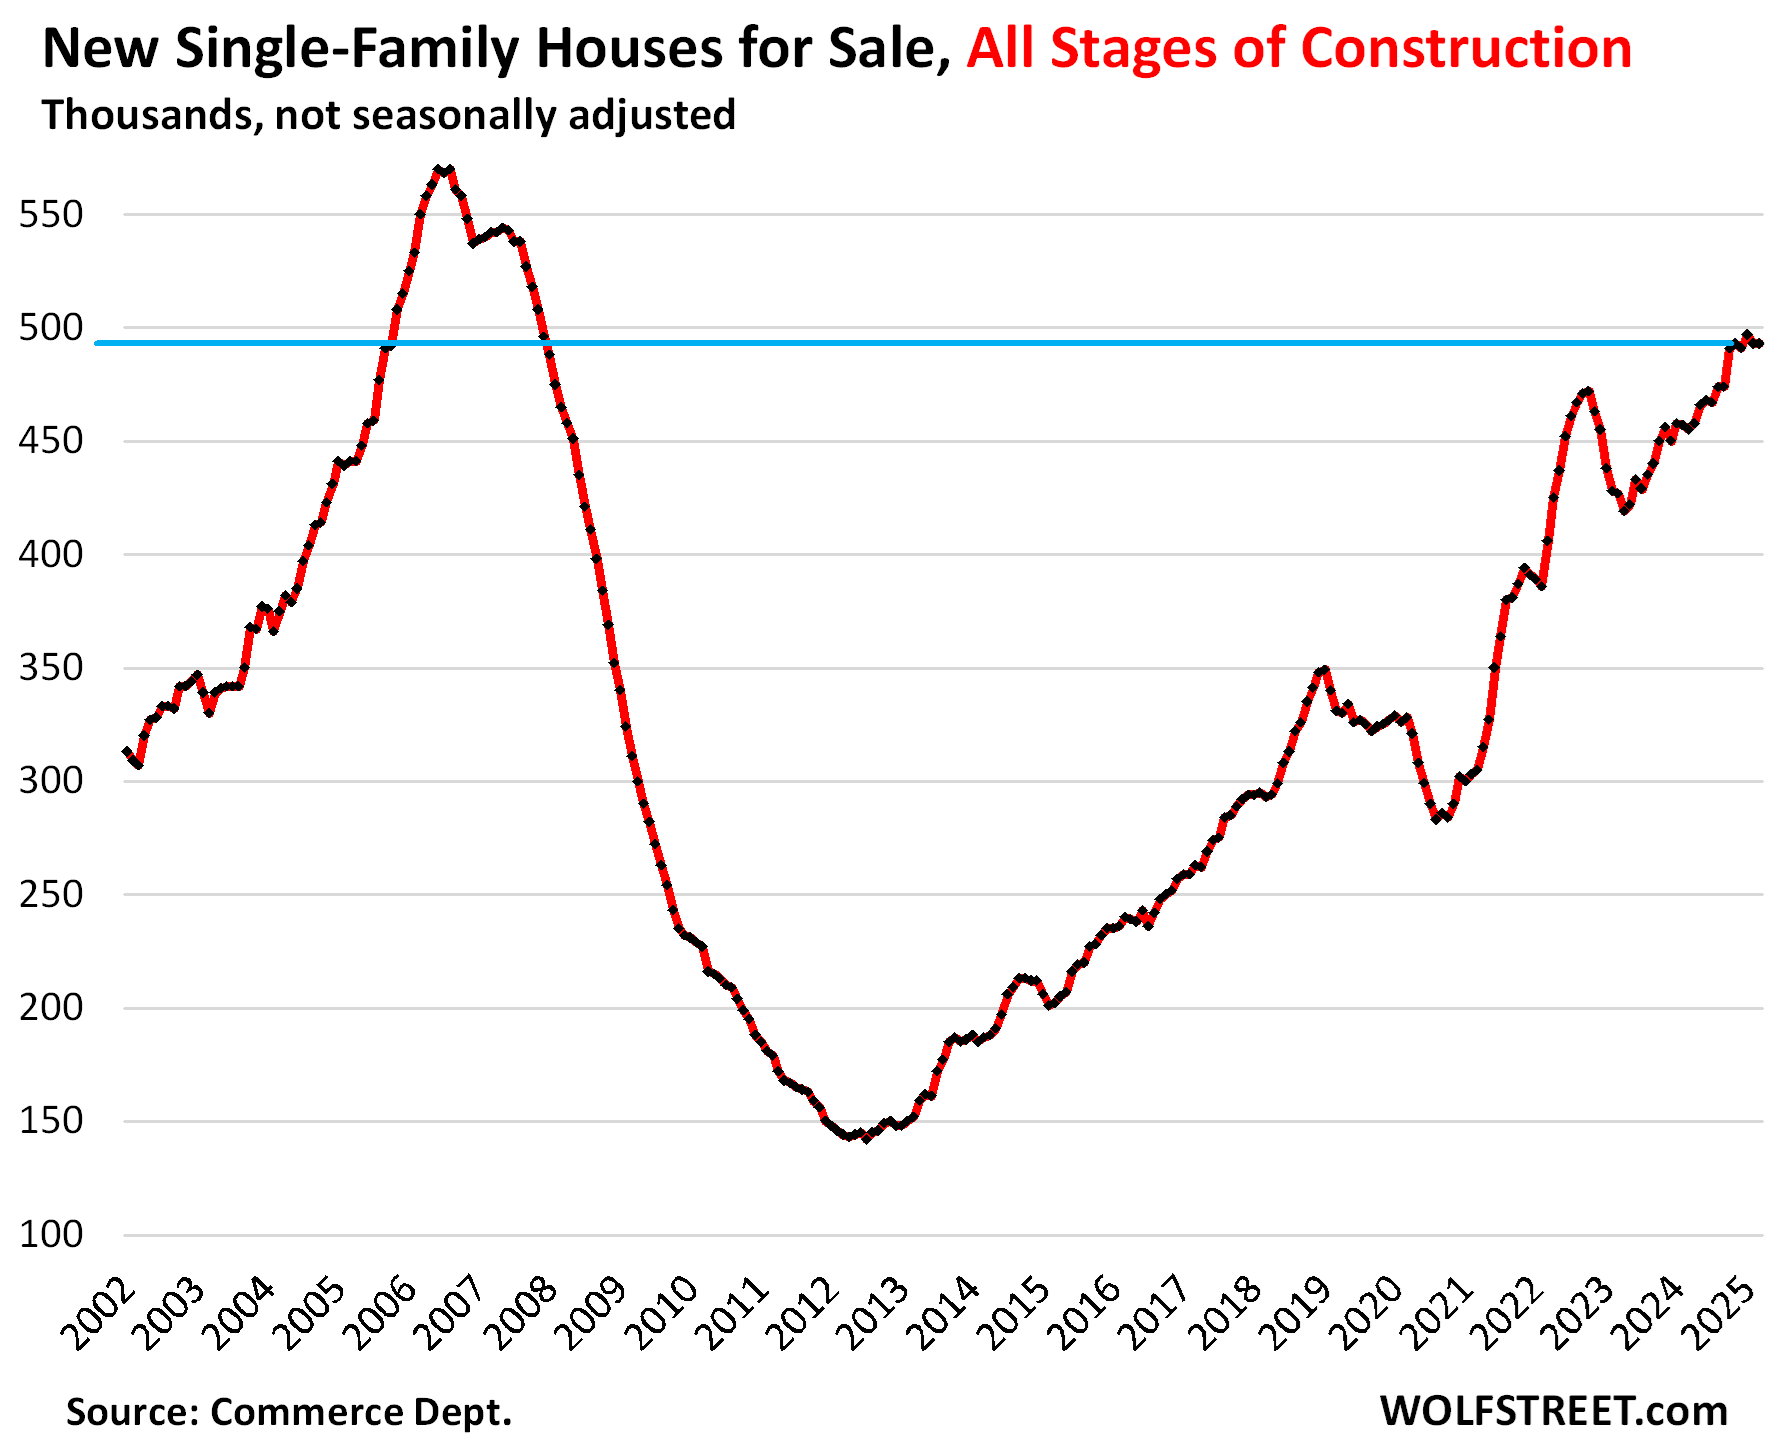
Bring on the supply! A glut of new houses on the market is exactly what this overpriced housing market needs. And lower prices will bring out more buyers.
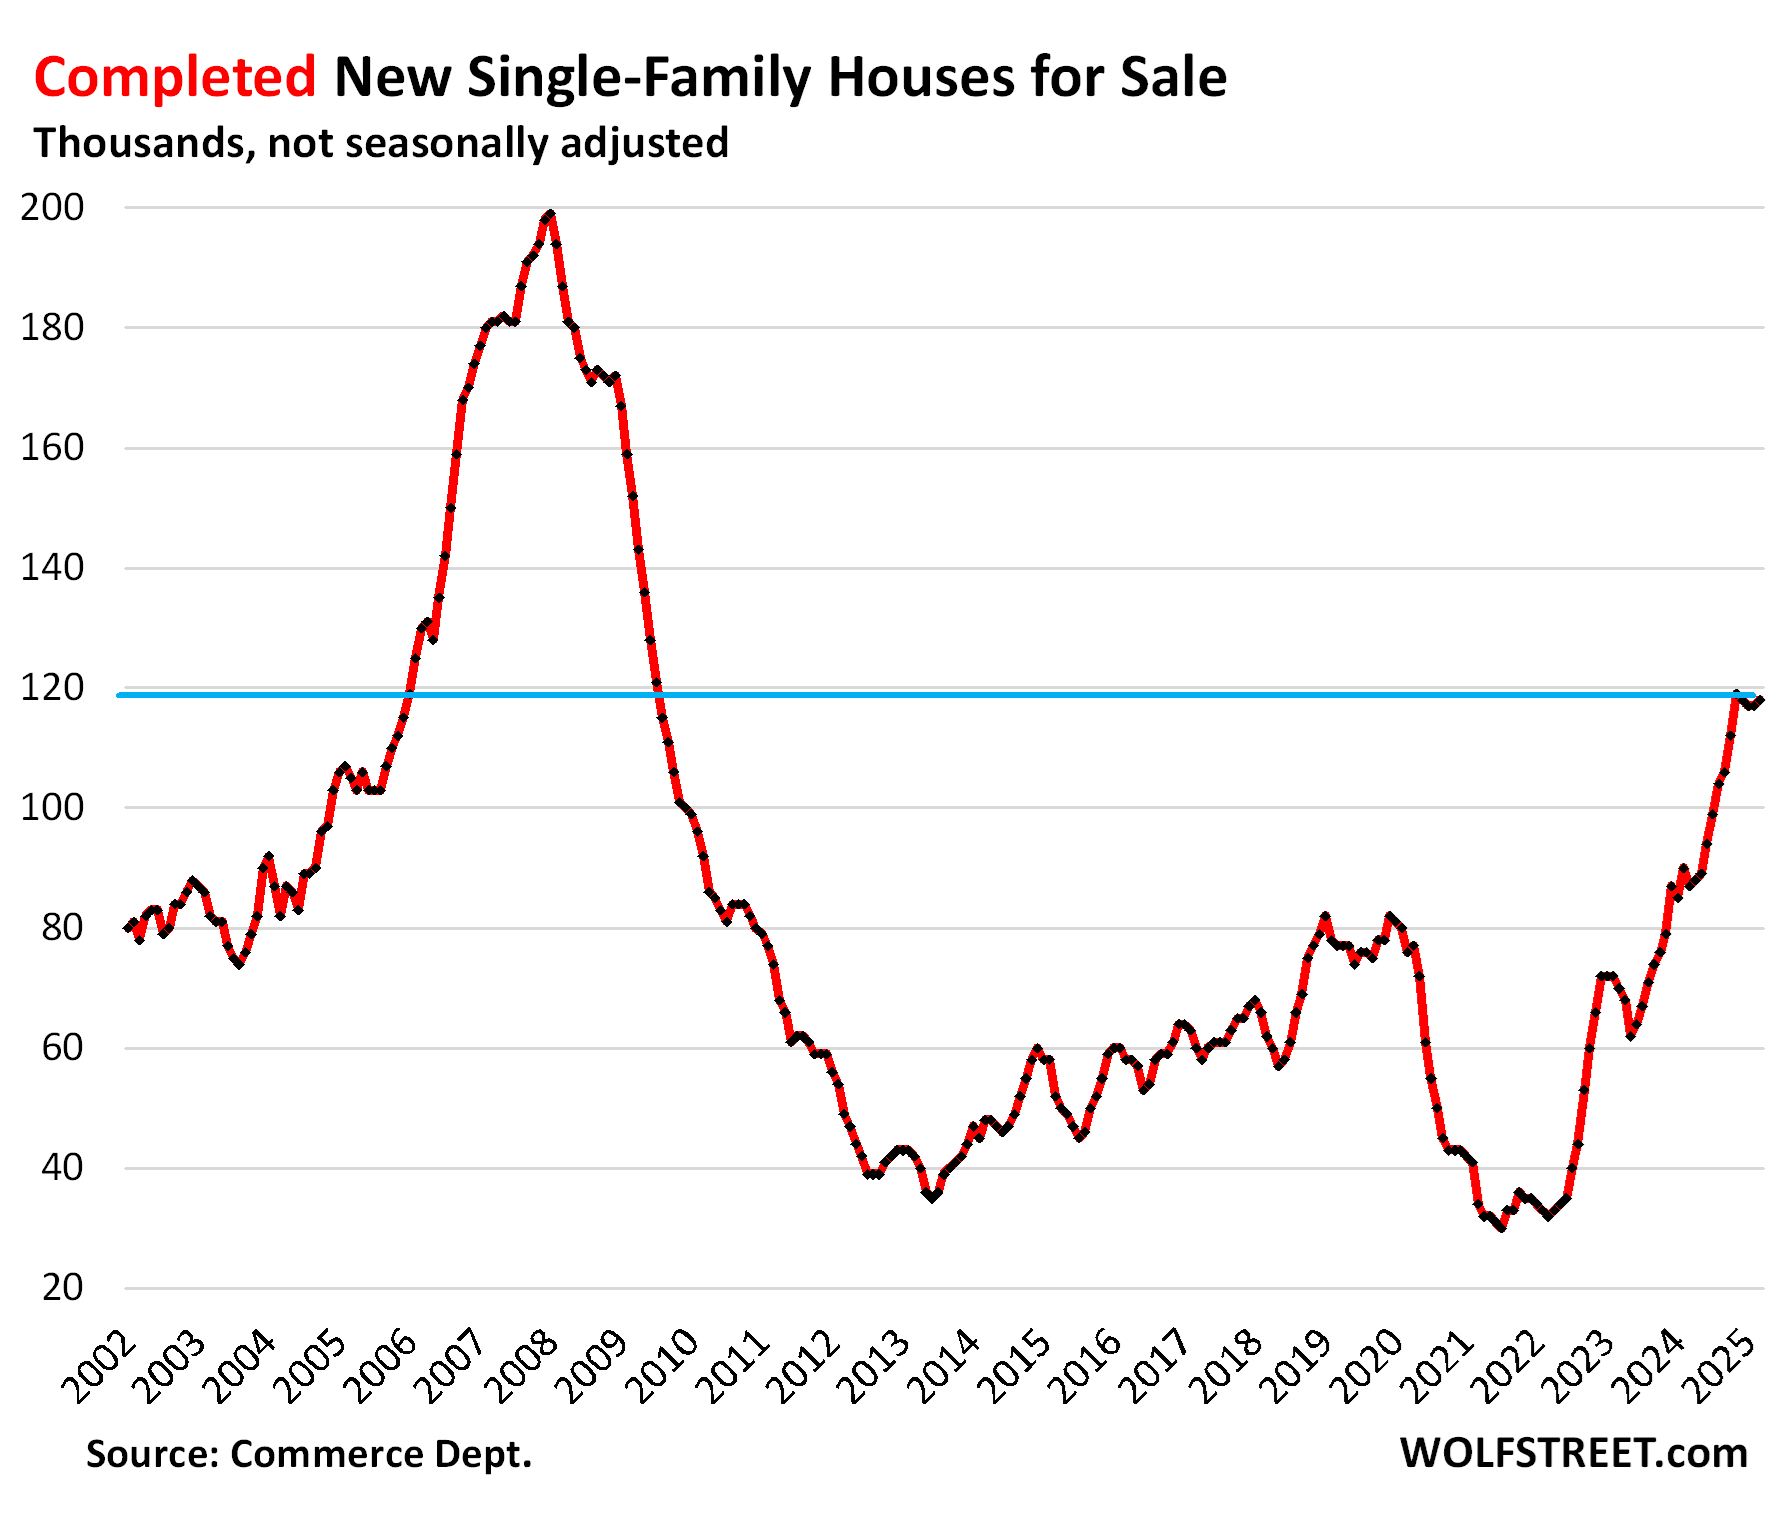
Inventories of completed new single-family houses for sale ticked up for the month and jumped by 36% year-over-year, and by 53% from March 2019, to 118,000 houses, roughly where inventories had been in January 2006, on the eve of the Housing Bust.
Homebuilders are motivated to sell spec houses quickly because they’ve sunk a lot of capital into them.
The homebuilders in Q1…
The publicly traded homebuilders have been shedding some light on how they’re dealing with this market, and their shares have zigzagged down from their highs in September, for example: DR Horton [DHI] -36%, Lennar [LEN] -39%, KB Home [KBH] -40%, and PulteGroup [PHM] -32%.
Lennar is an example of a builder that’s using lower prices and bigger incentives to increase sales, while sacrificing some of its profit margin. In Q1, year-over-year, according to its 10-Q filing on April 4:
- Average selling price (does not include costs of mortgage-rate buydowns): -1.2% to $408,000 “primarily due to continued weakness in the market.”
- Number of homes delivered: +6.2%, to 17,834 homes.
- Revenues from home sales: +5.1%.
- Gross margins: 18.7% compared to 21.8% a year ago.
“Gross margins decreased due to an increase in land costs year over year, as well as a decrease in revenue per square foot, which was partially offset by a decrease in construction costs as we continue to focus on construction cost savings,” Lennar said.
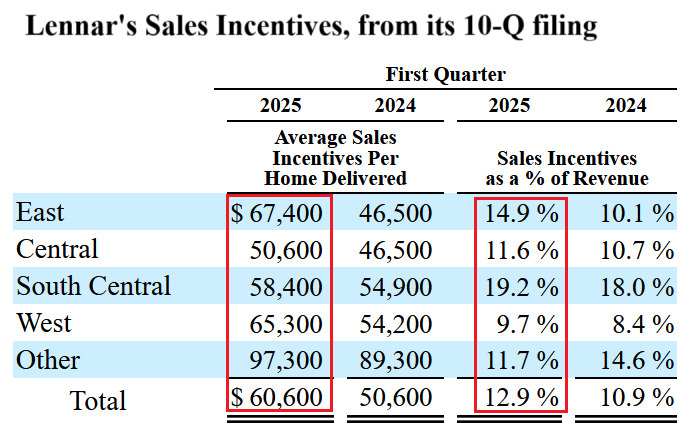
Lennar also lists its sales incentives per home sold by region. This includes the costs of mortgage-rate buydowns. Average incentives rose to $60,600 per home across the US, or 12.9% of the average selling price. These are huge incentives:
PulteGroup went the other way: higher prices, but lower unit sales, and lower revenues. It reported in its 10-Q filing on April 22:
- Average selling price: +6% to $570,000.
- Unit sales: -7.3% to 7,765 homes.
- Revenues from home sales: -1.8%.
- Gross margin 27.5% compared to 29.6% a year ago.
Homebuilders still have big-fat profit margins and net incomes — though they’ve come down — and have lots of room left to cut prices if the market forces them to before they start booking losses. For example, Lennar still booked $519 million in net income in Q1, though that’s down by 28% from $720 million a year ago. PulteGroup still booked $523 million in net income in Q1, though that’s down by 21% from $663 million a year ago. They’re not at the end of their rope of price cutting.
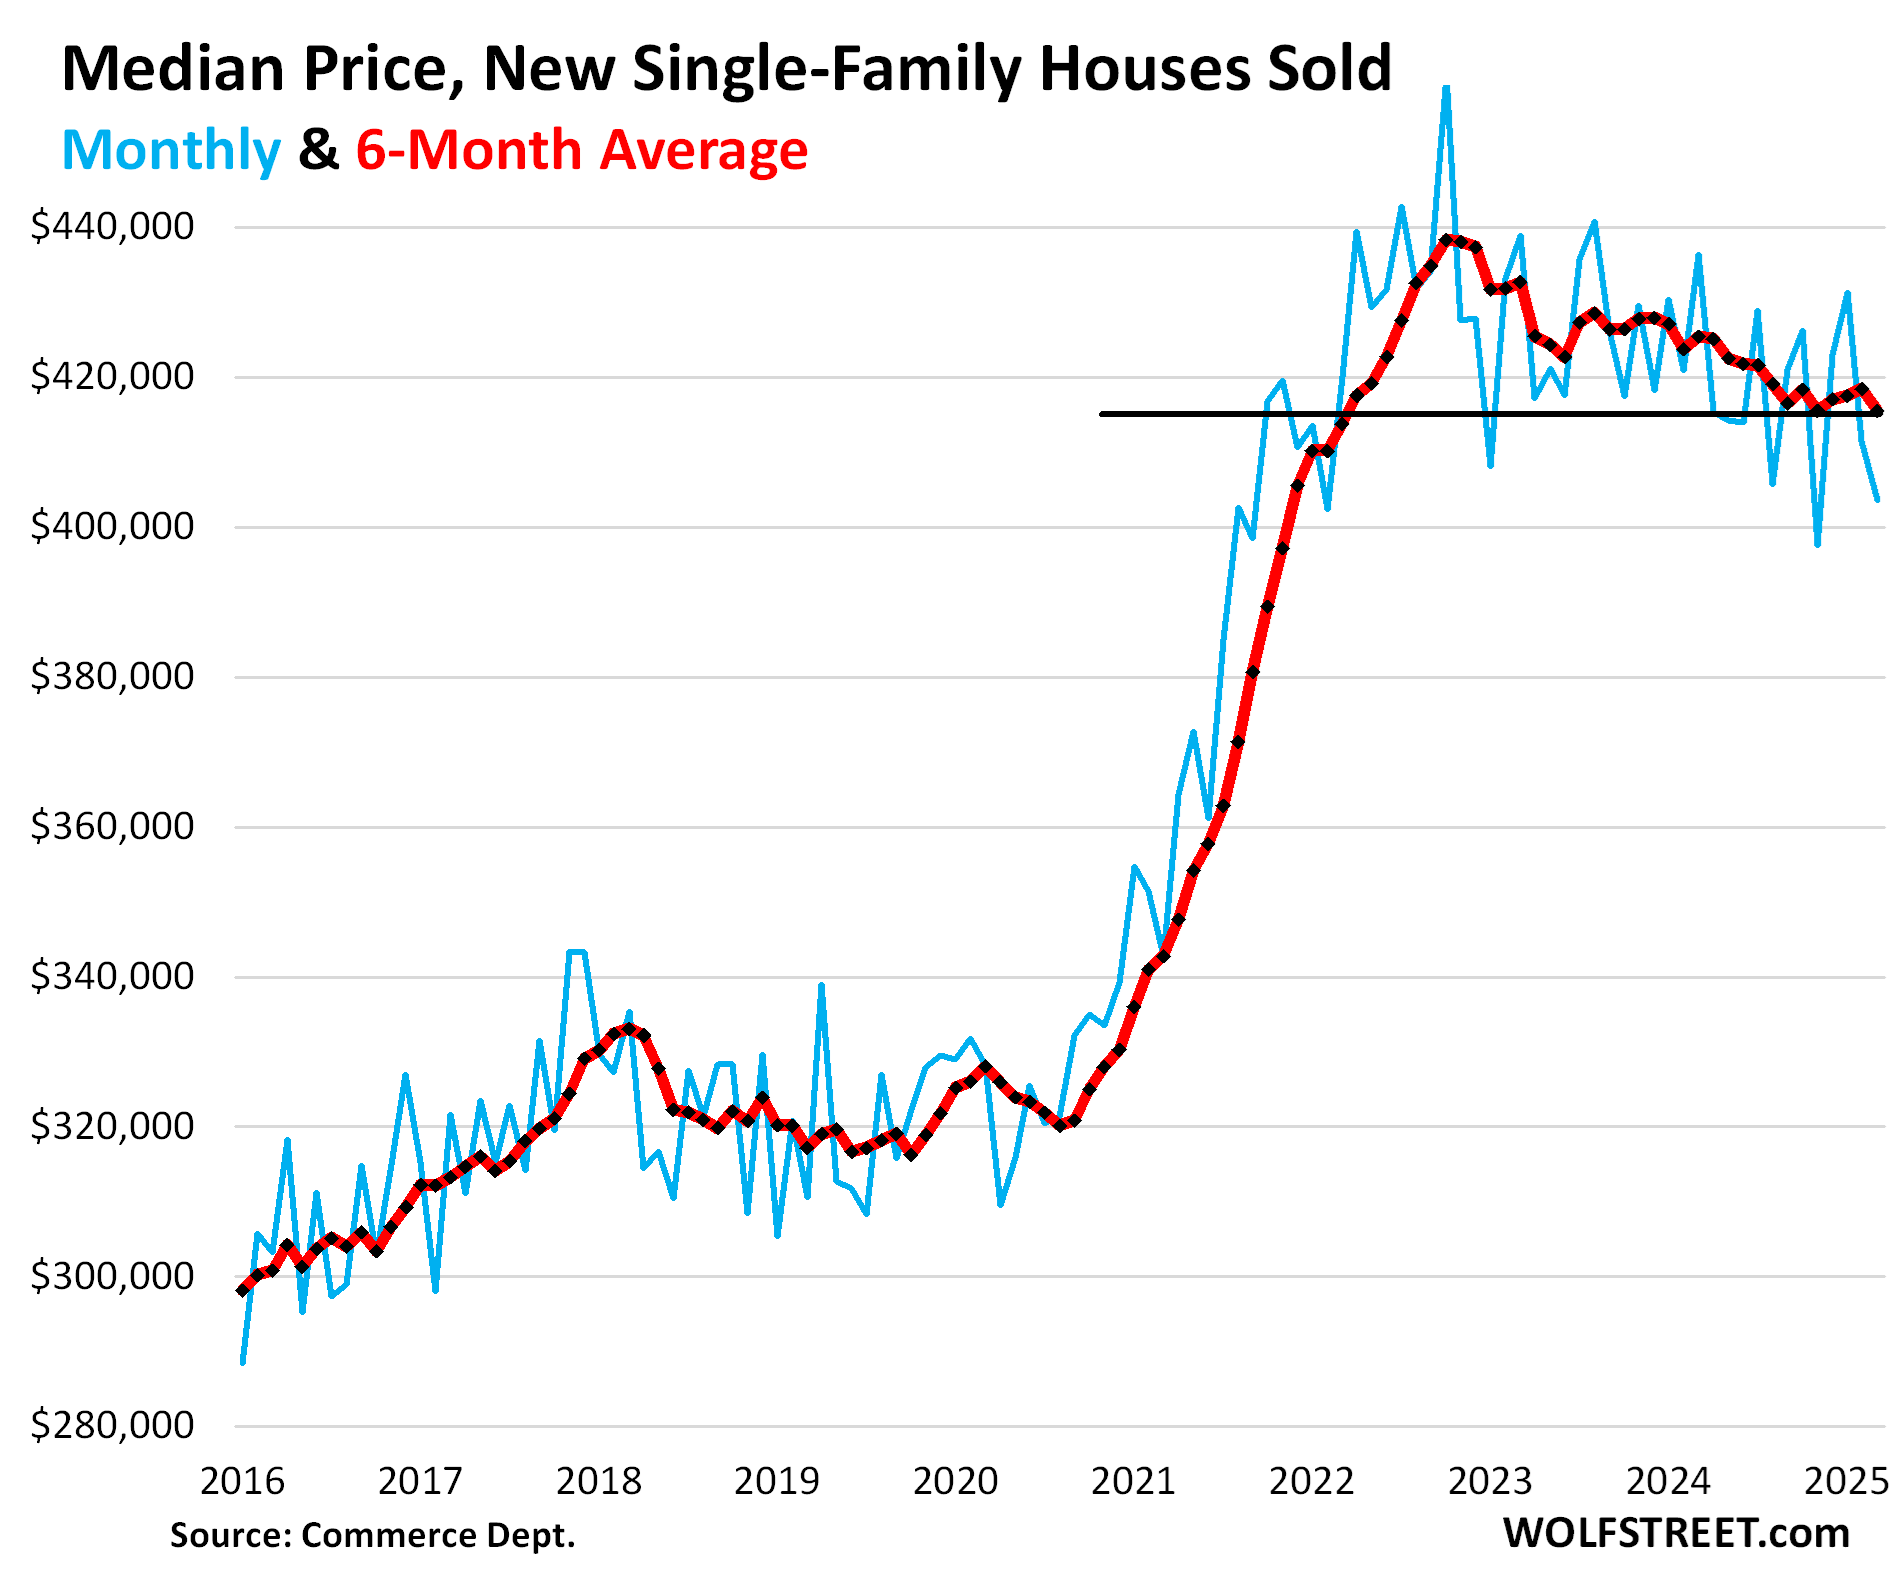
Overall prices continue to wobble lower.
The median contract price of new single-family houses at all stages of construction that sold in March fell to $403,600, down by 7.5% year-over-year, down by 8.0% from two years ago, and down by 12% from the peak in October 2022, according to the Census Bureau today (blue).
The six-month average, which irons out the random monthly ups and downs and includes the revisions, fell to $415,567, the lowest since March 2022 (red).
But these contract prices do not include the costs of the mortgage-rate buydowns and certain incentives, such as free upgrades. On the builders financial statement, some incentives show up in the price of the home sold, the remained, such as mortgage rate buydowns, is taken against its gross margin
Lennar’s breakout of incentives (see table above) sums the total costs of all incentives, including mortgage-rate buydowns that are not part of the contract prices reflected here.
Inventory for sale by region.
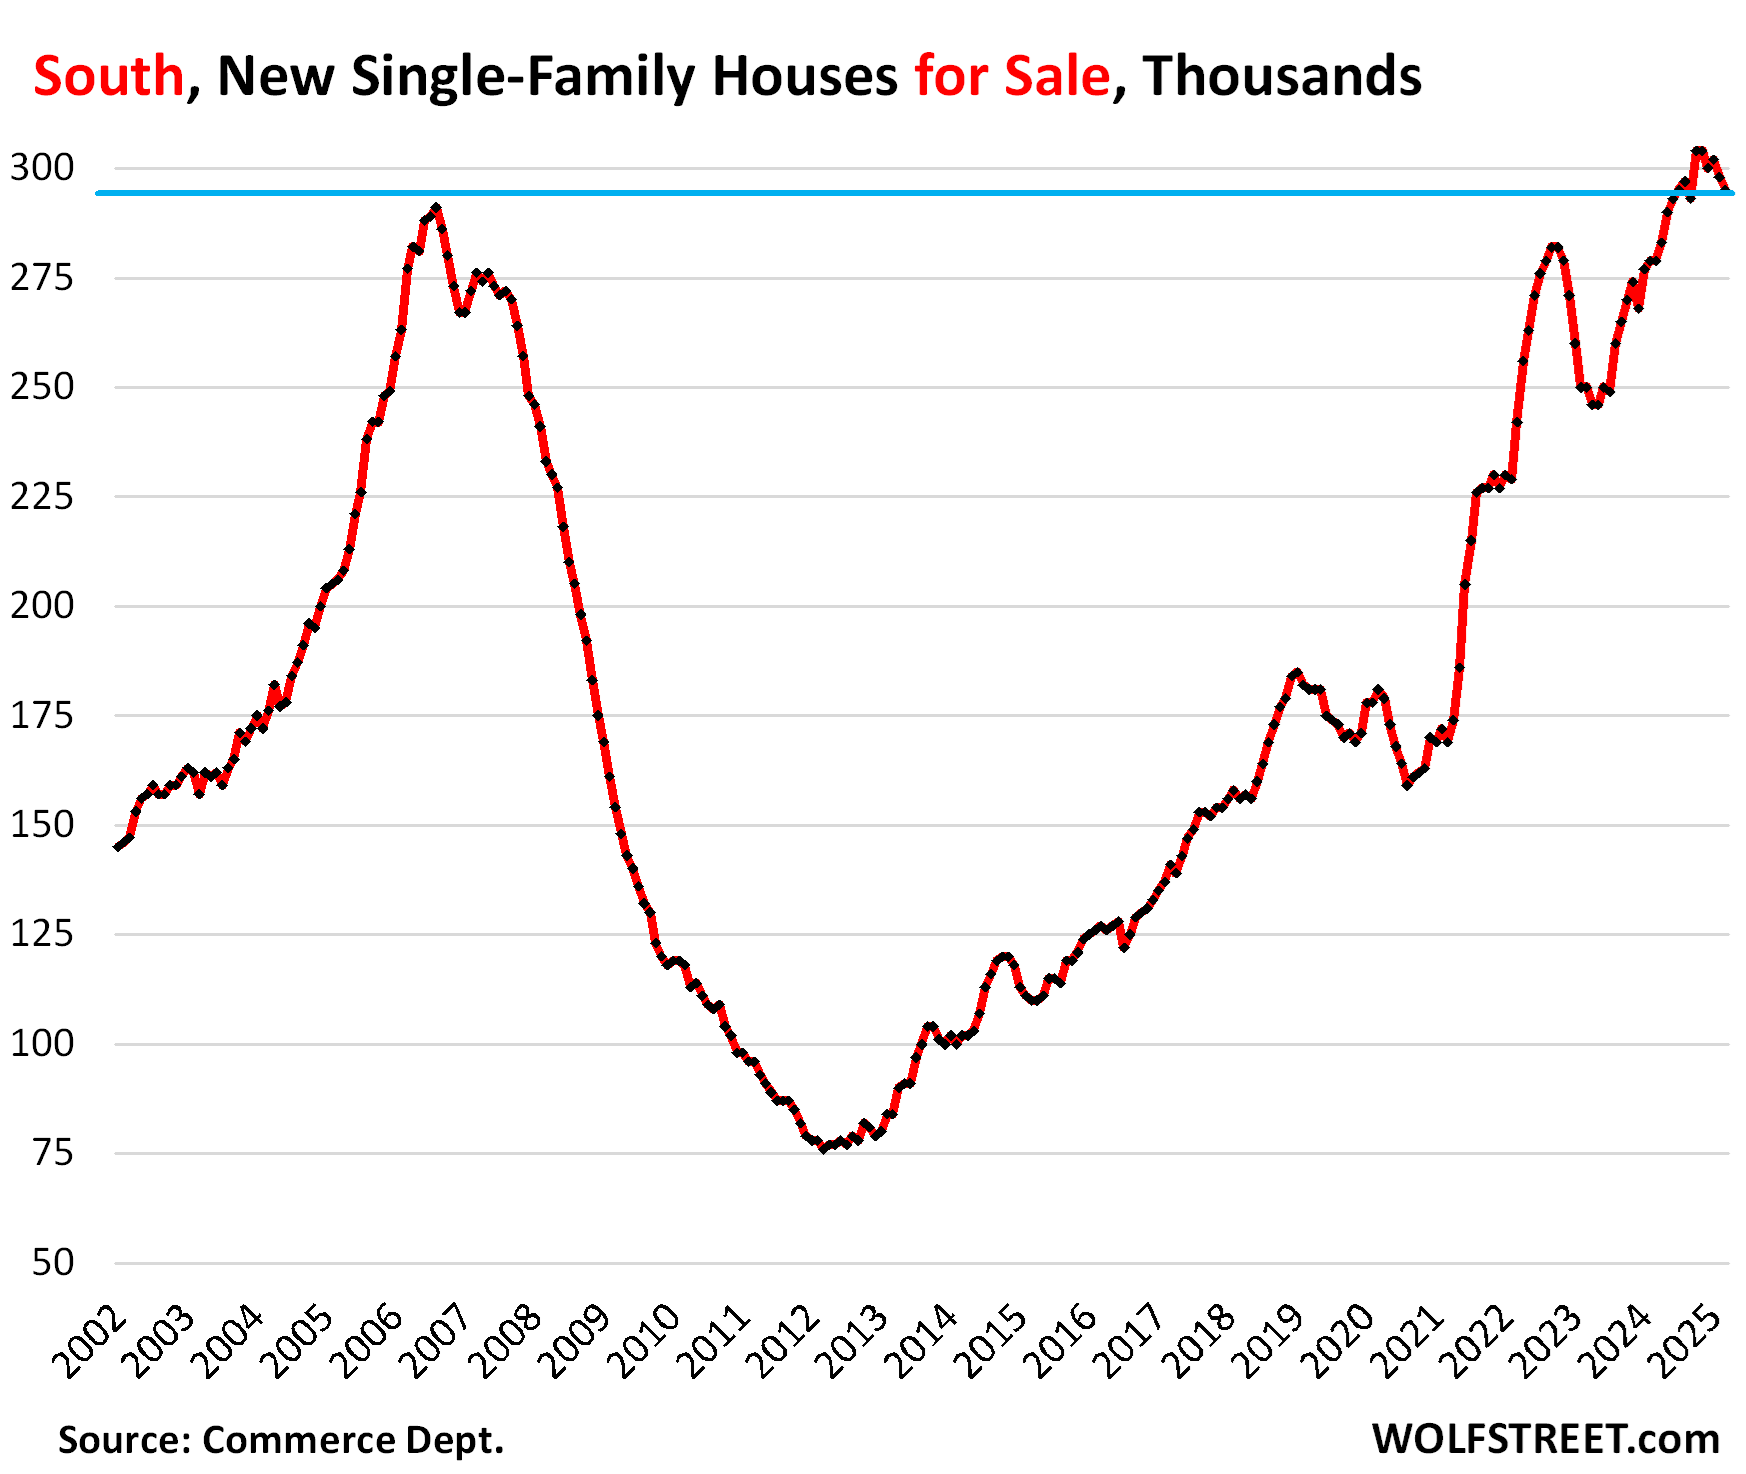
In the South, inventories of new houses for sale at all stages of construction dipped to 295,000, still above the peak levels during the Housing Bust, up by 5.7% from the bloated levels a year ago, and by 63% from March 2019!
Inventory for sale has been above the Housing Bust peak since May 2024.
The huge Census region, dominated by Texas and Florida, is by far the largest market for new houses in the US, accounting for 60% of US inventory, and for 67% of US sales (a map of the four Census regions is below the article at the top of the comments).
Large incentives and lower prices by homebuilders stimulated sales, which jumped by 21% year-over-year and also by 21% compared to March 2019. Supply declined to 6.4 months, but was still 35% higher than in March 2019.
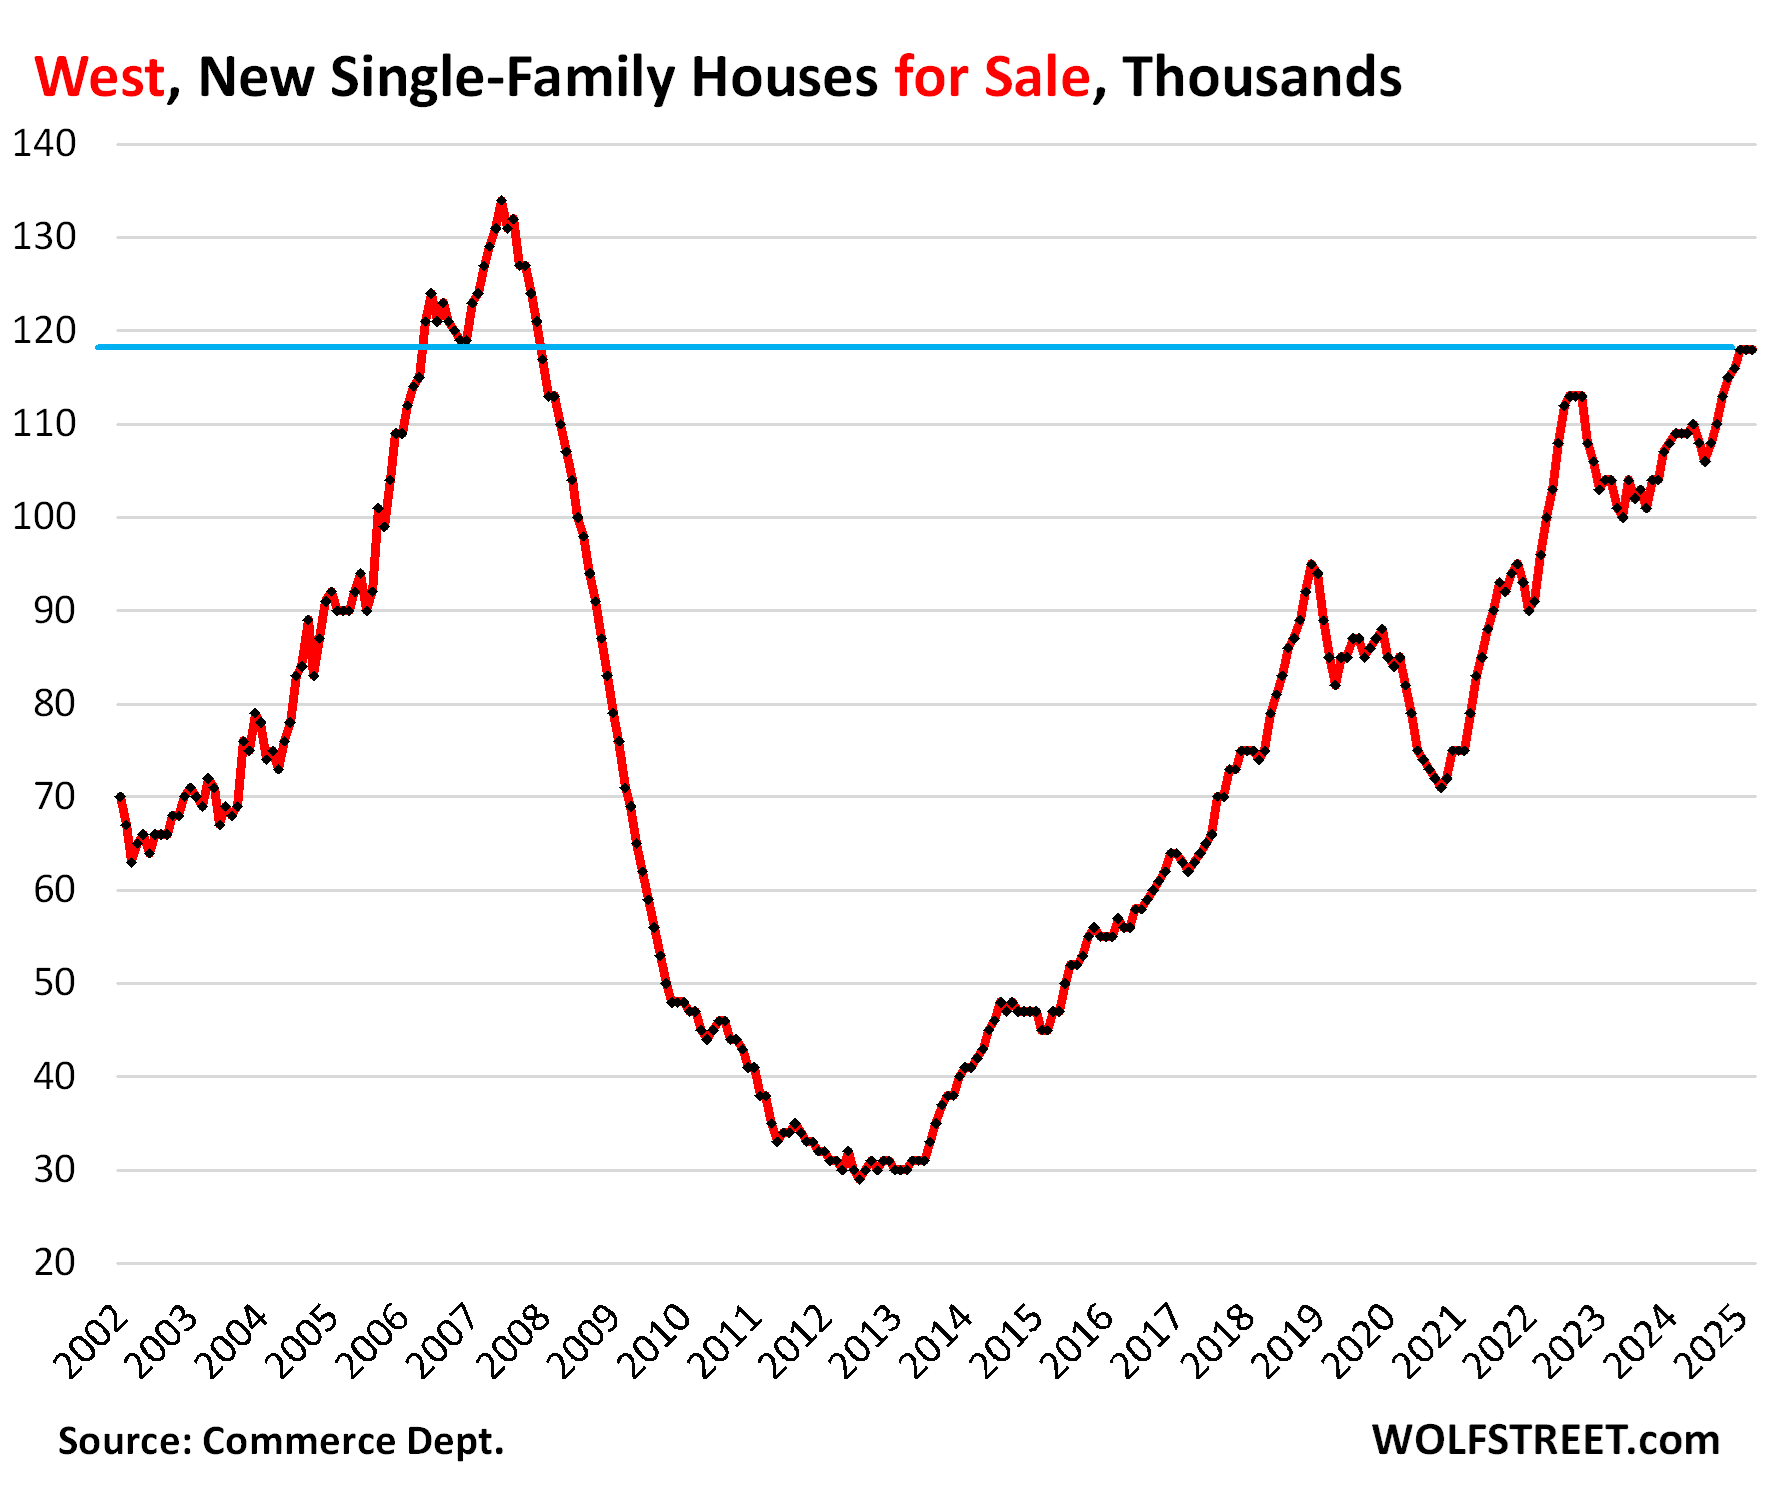
In the West, inventories of new houses for sale at all stages of construction remained at 118,000 for the third month in a row, up by 8% year-over-year, up by 39% from March 2019, and where they’d been in December 2006 as the Housing Bust was getting going.
The West accounted for 24% of the US inventory and for 19% of US sales in March.
Sales in the West fell by 13% from the already depressed levels a year ago, and by 35% from March 2019.
Supply remained at 9.1 months, up by 25% from a year ago, and more than double (+114%) where it had been in March 2019! Clearly, the price cutting needs to get serious to simulate sales and work down this inventory:
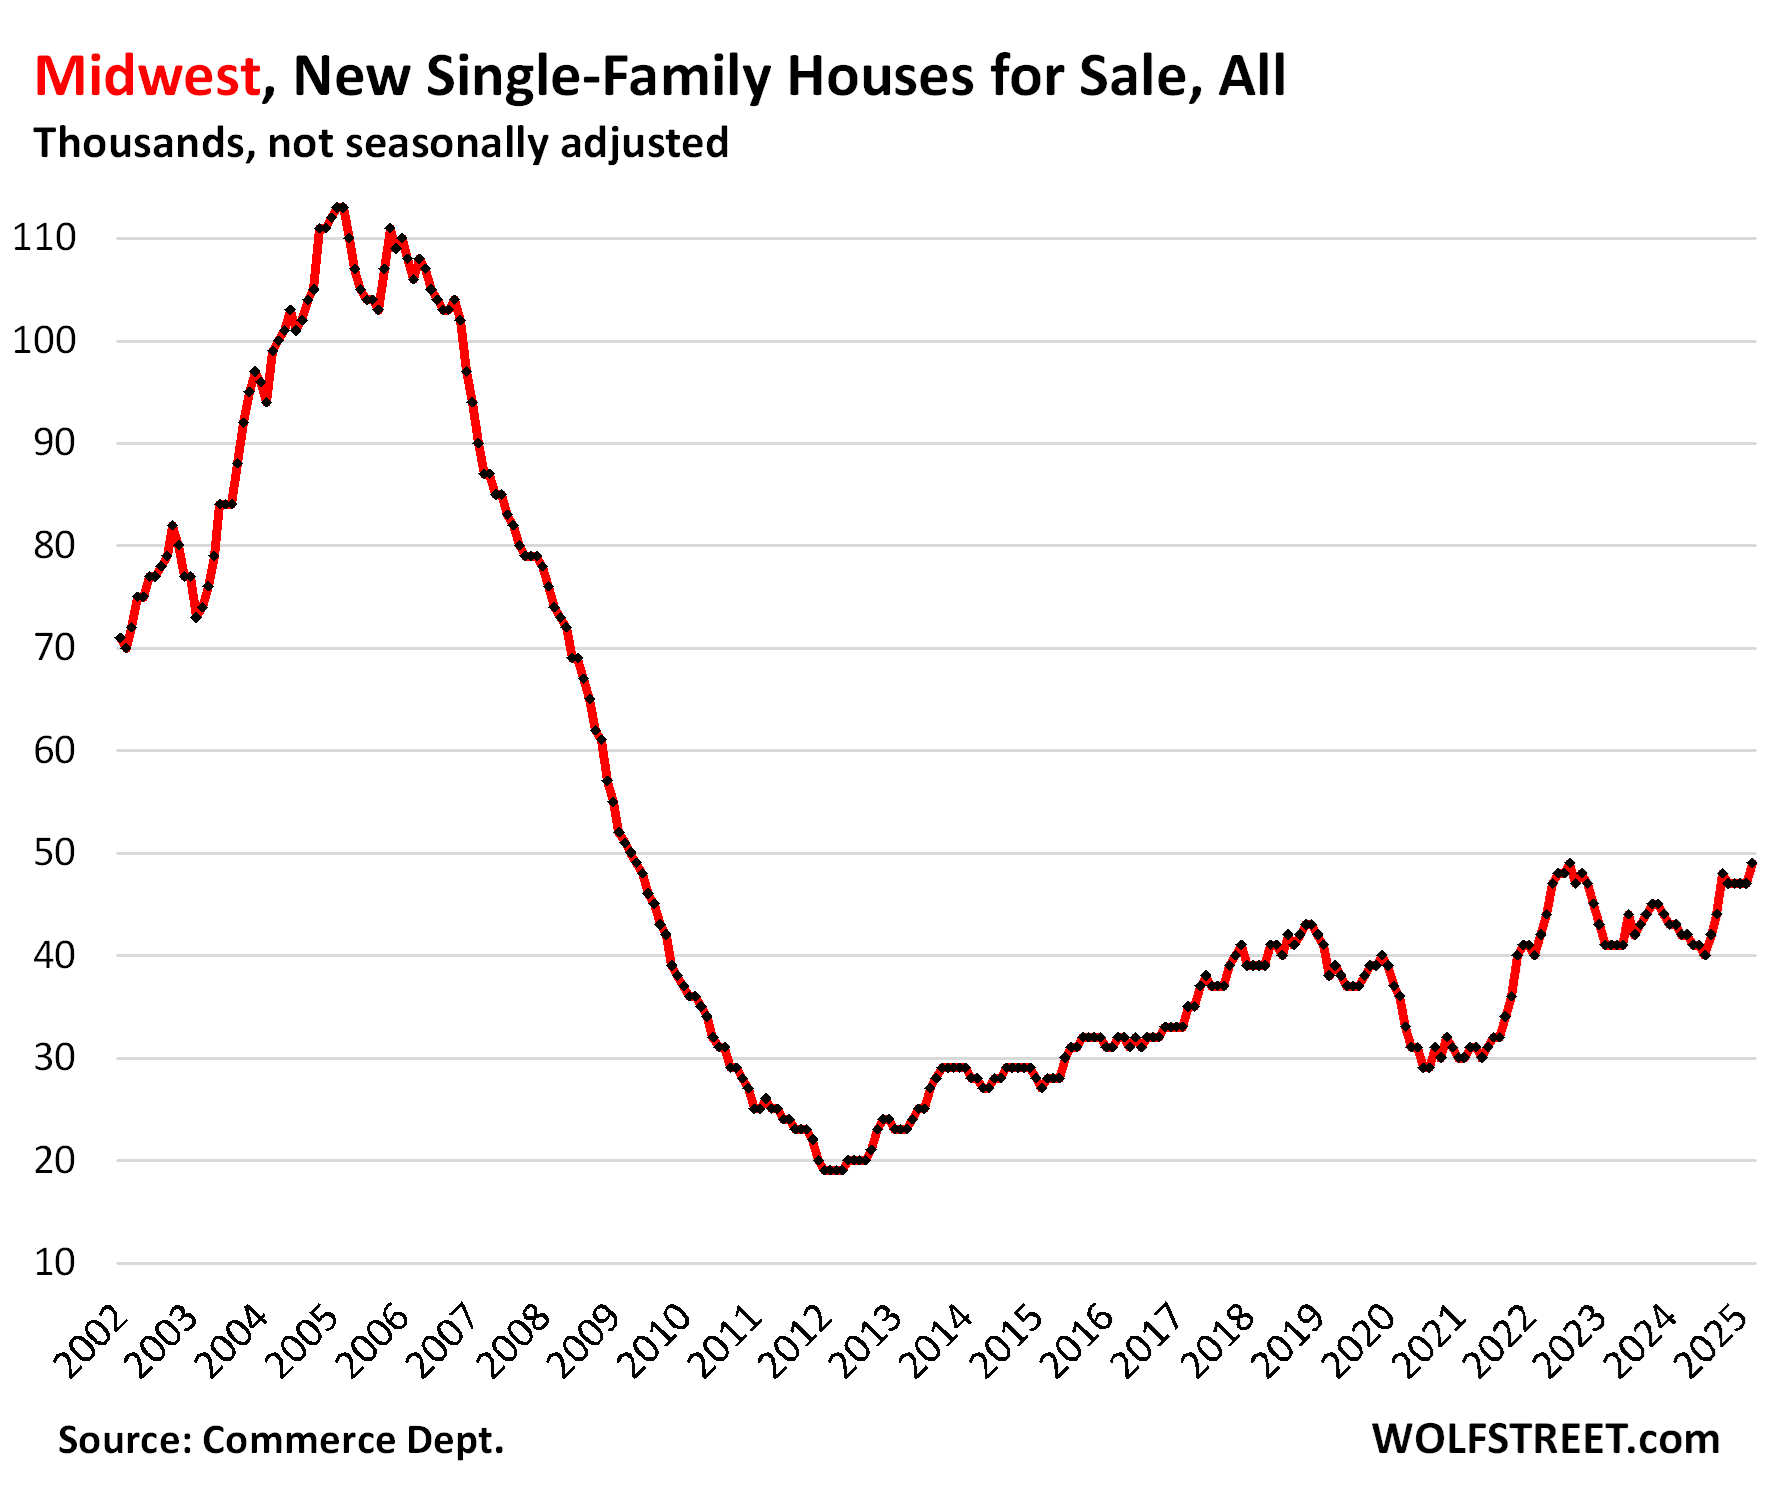
In the Midwest, inventory rose to 49,000 new houses for sale, up by 17% year-over-year and up by 29% from March 2019.
Sales, at about 7,000 houses, were down about 12% from a year ago and from 2019. Supply dipped to 7 months.
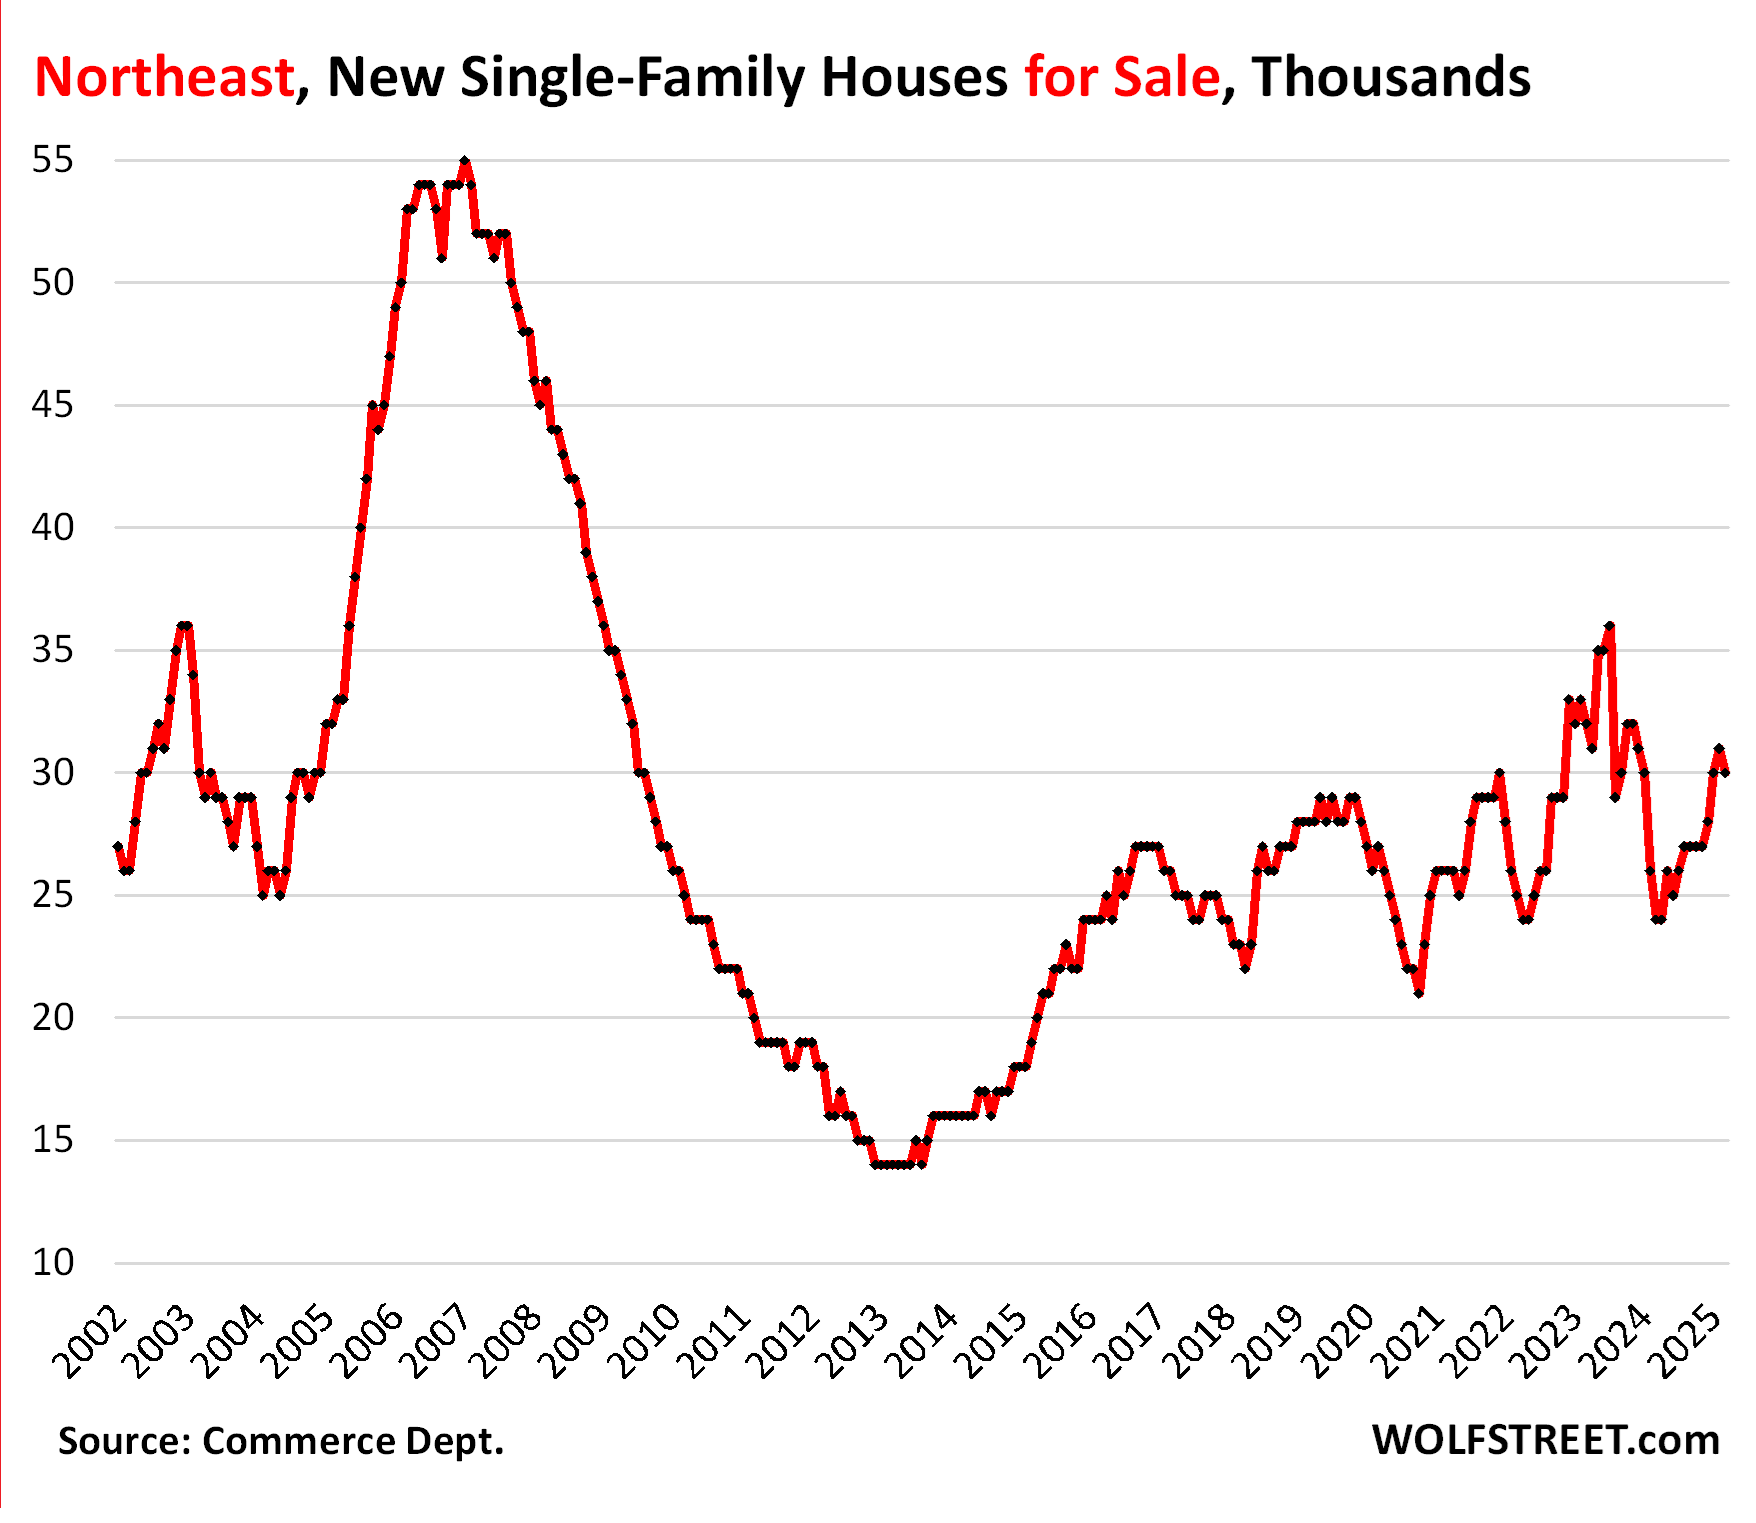
In the Northeast, inventory rose to 31,000 new houses for sale, up by 19% year-over-year and up by 11% from February 2019.
Sales of about 2,000 houses in February were down from a year ago, likely the bad weather. Supply remained at about 8 months.
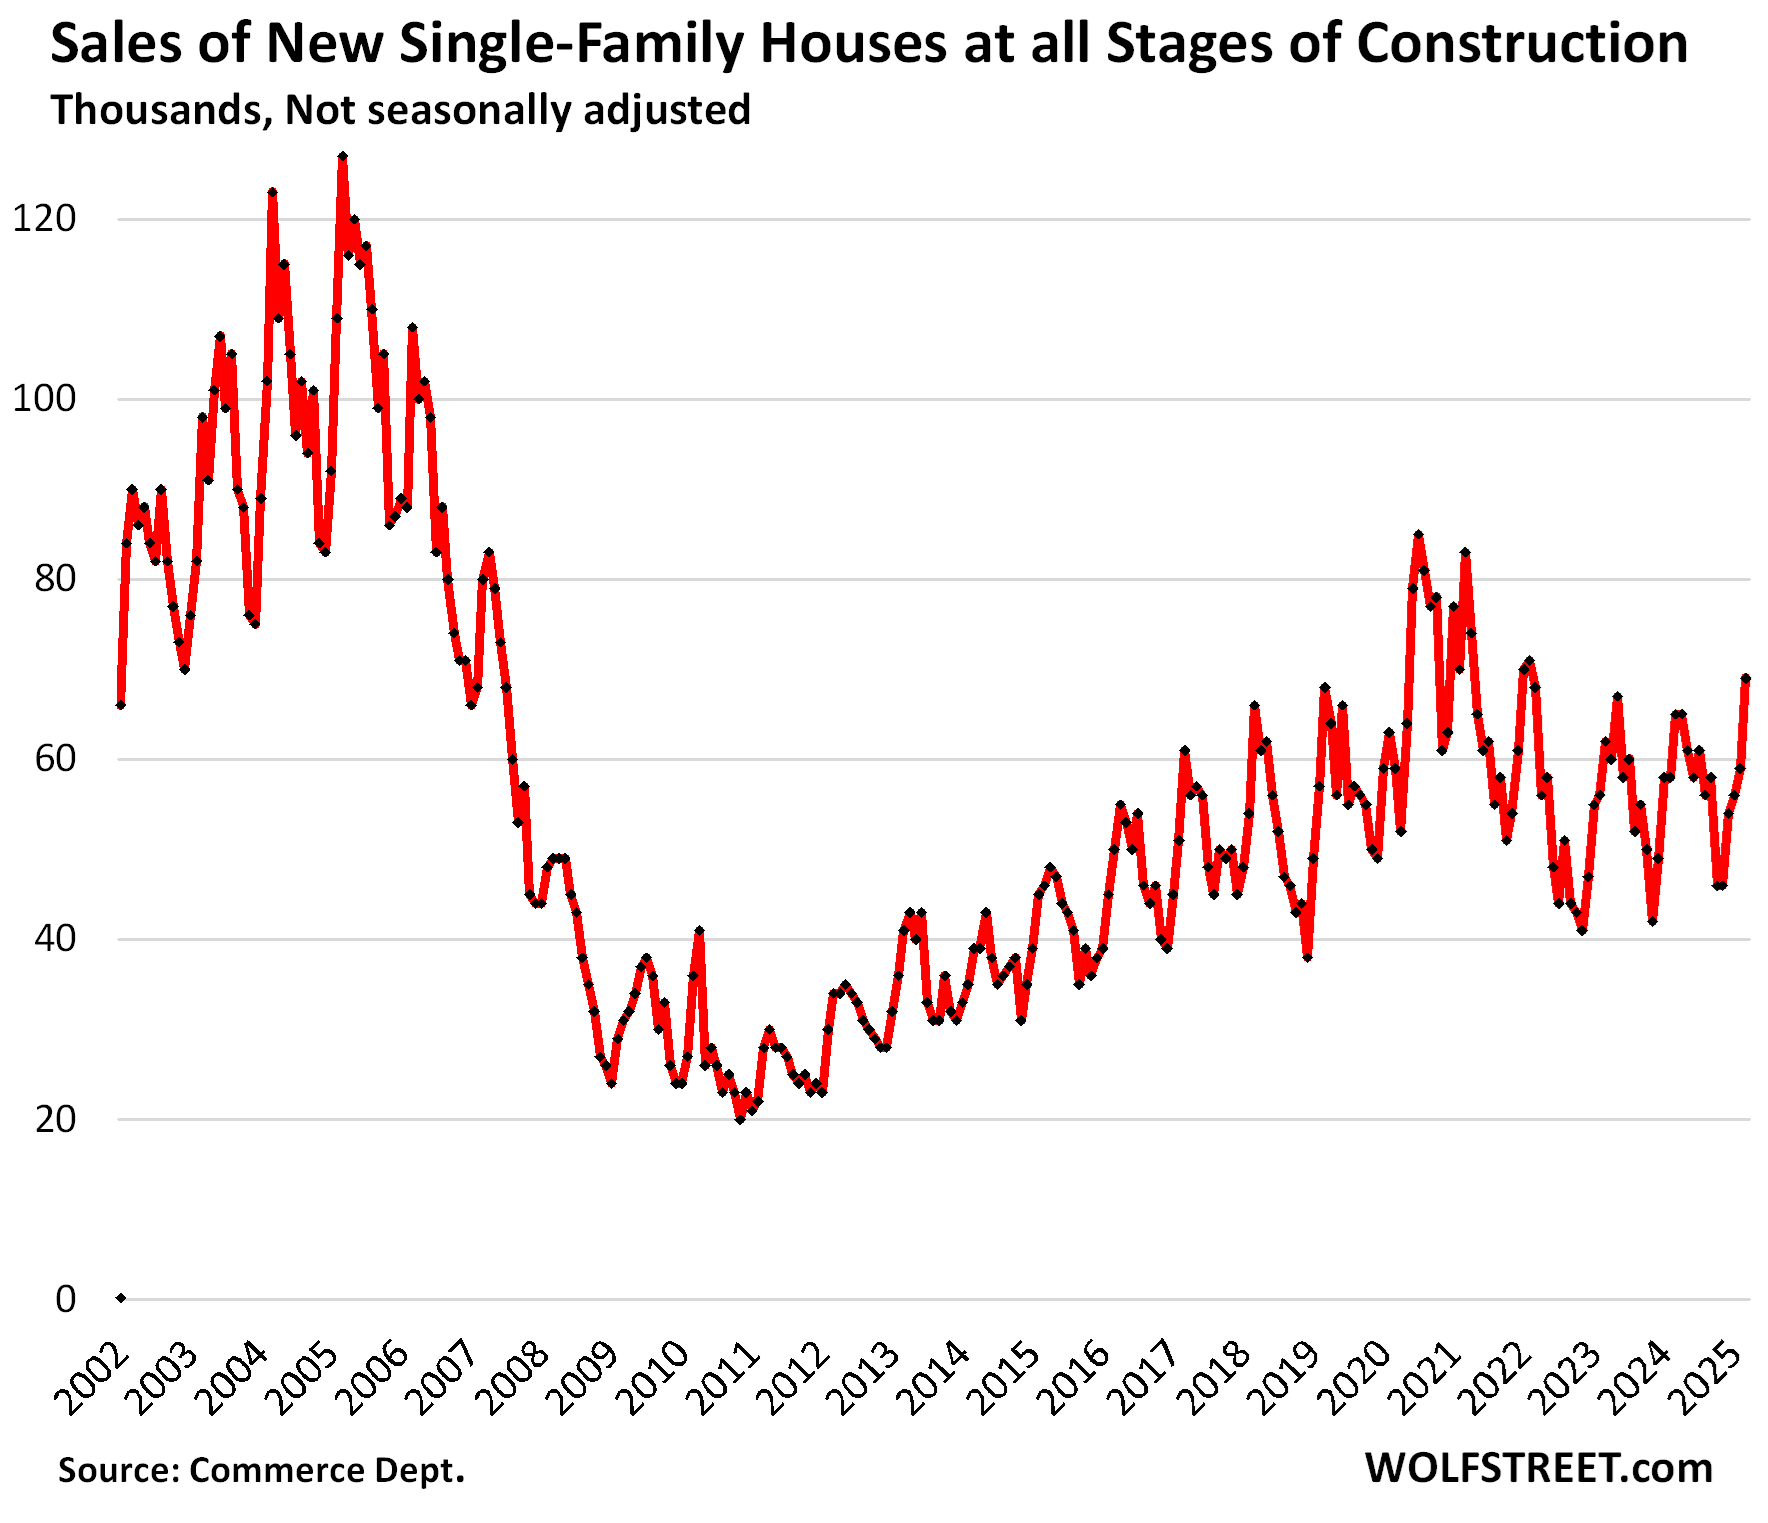
Sales overall rose to decent levels.
Sales of new houses at all stages of construction rose by 6.2% year-over-year, to 69,000 signed contracts, not seasonally adjusted, the best March since 2021. The sales increase in the South (see above) overpowered the sales decline in the West. Compared to March 2019, sales were up by 17%.
Supply dipped to 7.1 months at the strong March pace of sales, down from 7.6 months a year ago.
Overall, the builder strategy of cutting prices and throwing incentives at the market, such as mortgage rate buydowns, has been working, compared to existing homes sales that have remained at collapsed levels for over two years.
Enjoy reading WOLF STREET and want to support it? You can donate. I appreciate it immensely. Click on the mug to find out how:

![]()
The post Inventory of New Houses for Sale Stuck at Highest Level since 2007, Driven by Gluts in the South & West. Prices Fall, Incentives Soar, Sales Rise appeared first on Energy News Beat.
“}]]
Energy News Beat