[[{“value”:”
The Deficit-to-GDP ratio and Debt-to-GDP ratio get even uglier.
By Wolf Richter for WOLF STREET.
To what extent do interest payments that the US government pays on its ballooning and gigantic debt eat up tax receipts? That is a key question about the US fiscal mess.
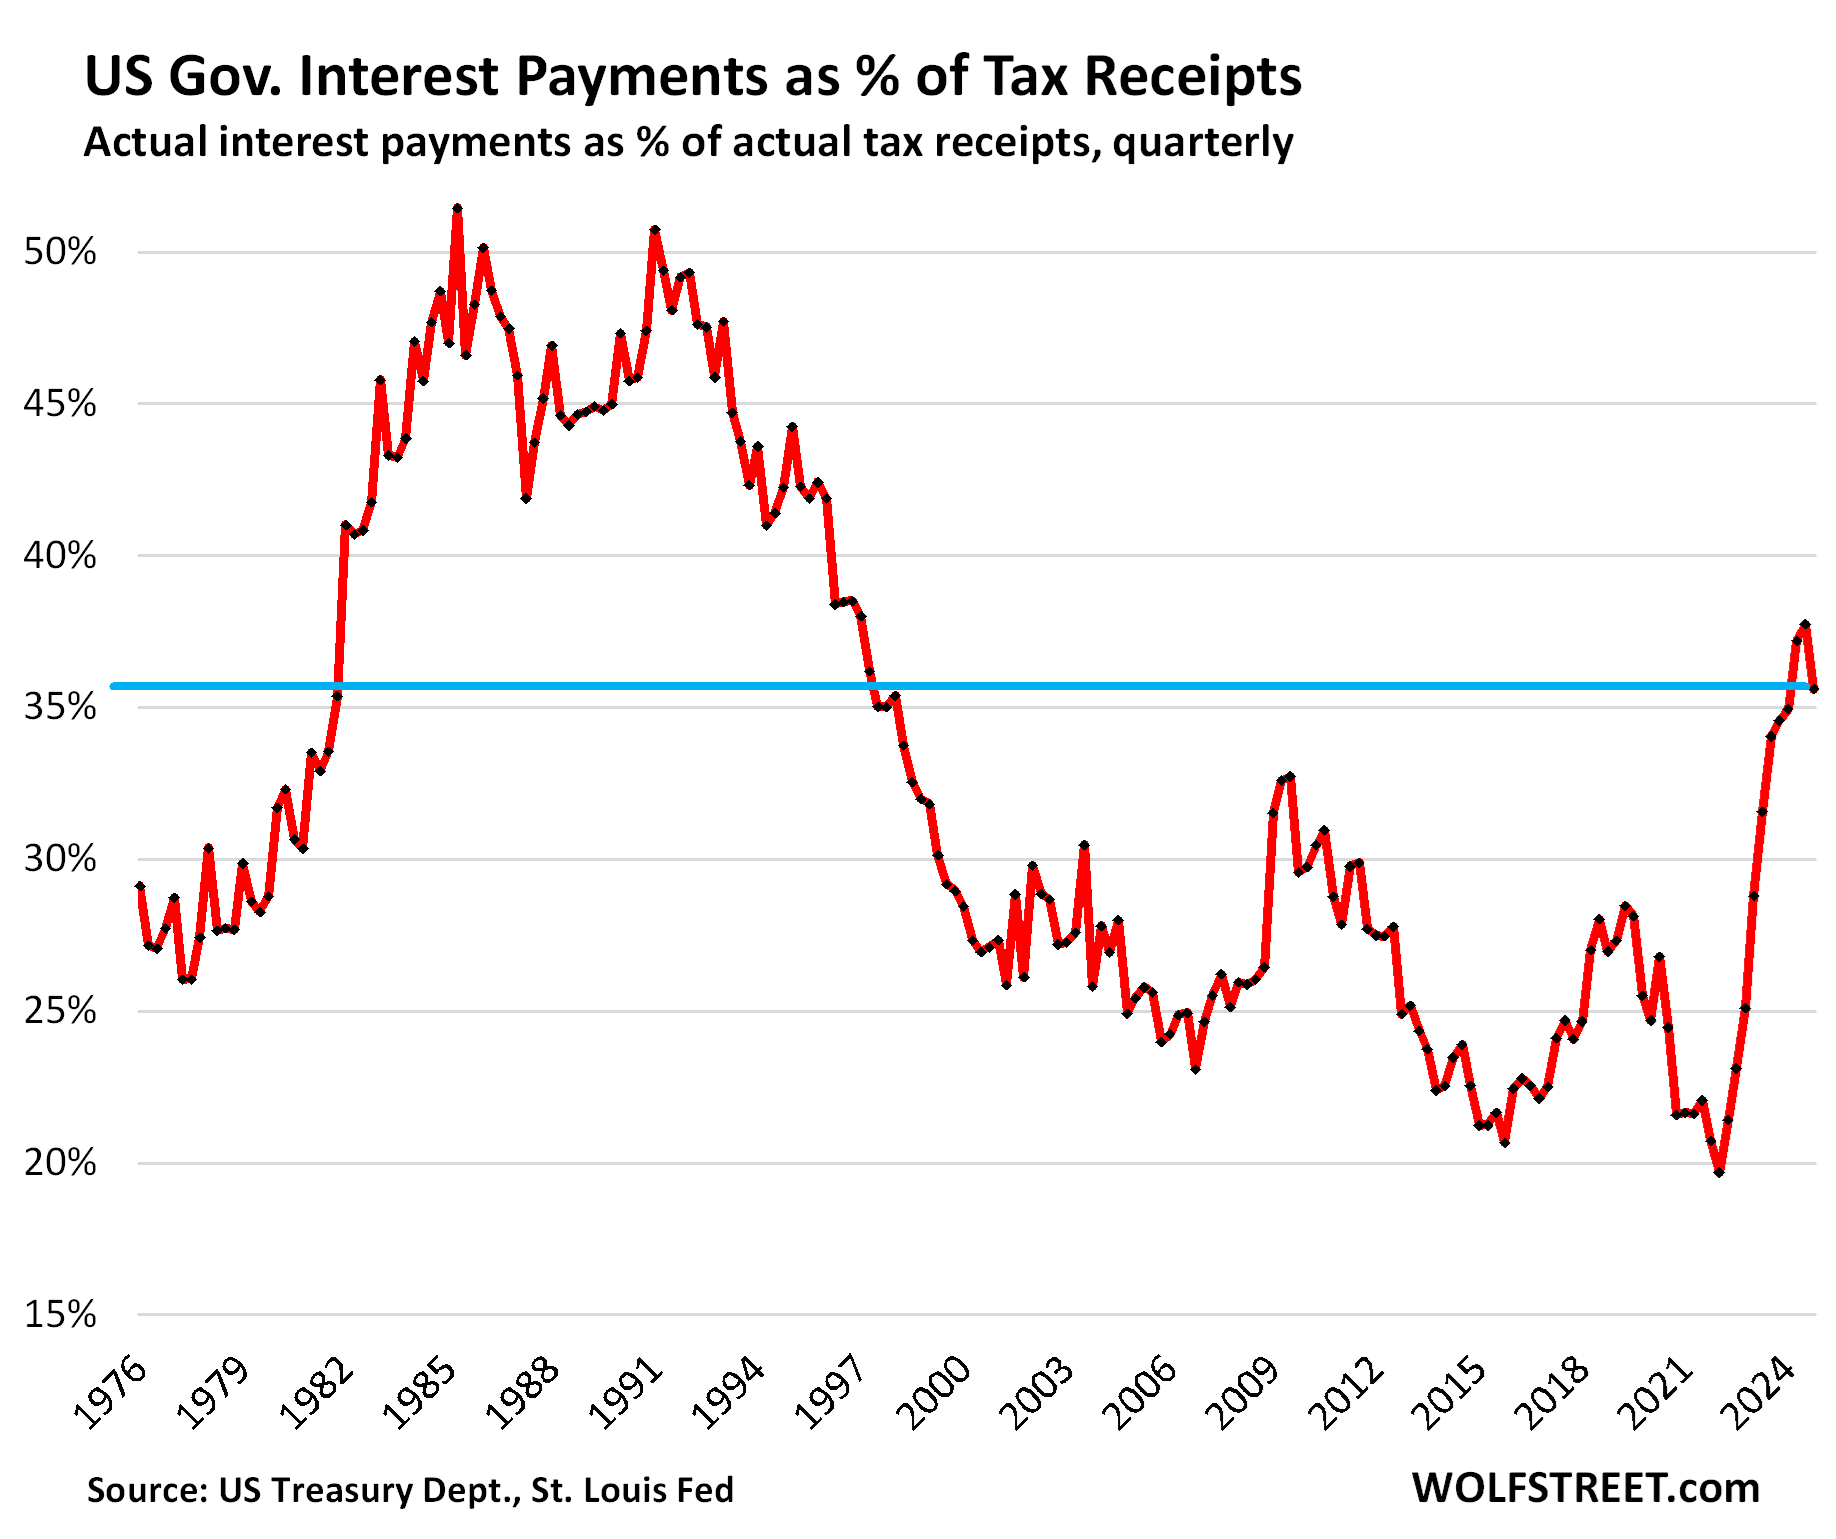
Sharply higher tax receipts in Q4 and slowing growth of interest payments in Q4 cause this ratio of “interest payments to tax receipts” to dip to 35.6% in Q4 from Q3. But year-over-year, it worsened by 1 percentage point, based on a measure of tax receipts released today by the Bureau of Economic Analysis as part of its second revision of Q4 GDP.
Q3 had been the worst since 1996, when this ratio was on the downtrend from the scary times in the 1980s. The magnitude and speed of this spike is unprecedented in modern US history:
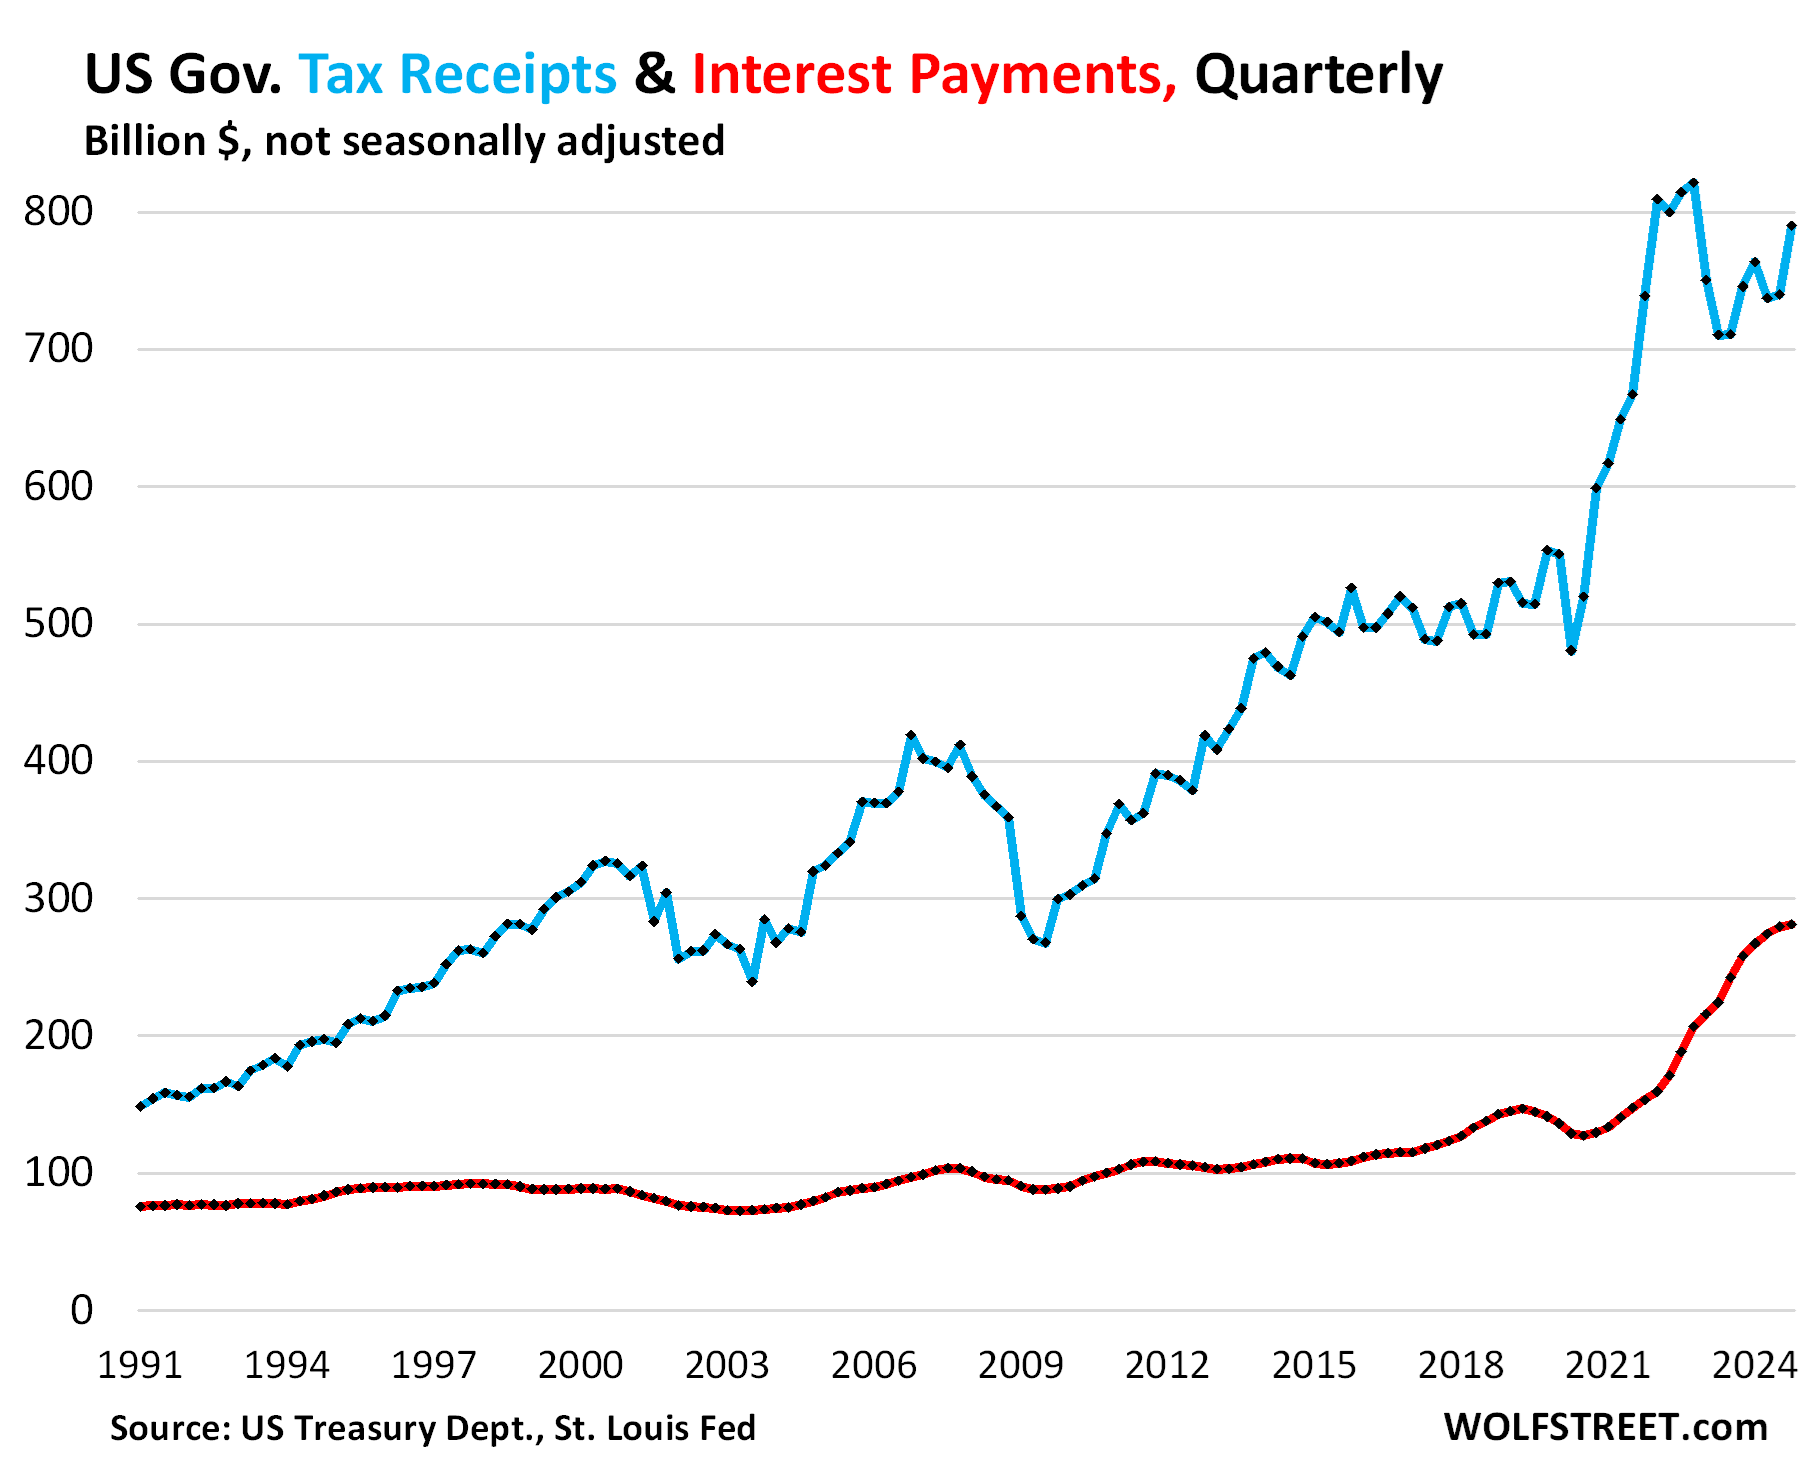
Interest payments by the government on its $36.2 trillion in Treasury debt rose by 9.1% year-over-year to $281 billion in Q4 (red in the chart below).
The increases slowed in Q4 after the spike in 2021 through 2024, which was brought about by the spike of the debt, and the higher interest rates on this spiking debt. The increases are now slowing because interest rates for newly issued short-term government debt have fallen.
Tax receipts in Q4 jumped by $44 billion from Q3, and by $50 billion year-over-year, to $790 billion (blue).
Tax receipts can spike and plunge with capital-gains taxes. Surging financial markets trigger a tsunami of capital gains, and therefore capital gains taxes to be paid quarterly and the following year by April 15. The year 2024 was a hot year for markets, triggering lots of capital-gains taxes, some of which were paid quarterly as part of the estimated taxes, and some of it will be paid by by April 15. Bubbly financial markets boost tax receipts.
Tax receipts increase more steadily through growing employment and wages, with more workers working, and with their wages rising. Growing profits by businesses also contribute to the growth in tax receipts. Inflation is a big factor in driving up tax receipts by inflating taxable incomes and taxable profits.
This measure of tax receipts from the BEA tracks the tax receipts that are available to pay for general budget expenditures, such as defense spending, interest payments, etc. Excluded are receipts that are not available to pay for general budget expenditures, primarily Social Security and disability contributions that go into Trust Funds, out of which the benefits are then paid to the beneficiaries of the systems.
Interest payments have spike since 2022 for two reasons.
The debt has ballooned year after year, for many years, including by $2.2 trillion in 2024 despite 2.8% annual real GDP growth. That strong economic growth may not get repeated in 2025. At the end of Q4, the debt hit the debt ceiling of $36.2 trillion.
Short-term interest rates have fallen. The Fed cut its policy rates by 100 basis points in the fall of 2024.
Interest rates on short-term Treasury bills (terms of 1 month to 1 year) started falling in mid-2024 in anticipation of rate cuts. The $6.4 trillion in T-bills are maturing and are getting refinanced all the time in huge auctions, and the lower-interest rate T-bills replaced higher interest-rate T-bills in quick succession as the interest on T-bills declined.
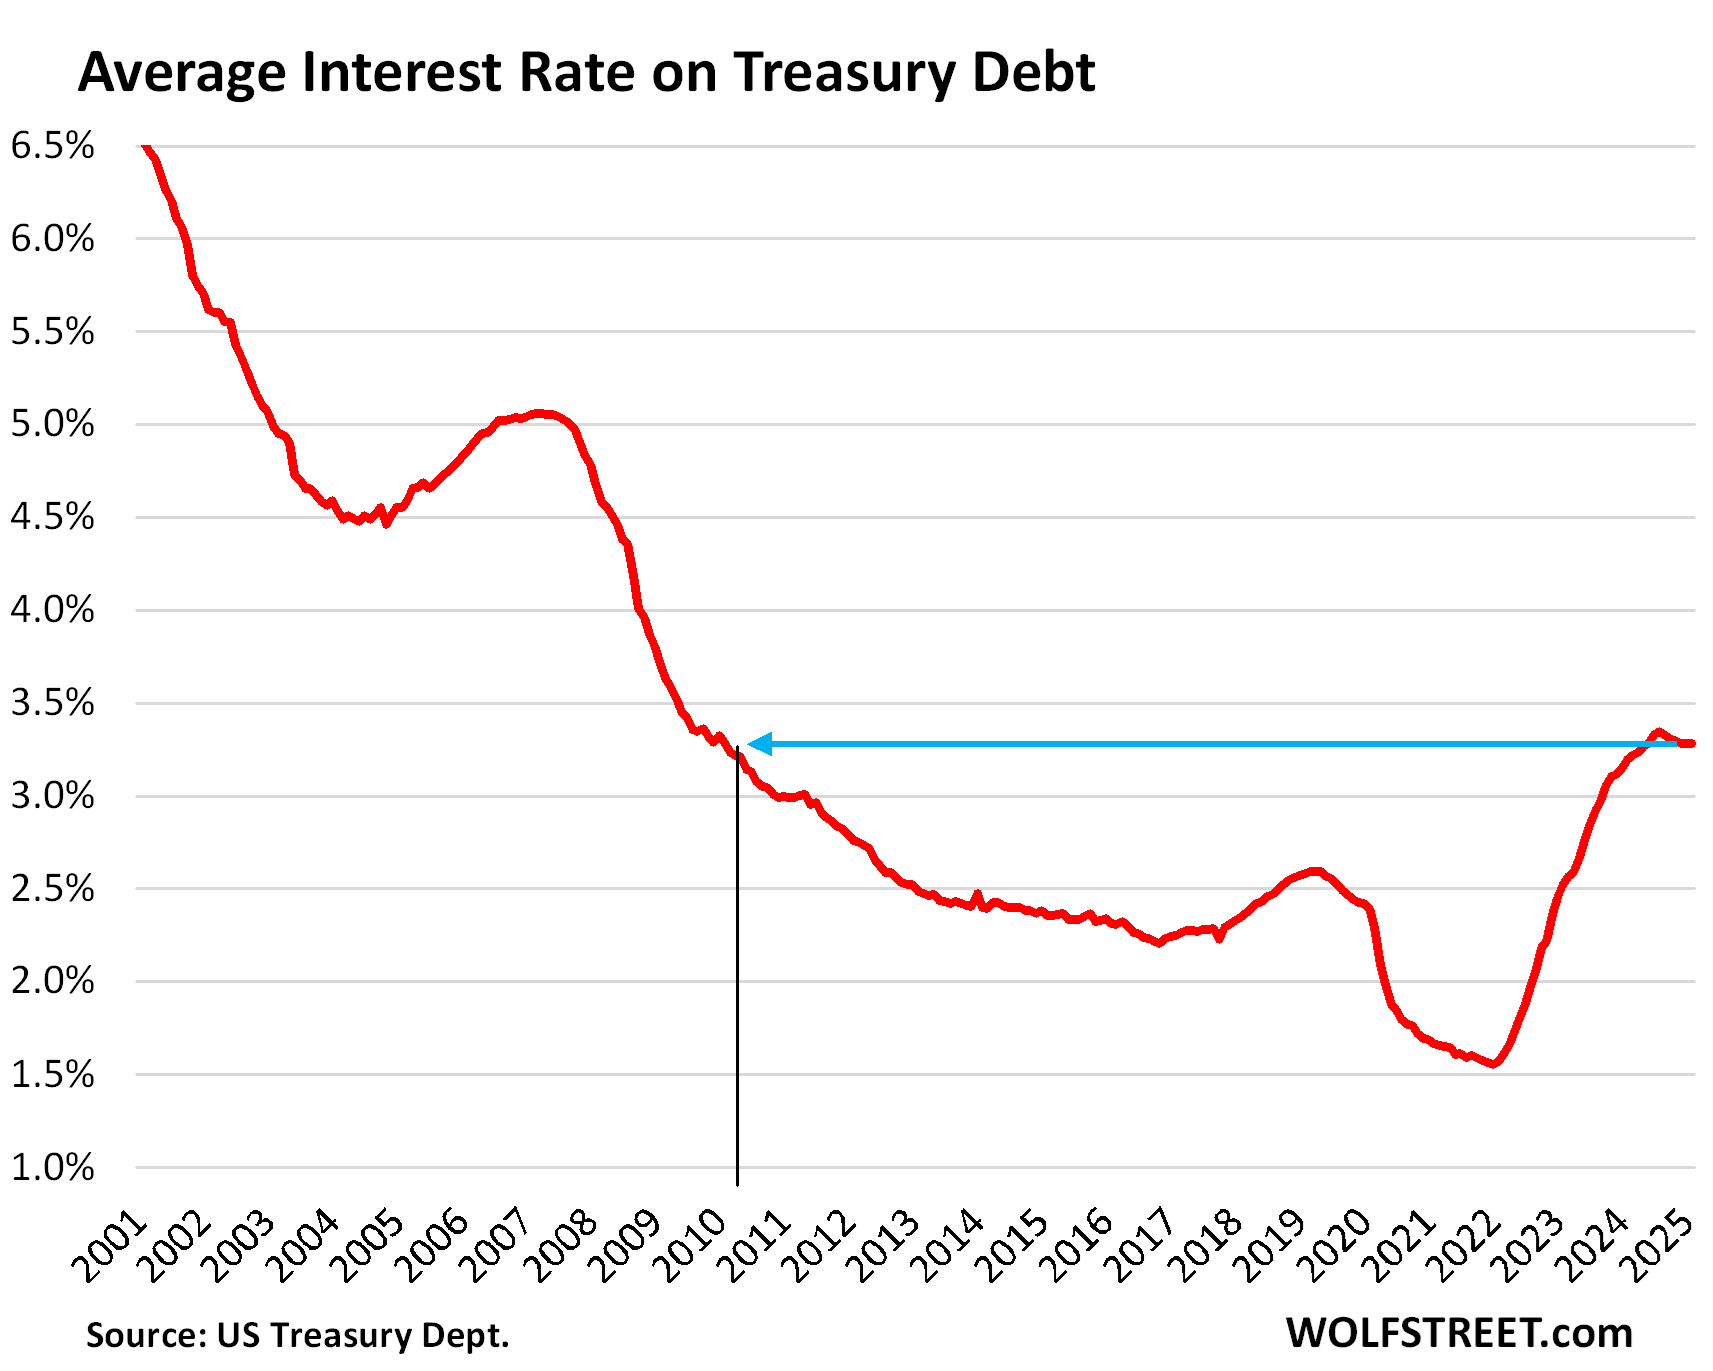
In terms of Treasury notes and bonds (2 years to 30 years), the picture is much more complex. After the rate cuts began, their yields began to surge again. For example, the 10-year yield started 2024 at 3.95% and ended the year 2024 at 4.58%, with some big movements in between. Many of the newly issued notes and bonds were sold at higher interest rates than the notes and bonds they replaced. But they turn over much more slowly than T-bills.
These dynamics form the average interest rate that the government pays on its total outstanding debt. That average interest doubled from 2022 through 2024 with higher T-bill rates, and went as high as 3.35% in June 2024. Over the past three months, it has stabilized at 3.28%:
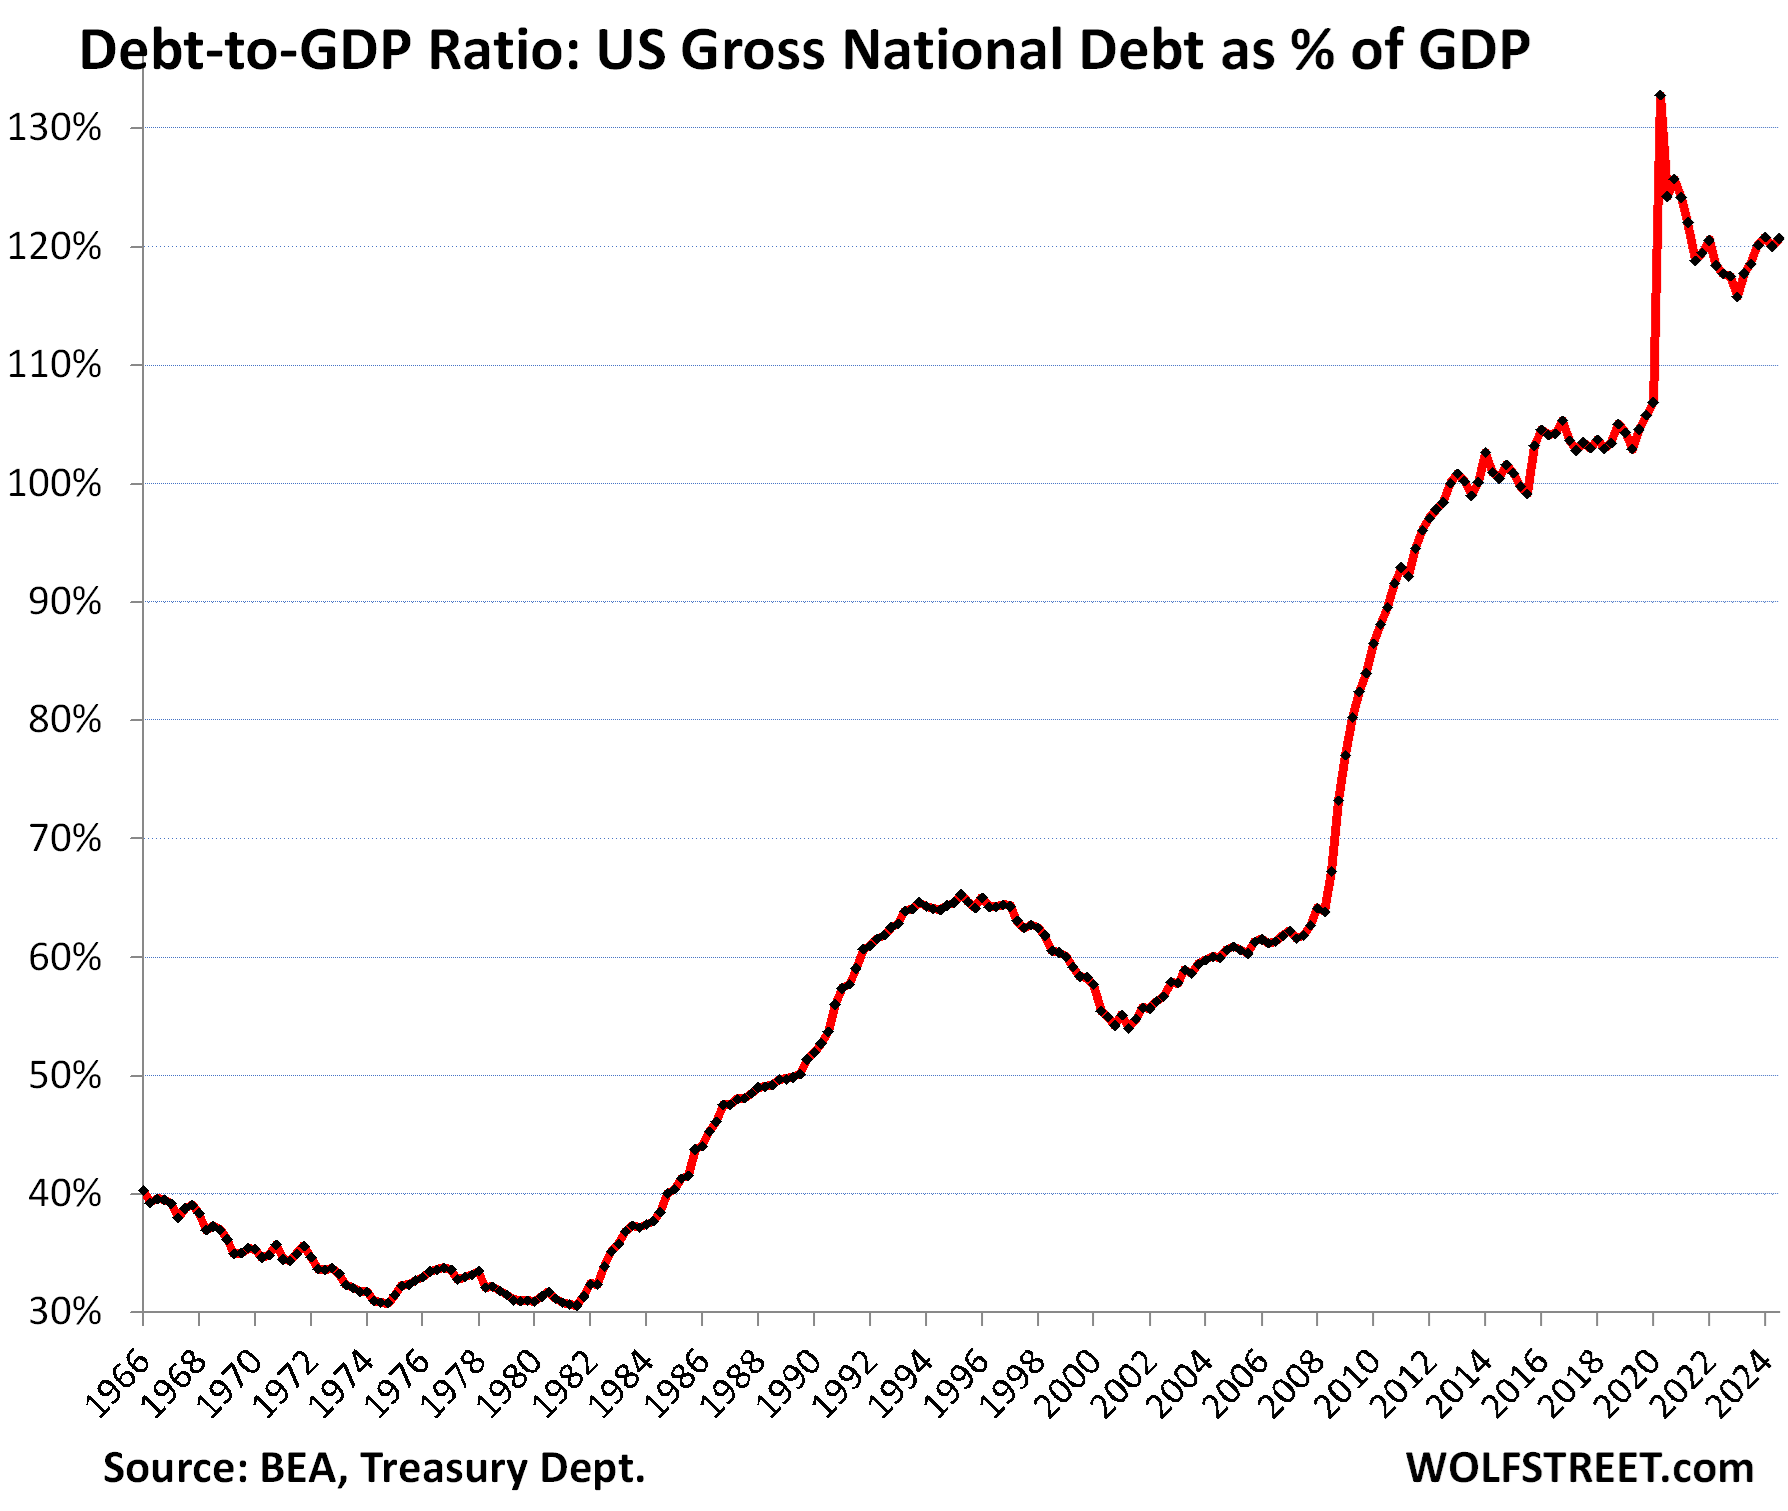
The ugly Debt-to-GDP ratio: Total debt as percent of GDP rose to 121.9% in Q4, the highest since Q2 2021, based on the revised estimate of Q4 “current dollar” GDP released by the BEA today.
The spike of the ratio in Q2 2020 was the result of the collapse of GDP during the lockdown and spike of the national debt to pay for the stimulus measures. As GDP recovered faster than the debt grew, the ratio came down through Q1 2023. But then, all heck re-broke loose.
As sort of a tragic-comic relief, here is the Debt-to-GDP chart going back to 1966. Note that inflation cancels out in the Debt-to-GDP ratio, as it is in both the numerator and the denominator: total debt not adjusted for inflation divided by “current dollar” GDP, which is also not adjusted for inflation:
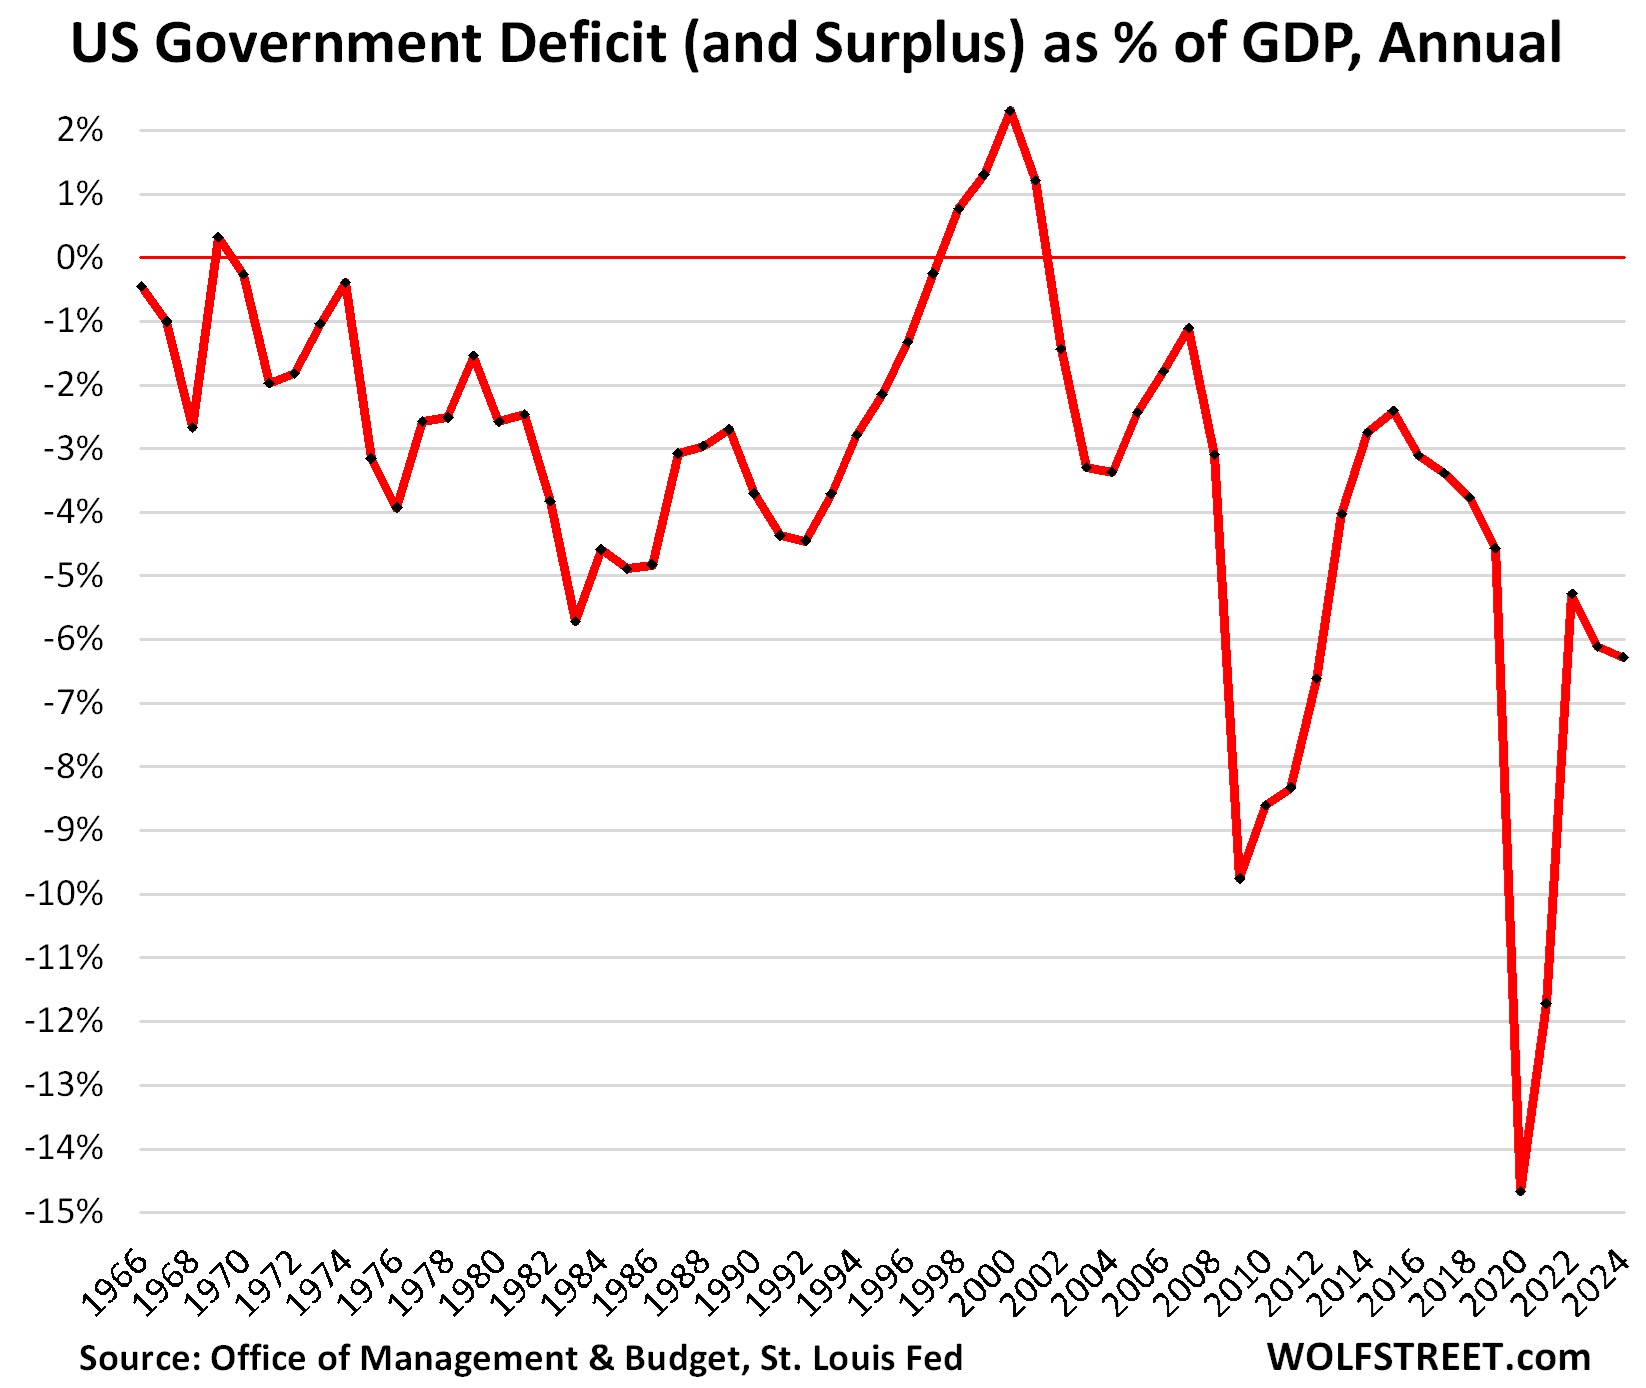
The ugly Deficit-to-GDP ratio worsened to 6.3% in 2024, despite the solid growth of GDP. A deficit of 3% of GPD on average is considered close to “sustainable,” at best.
Bringing the annual deficit back to 3% of GDP – on average over the years, including recessions – will require major policy fixes on spending and taxes. This is of course precisely what Congress has been unwilling and unable to do. And it will require solid economic growth. Not holding my breath.
The annual “deficit” is the amount that the government spends more in that year than it takes in from taxes and fees that year. The difference is what it has to borrow that year. The borrowed difference then adds to the “debt,” which is the total accumulated amount that the government has borrowed since forever.
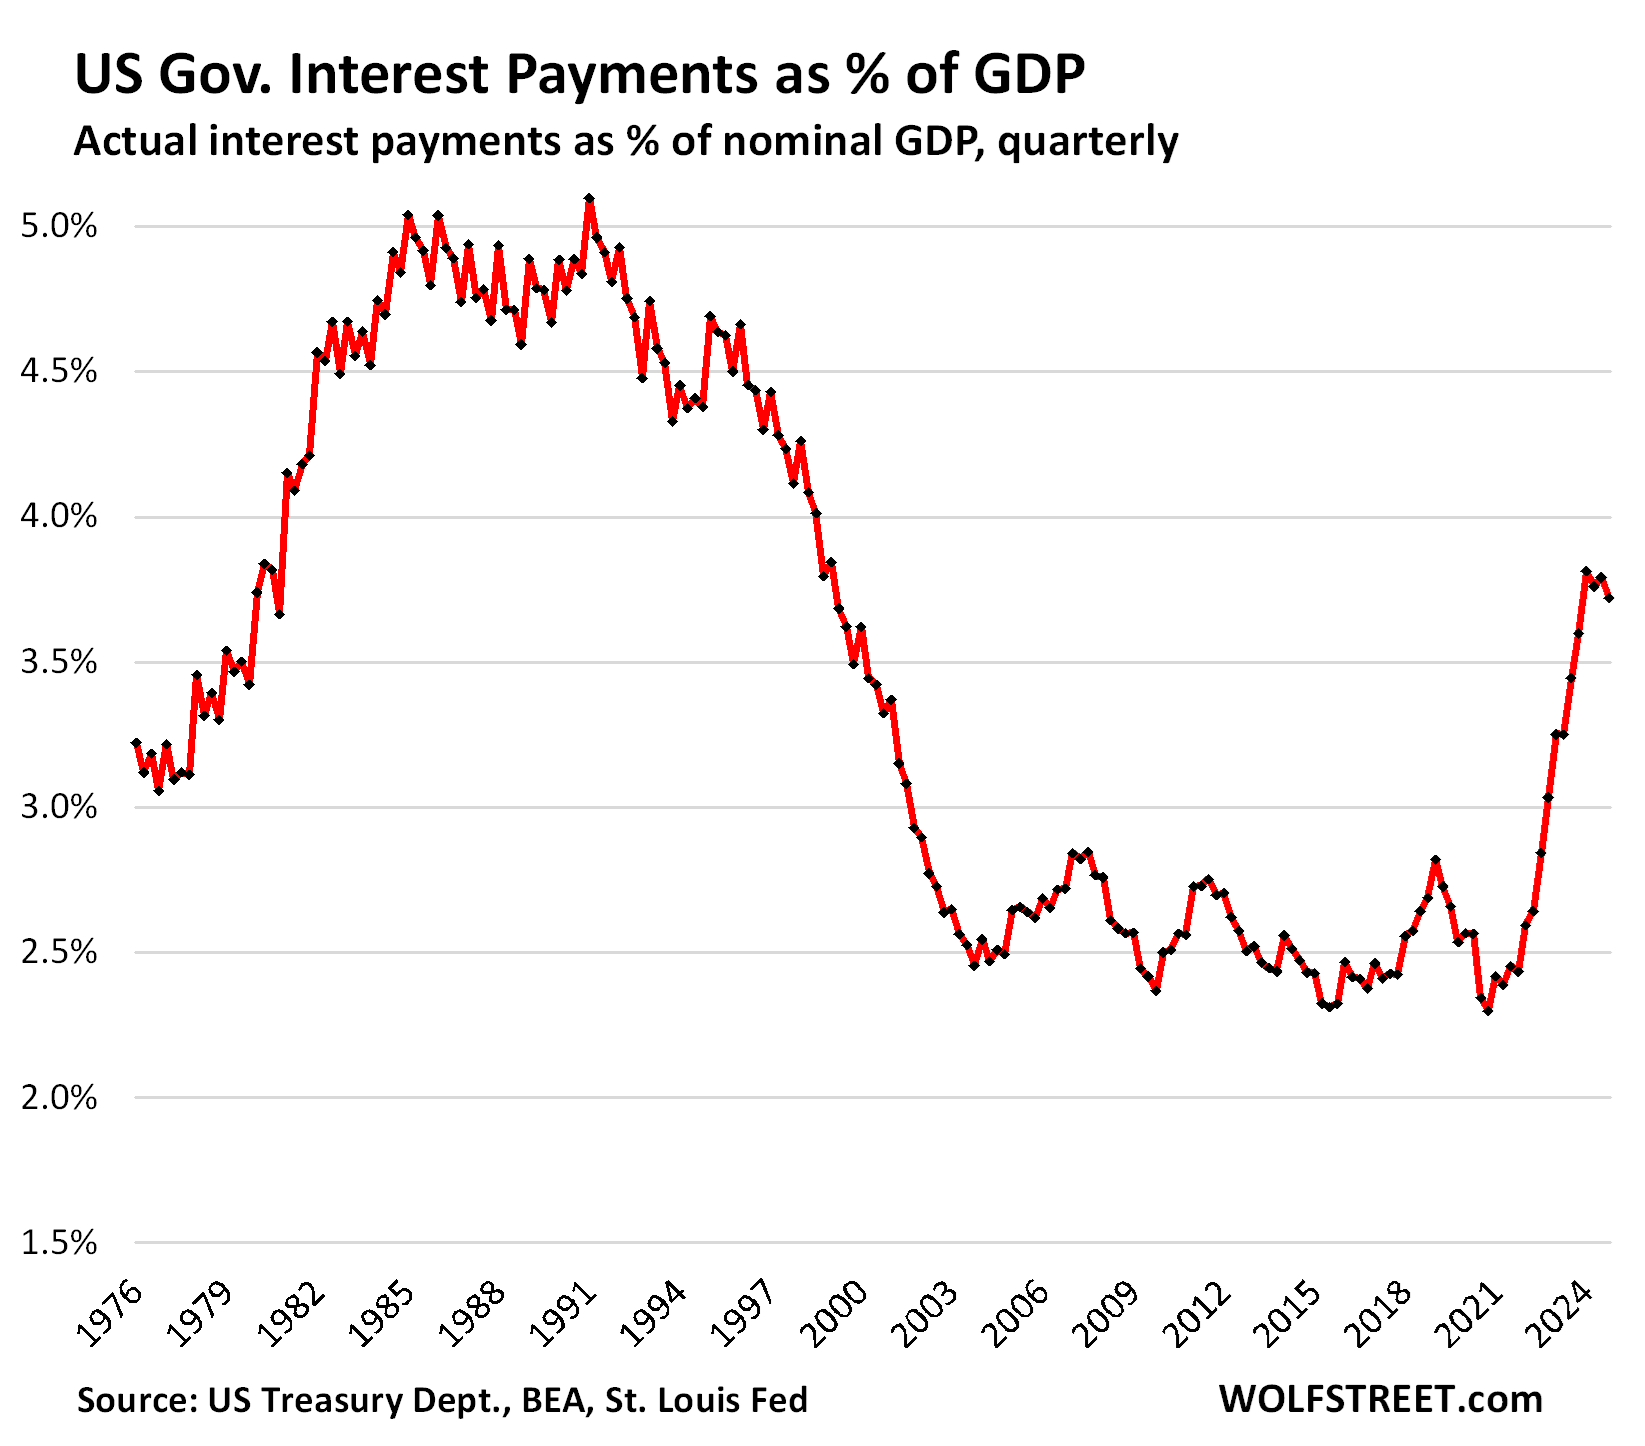
The Interest-Payments-to-GDP ratio shows the burden of the interest payments expressed in terms of the overall economy. The chart looks similar in shape to the first chart, “Interest Payments as Percent of Tax Receipts” because tax receipts track GDP fairly closely over the years.
The US debt growth has for years been called “unsustainable” because over the long term, this kind of debt growth cannot be sustained. Something will happen to address it. If policy makers don’t make it happen, inflation will.
The US, by controlling its own currency, cannot default on its debt because it can always print more money to service that debt. But printing more money to service an out-of-control debt could lead to a spiral of inflation that would wreak serious havoc on the economy and lead to years of economic pain.
Enjoy reading WOLF STREET and want to support it? You can donate. I appreciate it immensely. Click on the mug to find out how:

![]()
The post US Government Fiscal Mess: Debt, Deficit, Interest Payments, and Tax Receipts: Q4 2024 Update on an Ugly Situation appeared first on Energy News Beat.
“}]]
Energy News Beat