[[{“value”:”
Natural gas and electricity pushed up energy costs in February, despite drop in gasoline prices. Used vehicle prices continued to surge.
By Wolf Richter for WOLF STREET.
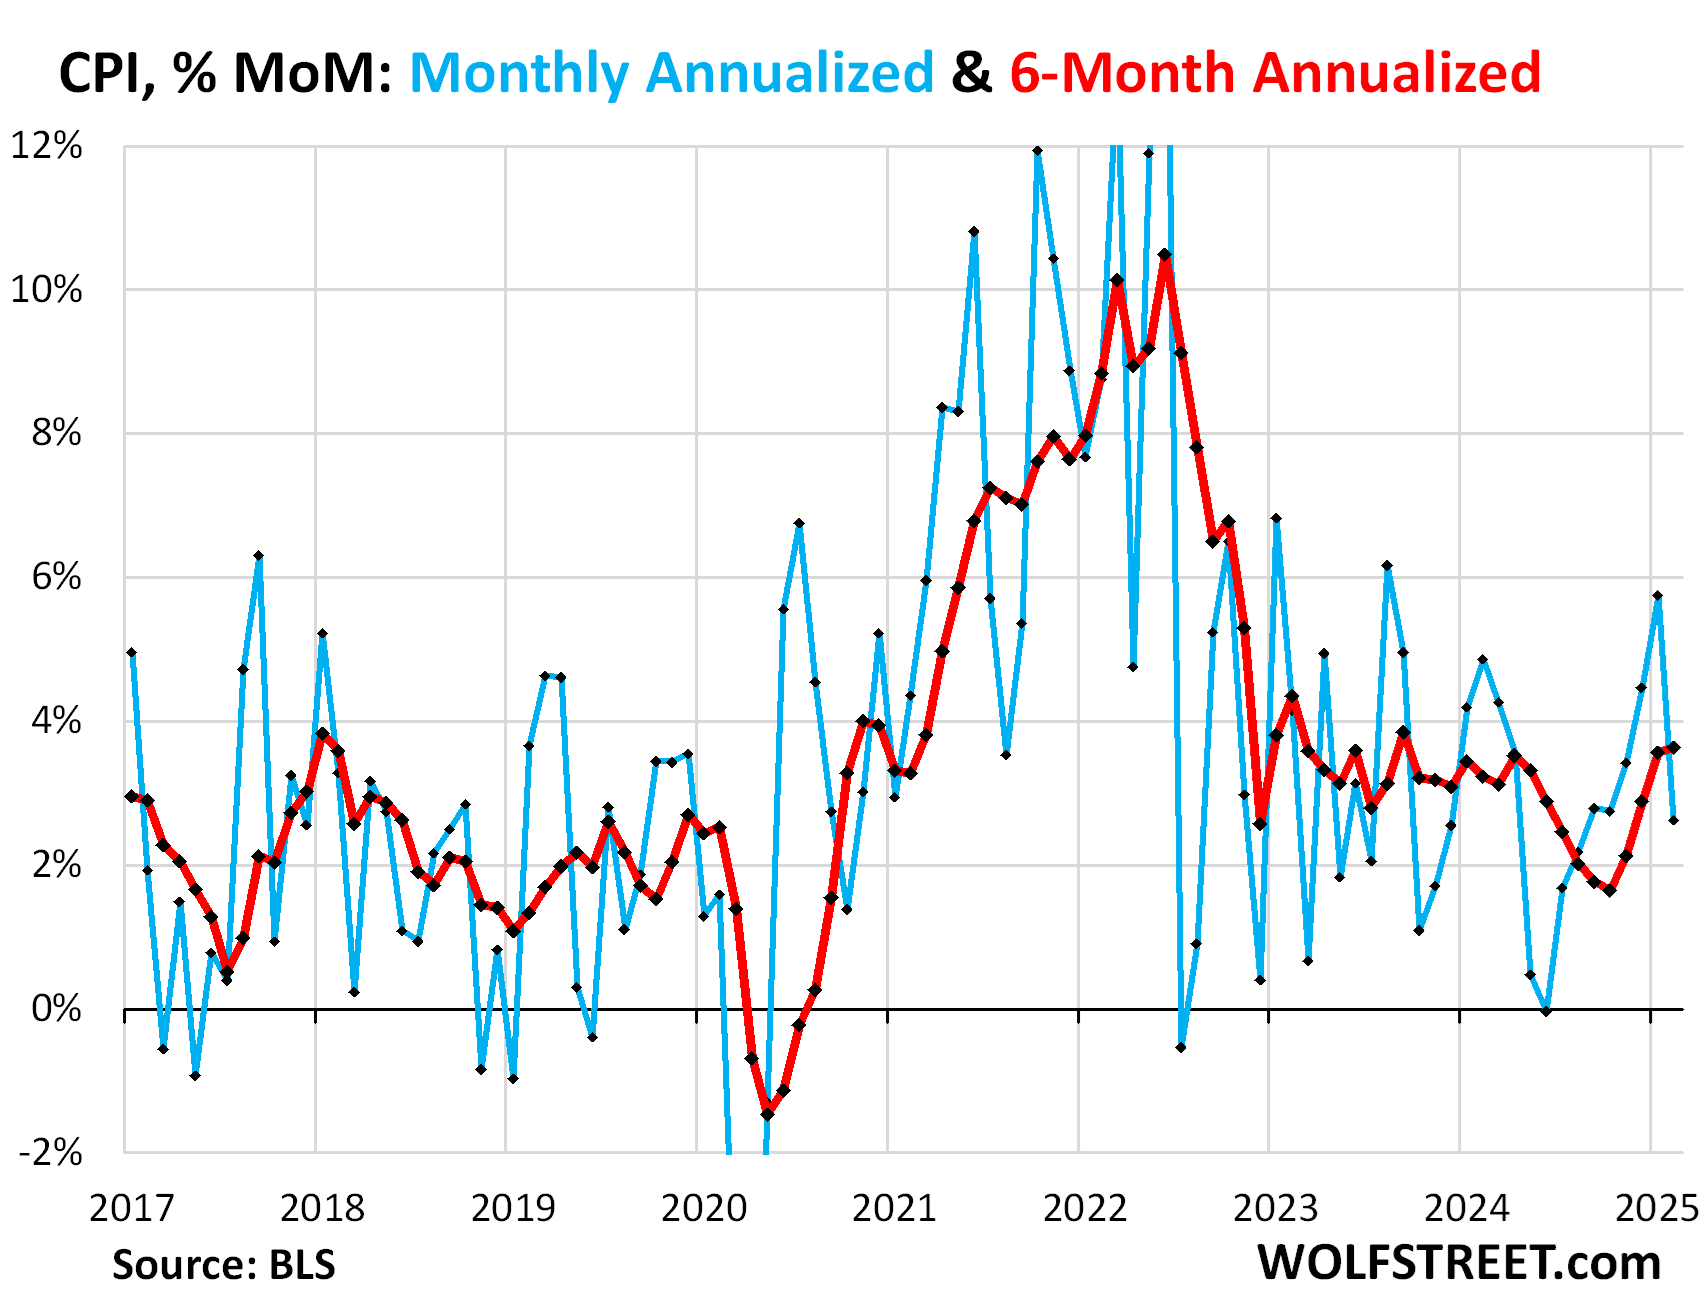
The overall Consumer Price Index rose by 0.22% (+2.62% annualized) in February from January, after the jump of 0.47% (+5.75% annualized) in January from December, which had been the worst month-to-month increase since August 2023, and the sixth month of acceleration from the low point in June.
But the 6-month CPI accelerated further, rising by 3.63% annualized, the worst increase since September 2023 (red in the chart):
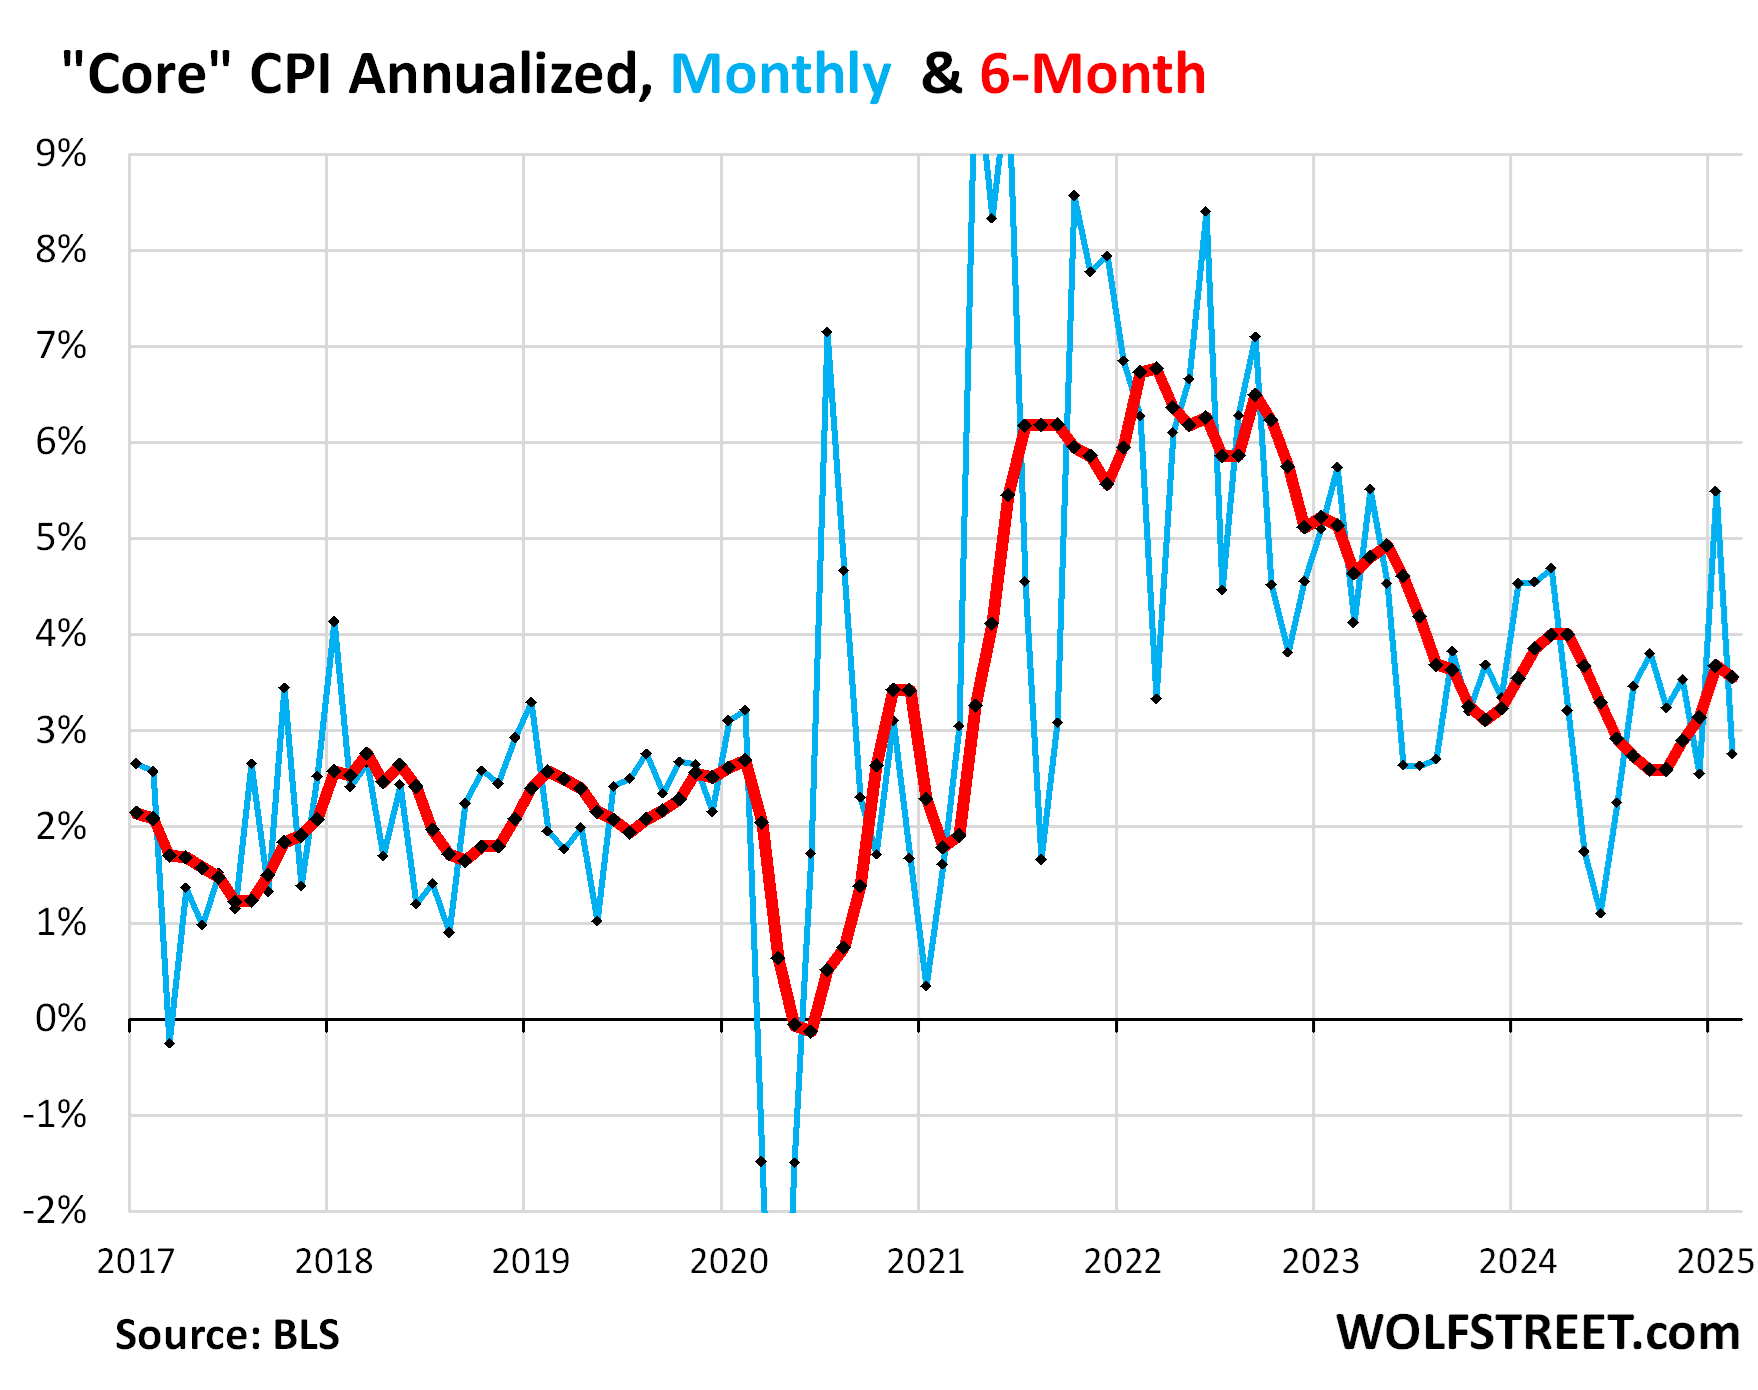
The “Core” CPI, which excludes food and energy components to track underlying inflation, rose by 0.23% (+2.7% annualized) in February from January, after the jump of 0.45% (+5.5% annualized) in January from December, which had been the worst increase since April 2023, (blue in the chart below).
The 6-month “core” CPI rose by 3.6% annualized, a slight deceleration from the prior month (+3.7%), which had been the worst since May (red).
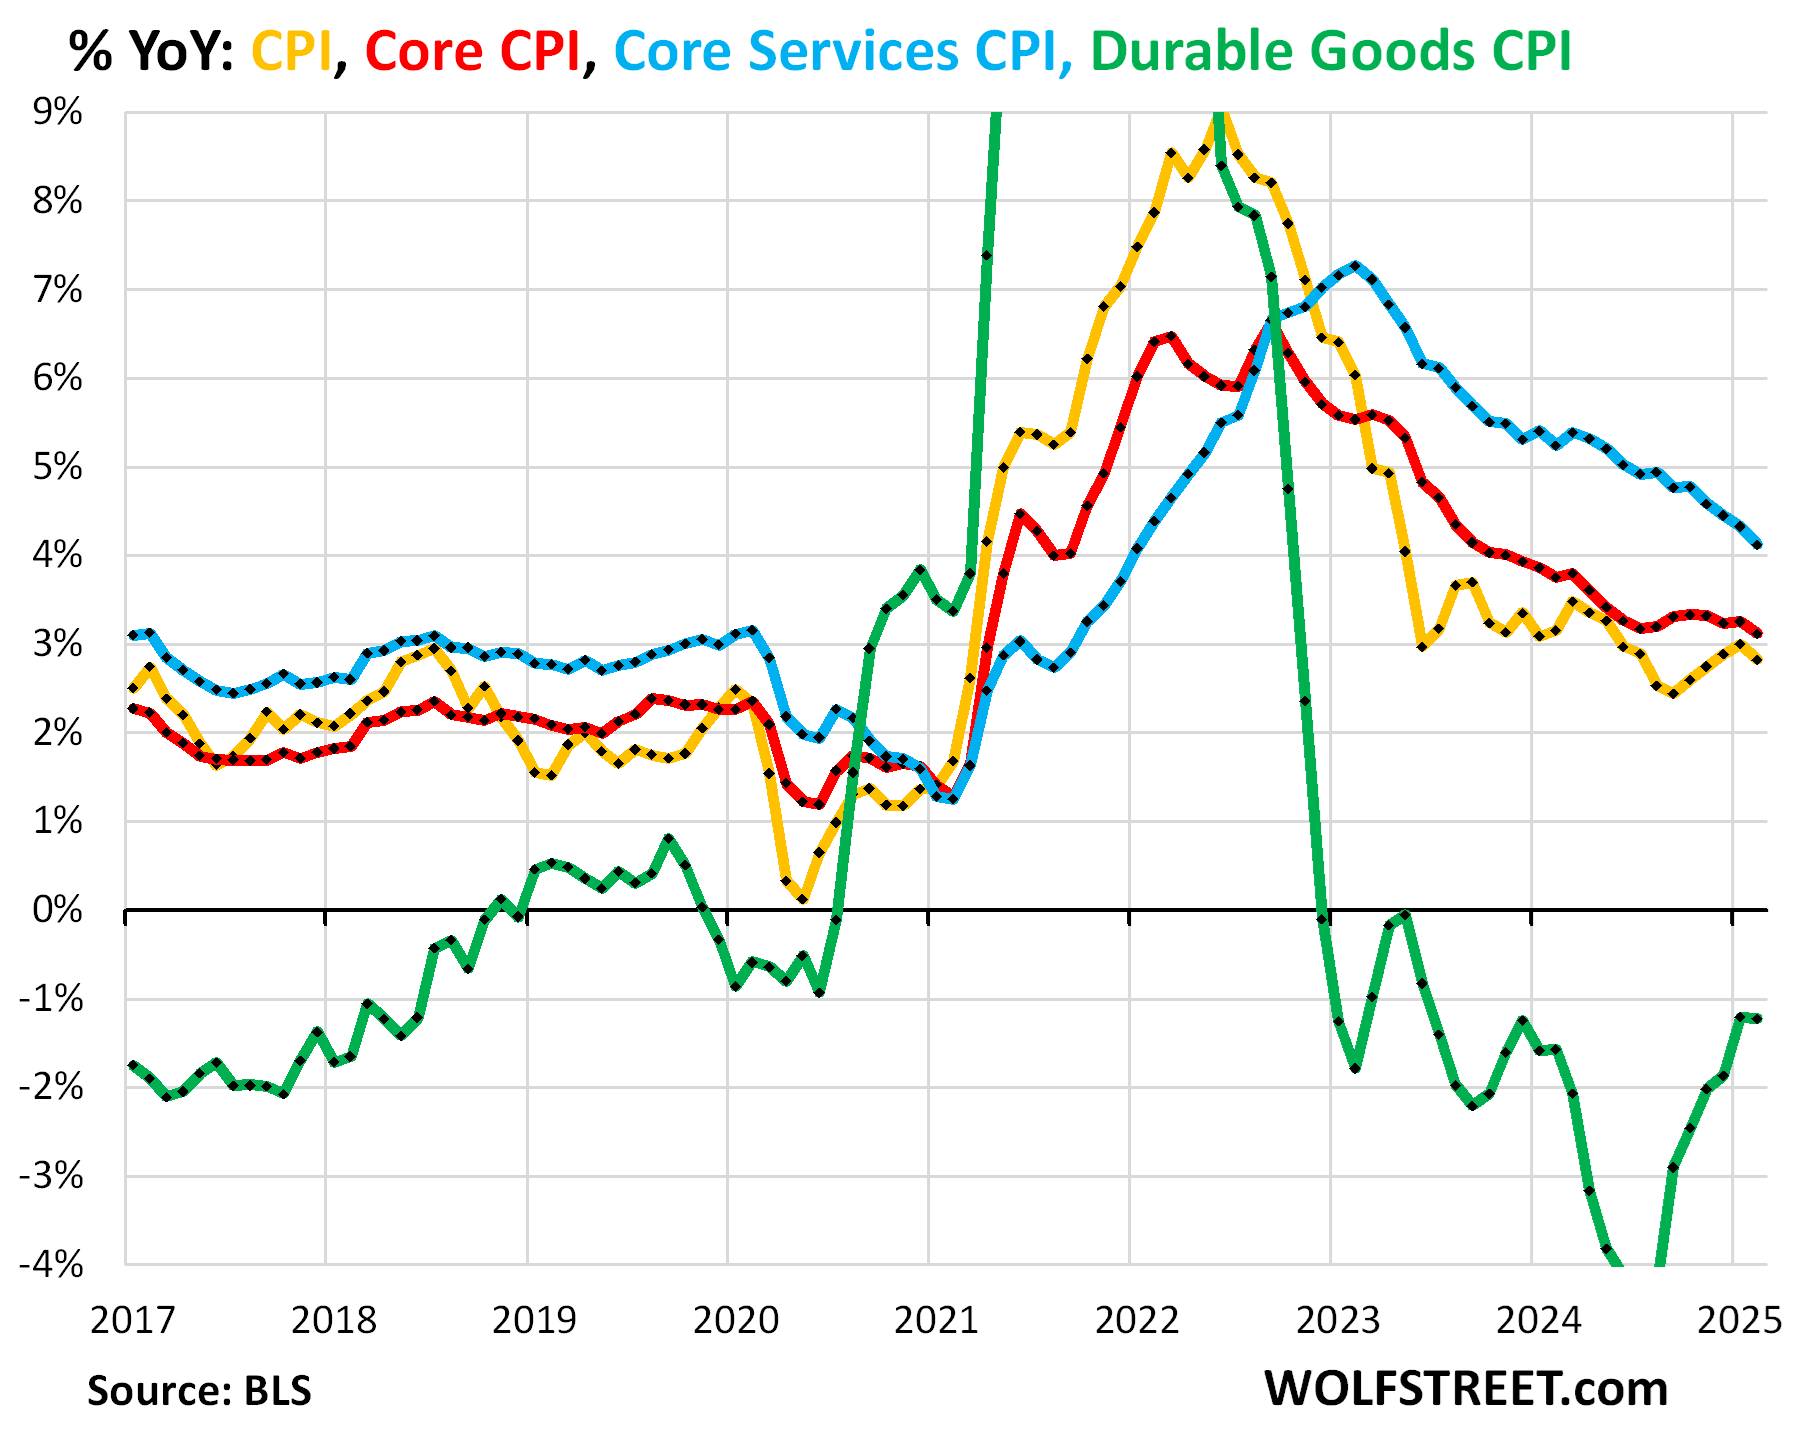
The major components, year-over-year:
- Overall CPI: +2.82% (yellow), deceleration from +3.0% in January.
- Core CPI +3.11% (red), deceleration from +3.26% in January. It has not improved at all since June 2024
- Core Services CPI: +4.12% (blue), a deceleration from +4.33% in January.
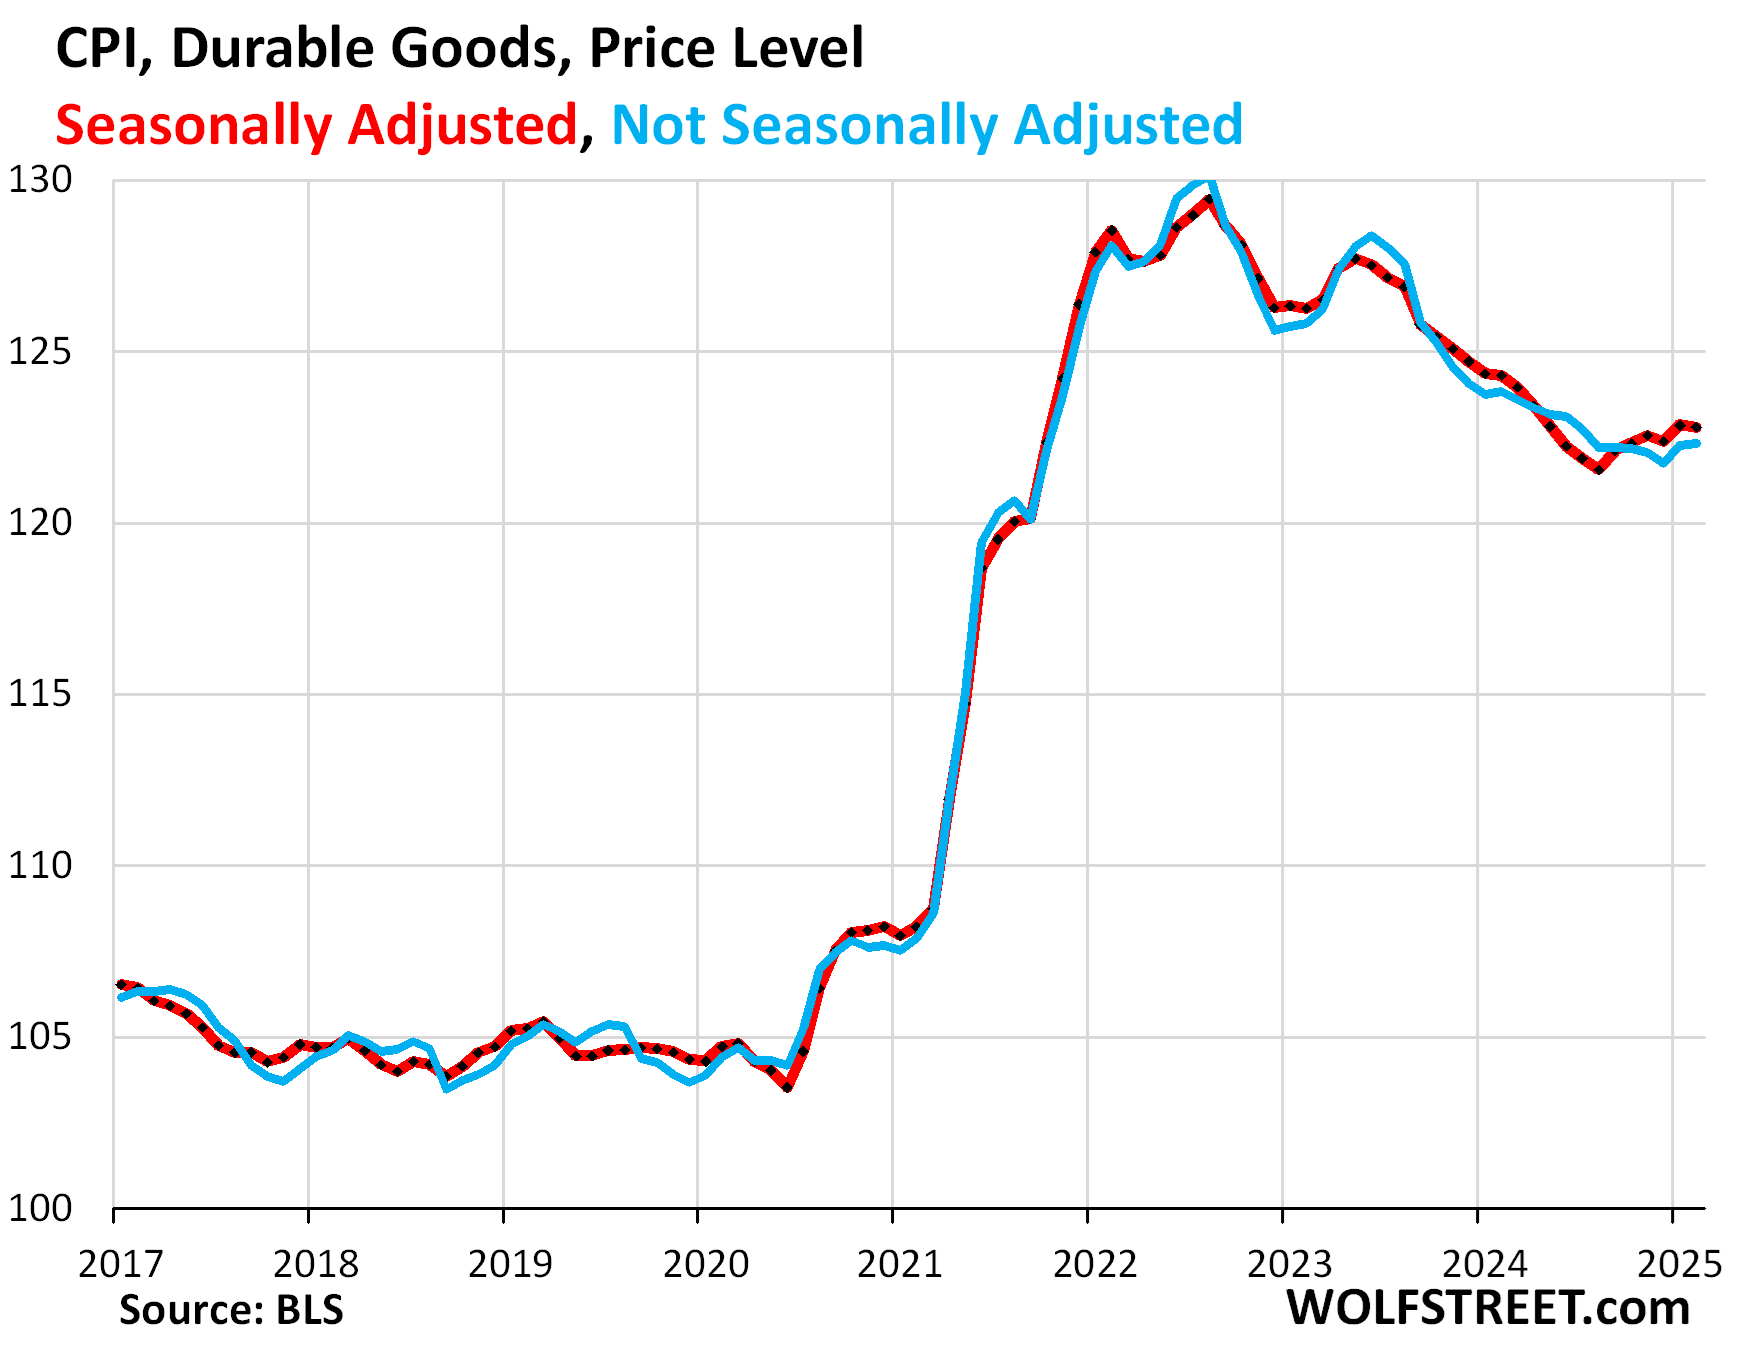
- Durable goods CPI: -1.23% (green), essentially same decline as in January.
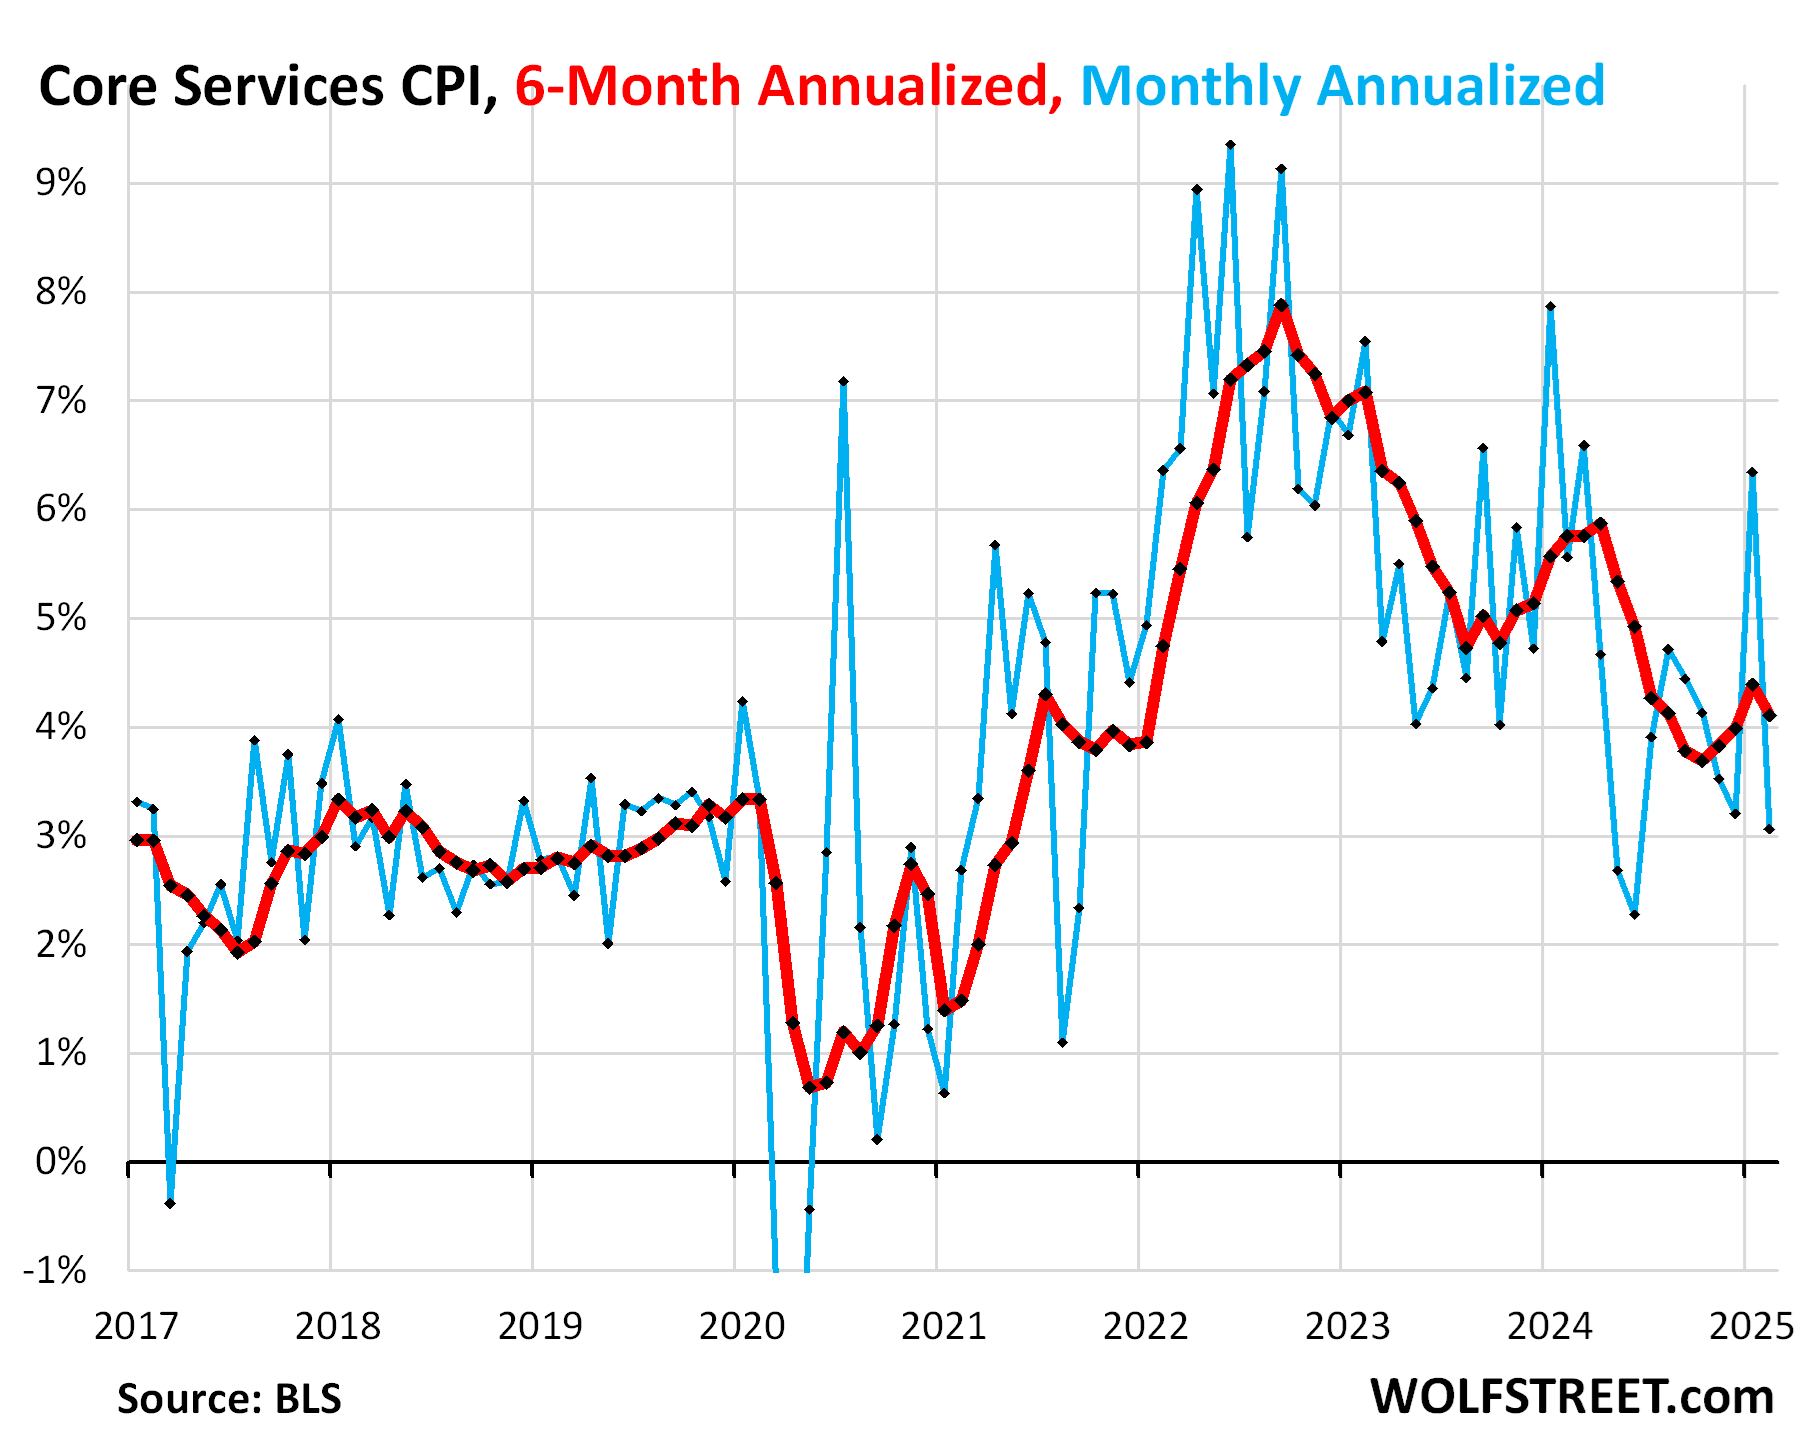
“Core services” CPI.
Core services CPI, which are all services less energy services, and accounts for about two-thirds of the overall CPI, rose by 0.25% in February from January (3.1% annualized, a sharp deceleration from the spike in the prior month (+6.4% annualized), which had been the worst increase in 11 months (blue line in the chart below).
The 6-month core services CPI rose by 4.1% annualized, a deceleration from January (+4.4%), which had the worst since June (red).
What we noted a month ago was that some services raise their prices annually in January, which can help produce the spikes of the services CPI in January. But we did not see those kinds of January price spikes before the pandemic:
Housing components of core services.
Owners’ Equivalent of Rent CPI decelerated to +3.4% annualized in February from January (+0.28% not annualized).
But the three-month average accelerated to +3.68% annualized.
OER indirectly reflects the expenses of homeownership: homeowners’ insurance, HOA fees, property taxes, and maintenance. It’s the only measure for those expenses in the CPI. It is based on what a large group of homeowners estimates their home would rent for, with the assumption that a homeowner would want to recoup their cost increases by raising the rent.
As a stand-in for homeowners’ insurance, HOA fees, property taxes, and maintenance costs, OER accounts for 26.2% of overall CPI and estimates inflation of shelter as a service for homeowners.

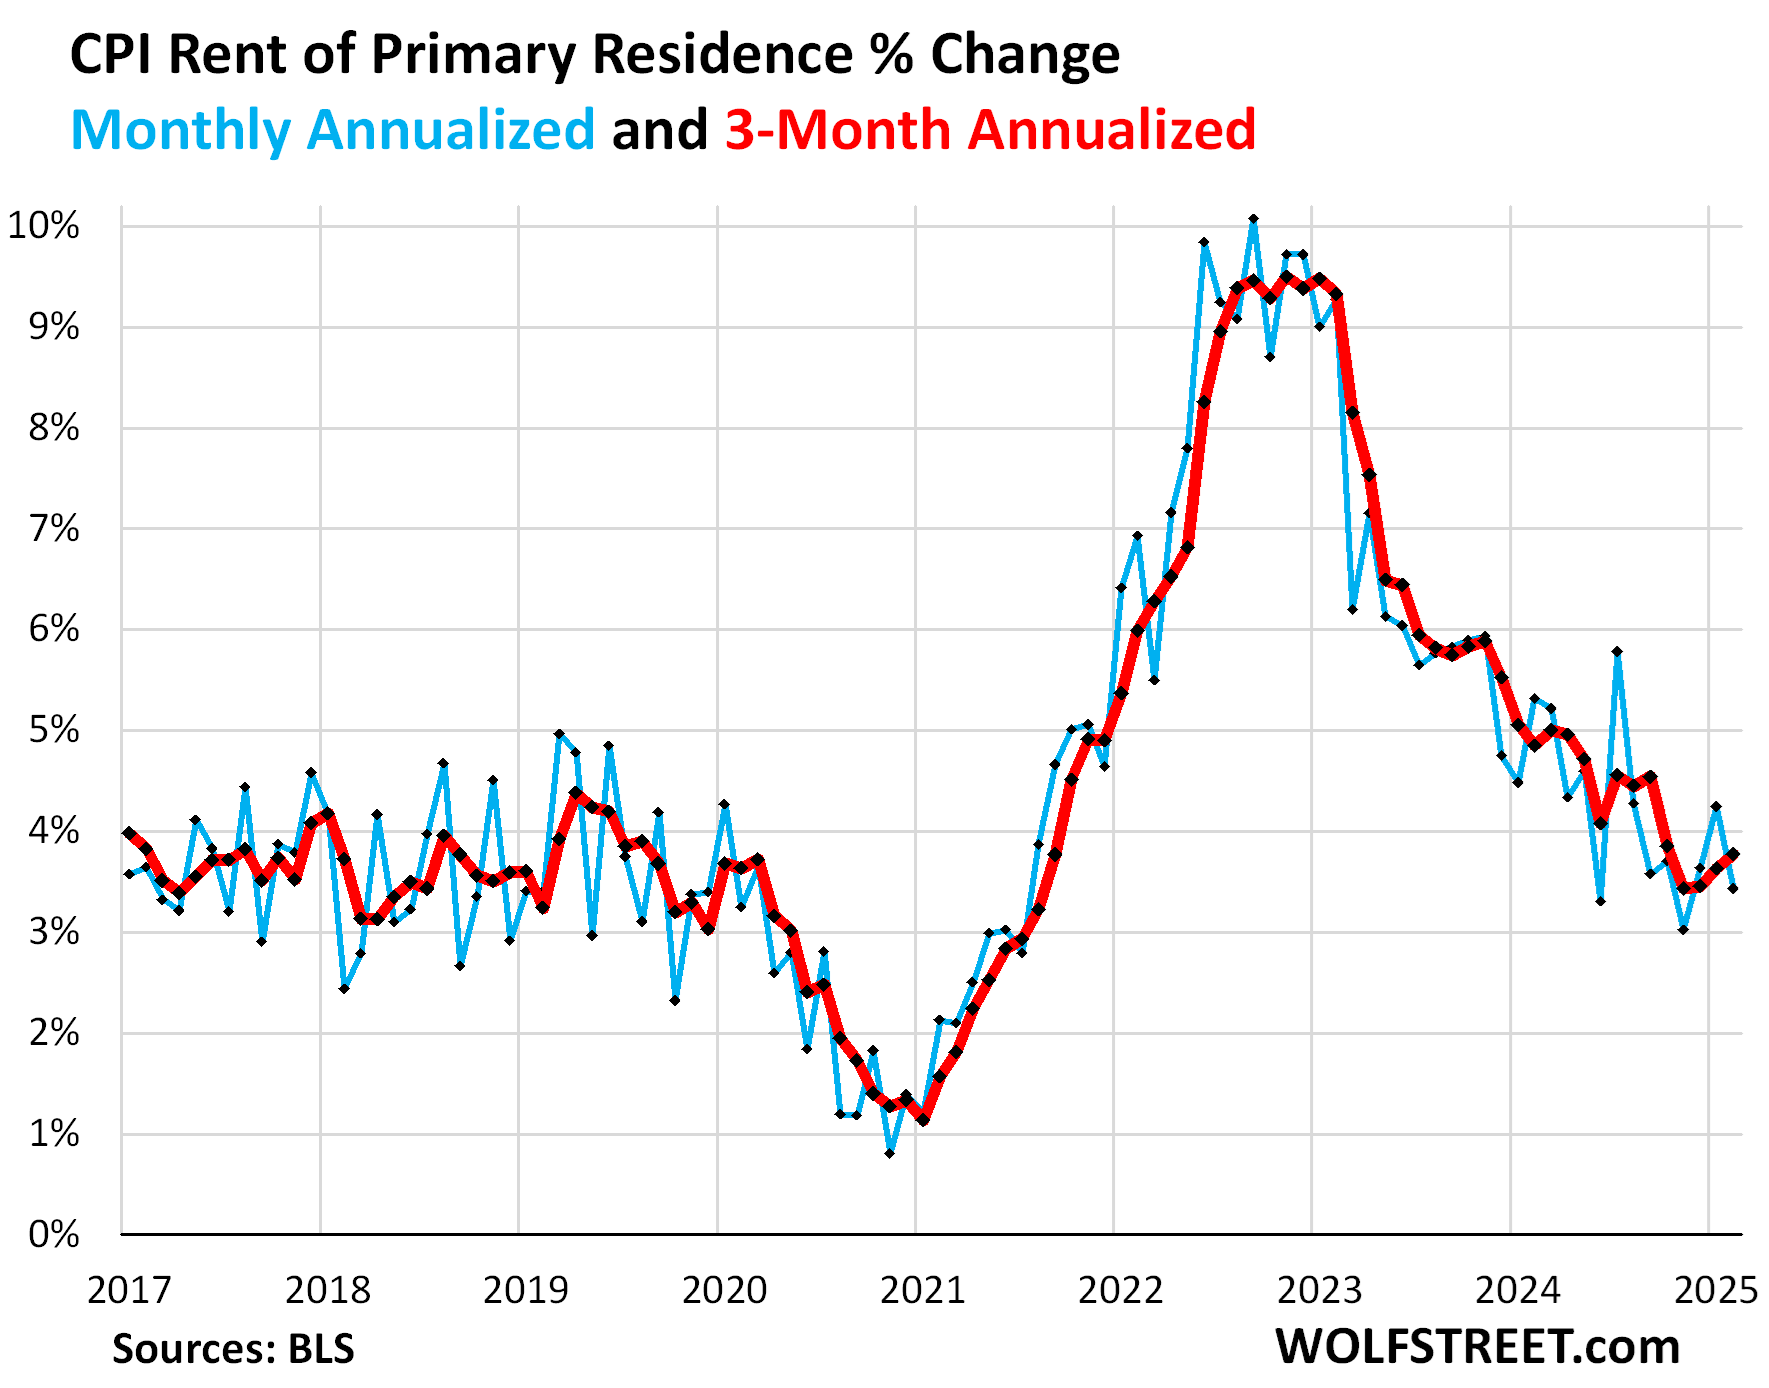
Rent of Primary Residence CPI decelerated to +3.4% annualized in February from January.
But the 3-month rate accelerated to +3.8% annualized, the worst increase in four months. This rate is in the upper end of the range before the pandemic.
Rent CPI accounts for 7.5% of overall CPI. It is based on rents that tenants actually paid, not on asking rents of advertised vacant units for rent. The survey follows the same large group of rental houses and apartments over time and tracks the rents that the current tenants, who come and go, pay in rent for these units.
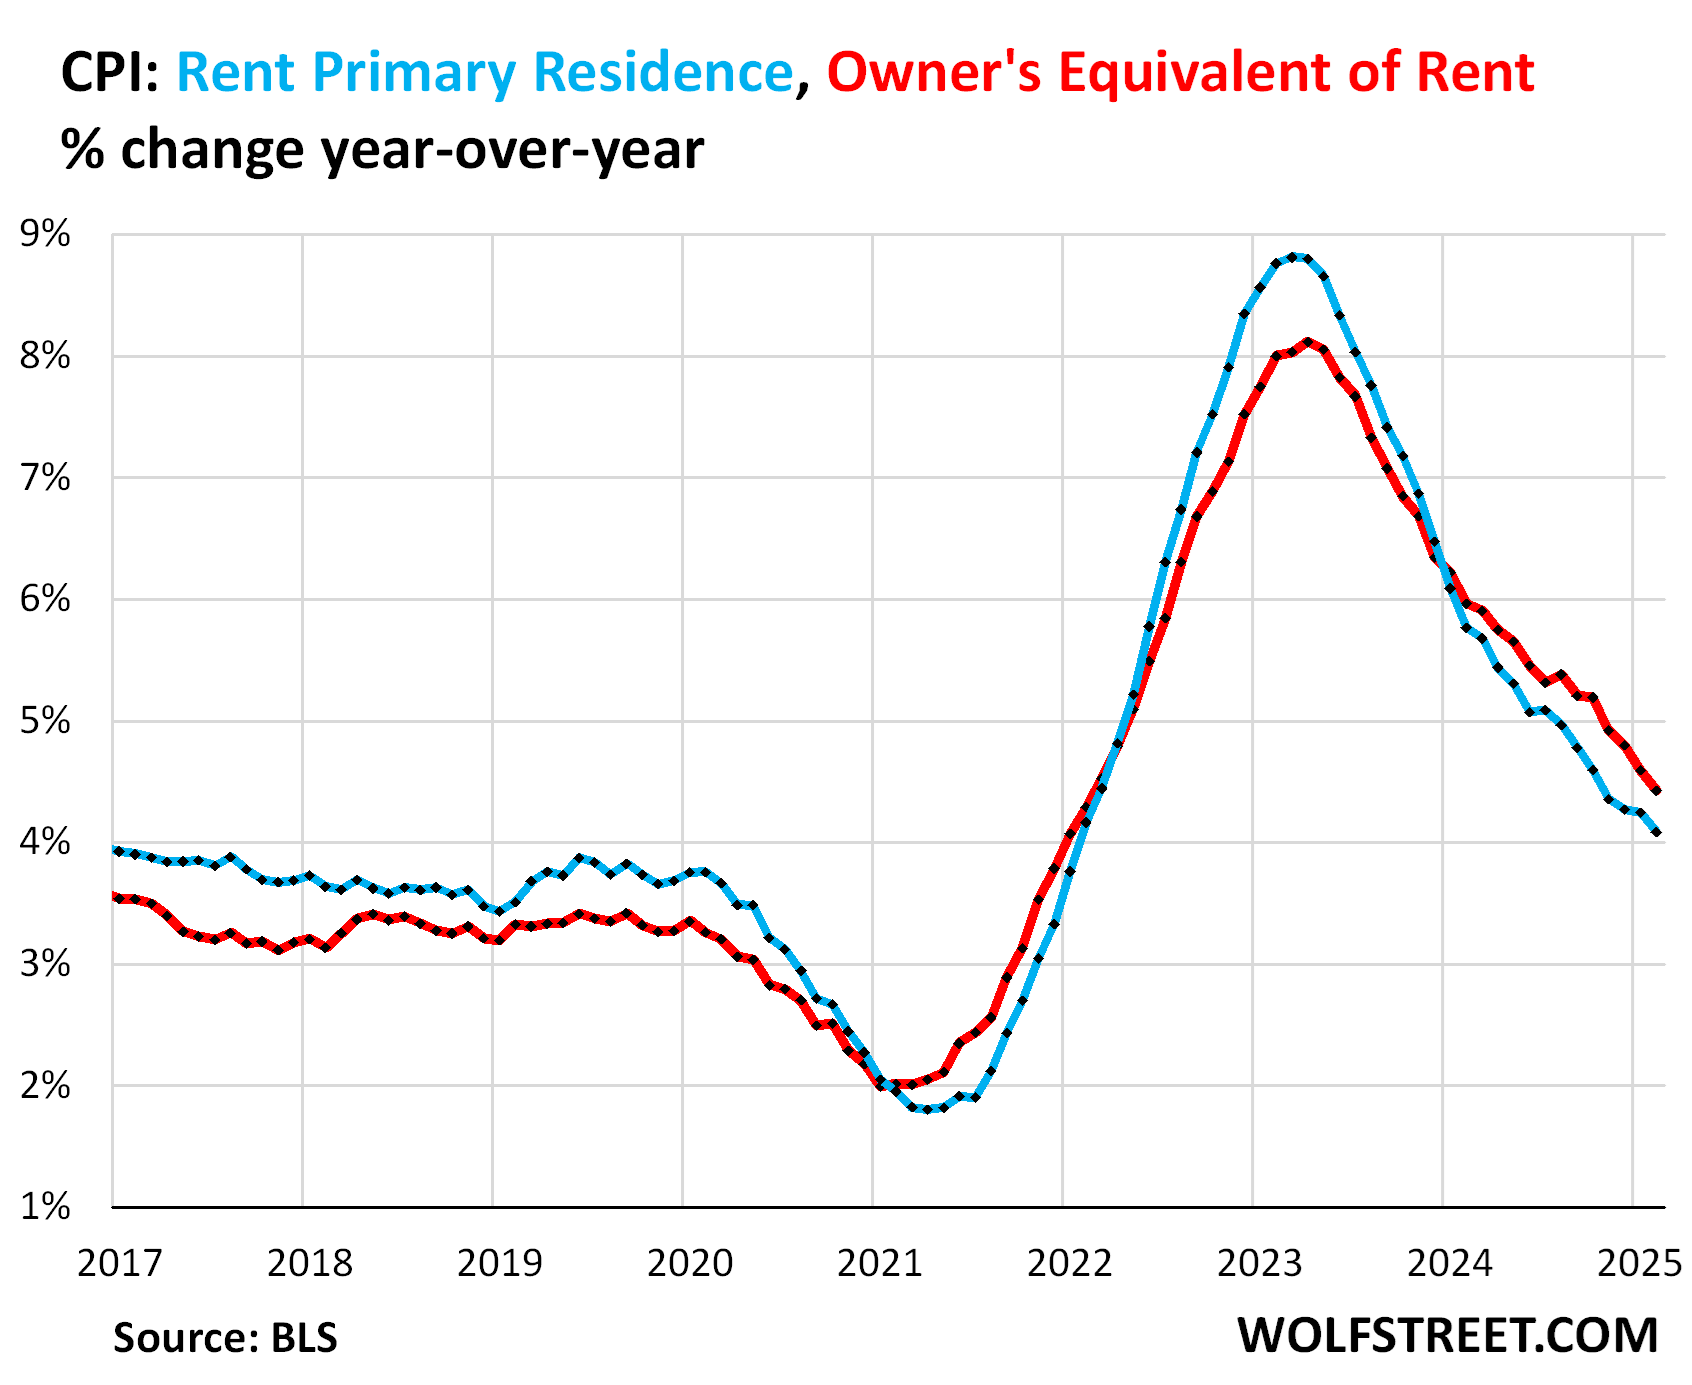
Year-over-year, rent CPI (blue in the chart below) rose by 4.1%, and OER by 4.4% (red), both continuing to decelerate on a year-over-year basis.
“Asking rents…” The Zillow Observed Rent Index (ZORI) and other private-sector rent indices track “asking rents,” which are advertised rents of vacant units on the market for rent. Because rentals don’t turn over that much, the spike in asking rents through mid-2022 never fully translated into the CPI indices because not many people actually ended up paying those jacked-up asking rents.
For January, the ZORI (seasonally adjusted) rose by 0.31% month-to-month and by 3.5% year-over-year. Zillow has not yet released the February data.
The chart shows the CPI Rent of Primary Residence (blue, left scale) as index value, not percentage change; and the ZORI in dollars (red, right scale). The left and right axes are set so that they both increase each by 55% from January 2017:
- Since January 2017: ZORI +52%, CPI Rent +42%.
- Since January 2020: ZORI +34%, CPI Rent +27%.

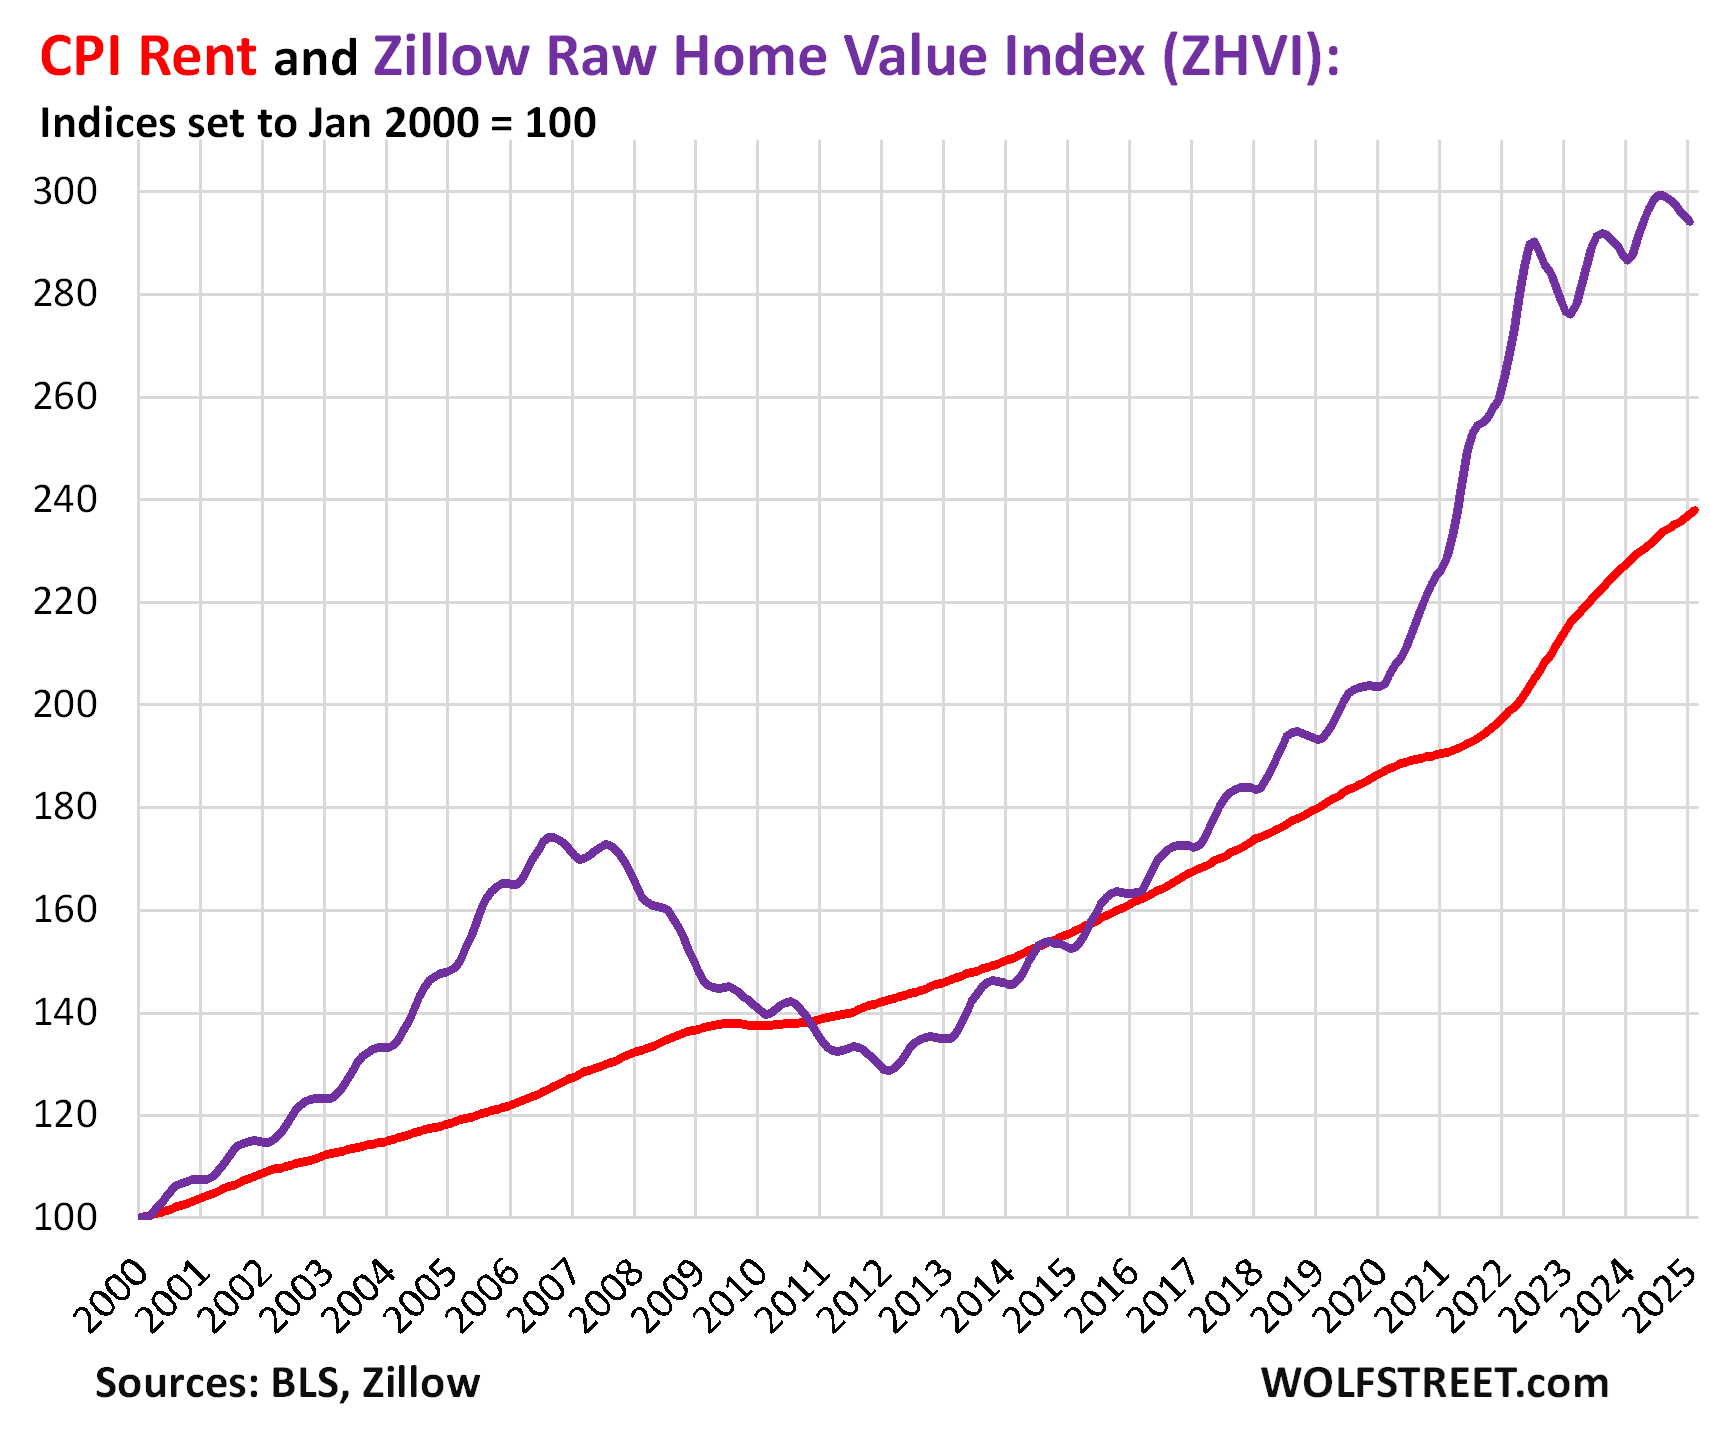
Rent inflation vs. home-price inflation: The red line in the chart below represents the CPI for Rent of Primary Residence as index value. The purple line represents Zillow’s “raw” Home Value Index for the US. Both indexes are set to 100 for January 2000 [but each metro dances to their own drummer… The Most Splendid Housing Bubbles in America, Jan 2025: The Price Drops & Gains in 33 of the Largest Housing Markets].
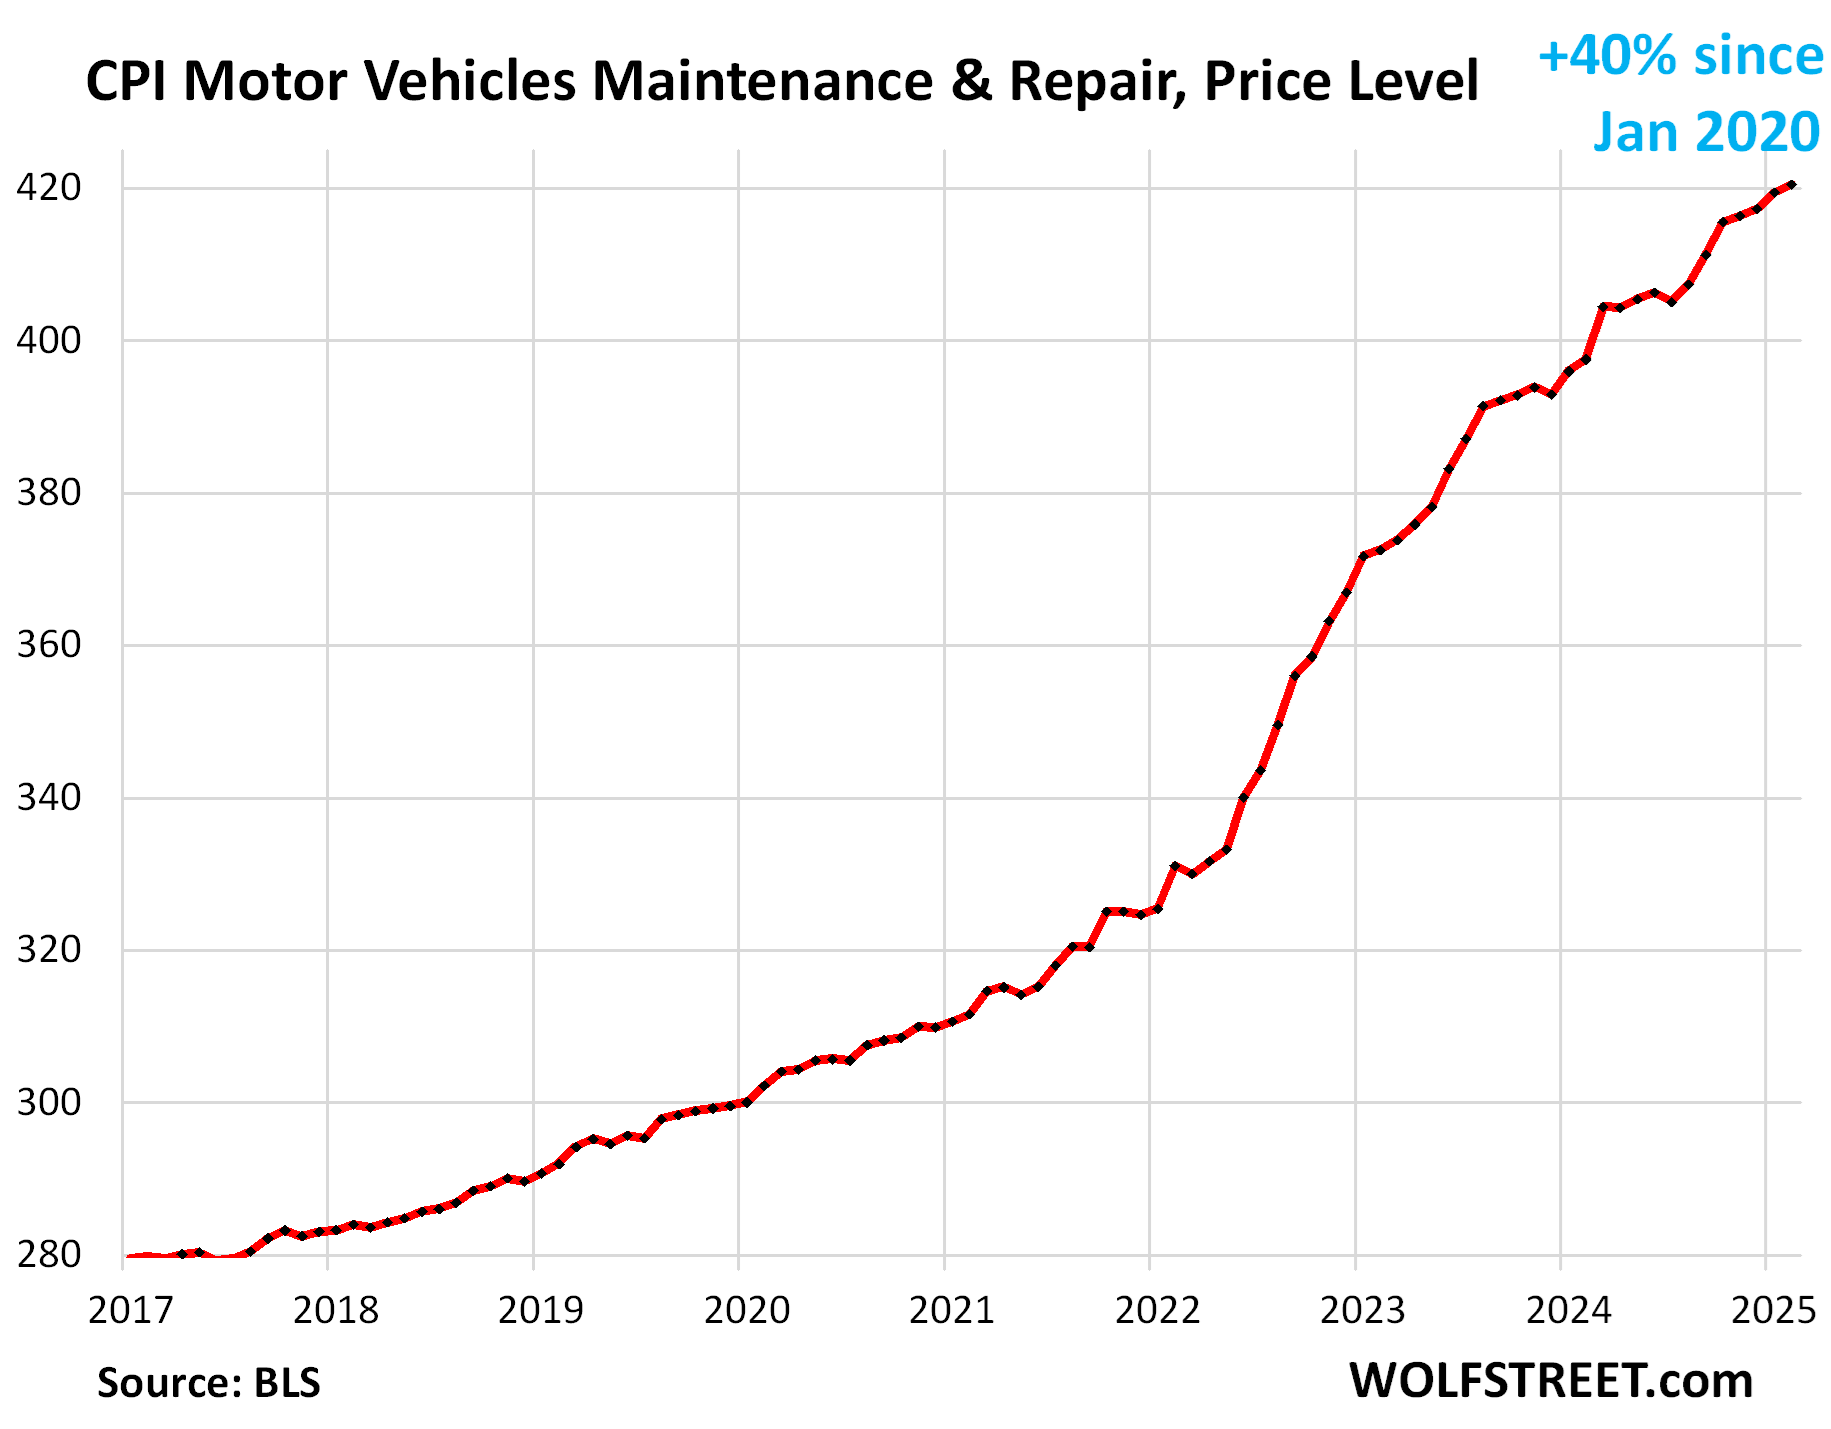
The CPI for motor-vehicle maintenance & repair rose by 3.1% annualized in February from January. Year-over-year, the index rose by 5.8%. Since January 2020, the index has surged by 40%. This chart shows the price level, not the year-over-year percentage change:
The CPI for motor vehicle insurance rose by 3.25% annualized in February from January, after the huge spike in the prior month. Year-over-year, the index surged by 11.1%, but that was a deceleration from the prior months and the least-bad increase since September 2022.
Since January 2022, motor vehicle insurance prices have exploded by 56%, fueled by the surge repair costs and the historic spike in used vehicle prices in 2021 and 2022, which increases the replacement costs for insurance companies.

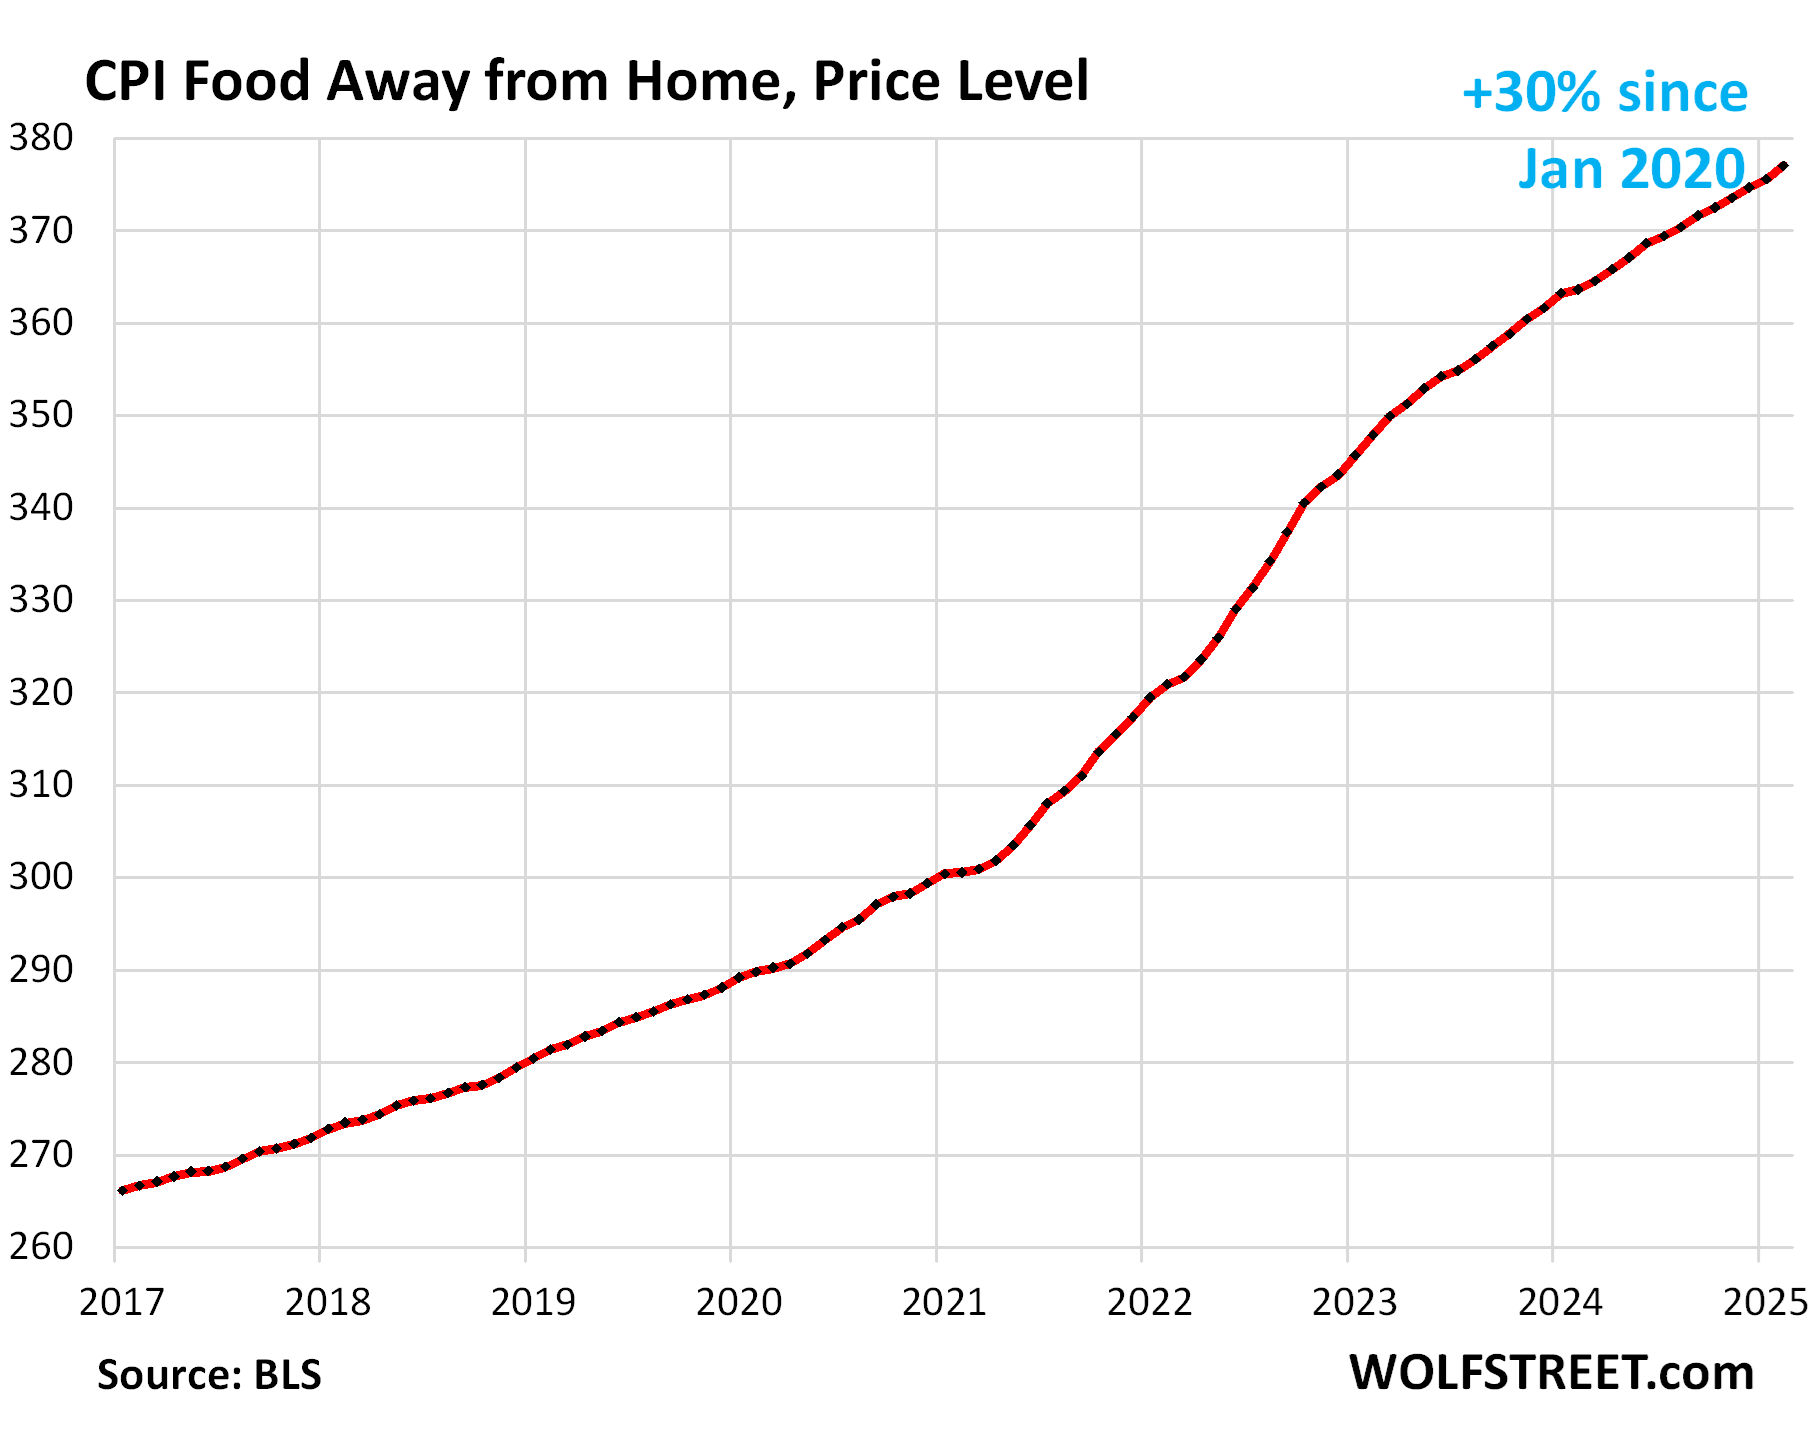
Food away from Home CPI jumped by 4.8% annualized in February from January. On a year-over-year basis, the index accelerated to +3.7%, worst increase since October.
These food services include full-service and limited-service meals and snacks served away from home, such as in restaurants, cafeterias, at stalls, etc.
The table below shows the major categories of “core services.” Combined, they accounted for 64% of total CPI:
| Major Services ex. Energy Services | Weight in CPI | MoM | YoY |
| Core Services | 64% | 0.3% | 4.8% |
| Owner’s equivalent of rent | 26.2% | 0.3% | 4.4% |
| Rent of primary residence | 7.5% | 0.3% | 4.1% |
| Medical care services & insurance | 6.7% | 0.3% | 3.0% |
| Food services (food away from home) | 5.6% | 0.4% | 3.7% |
| Motor vehicle insurance | 2.8% | 0.3% | 11.1% |
| Education (tuition, childcare, school fees) | 2.5% | 0.2% | 3.5% |
| Admission, movies, concerts, sports events, club memberships | 2.1% | 0.6% | 4.3% |
| Other personal services (dry-cleaning, haircuts, legal services…) | 1.6% | 0.9% | 3.8% |
| Public transportation (airline fares, etc.) | 1.5% | -3.4% | -0.6% |
| Telephone & wireless services | 1.5% | 0.1% | 0.1% |
| Lodging away from home, incl Hotels, motels | 1.3% | 0.2% | 3.5% |
| Water, sewer, trash collection services | 1.1% | 1.0% | 4.9% |
| Motor vehicle maintenance & repair | 1.0% | 0.3% | 5.8% |
| Internet services | 0.9% | 1.1% | -0.7% |
| Video and audio services, cable, streaming | 0.8% | 1.0% | 3.7% |
| Pet services, including veterinary | 0.5% | 0.1% | 5.9% |
| Tenants’ & Household insurance | 0.4% | 0.8% | 3.0% |
| Car and truck rental | 0.1% | -1.3% | -7.1% |
| Postage & delivery services | 0.1% | -2.7% | 3.0% |
Prices of Goods.
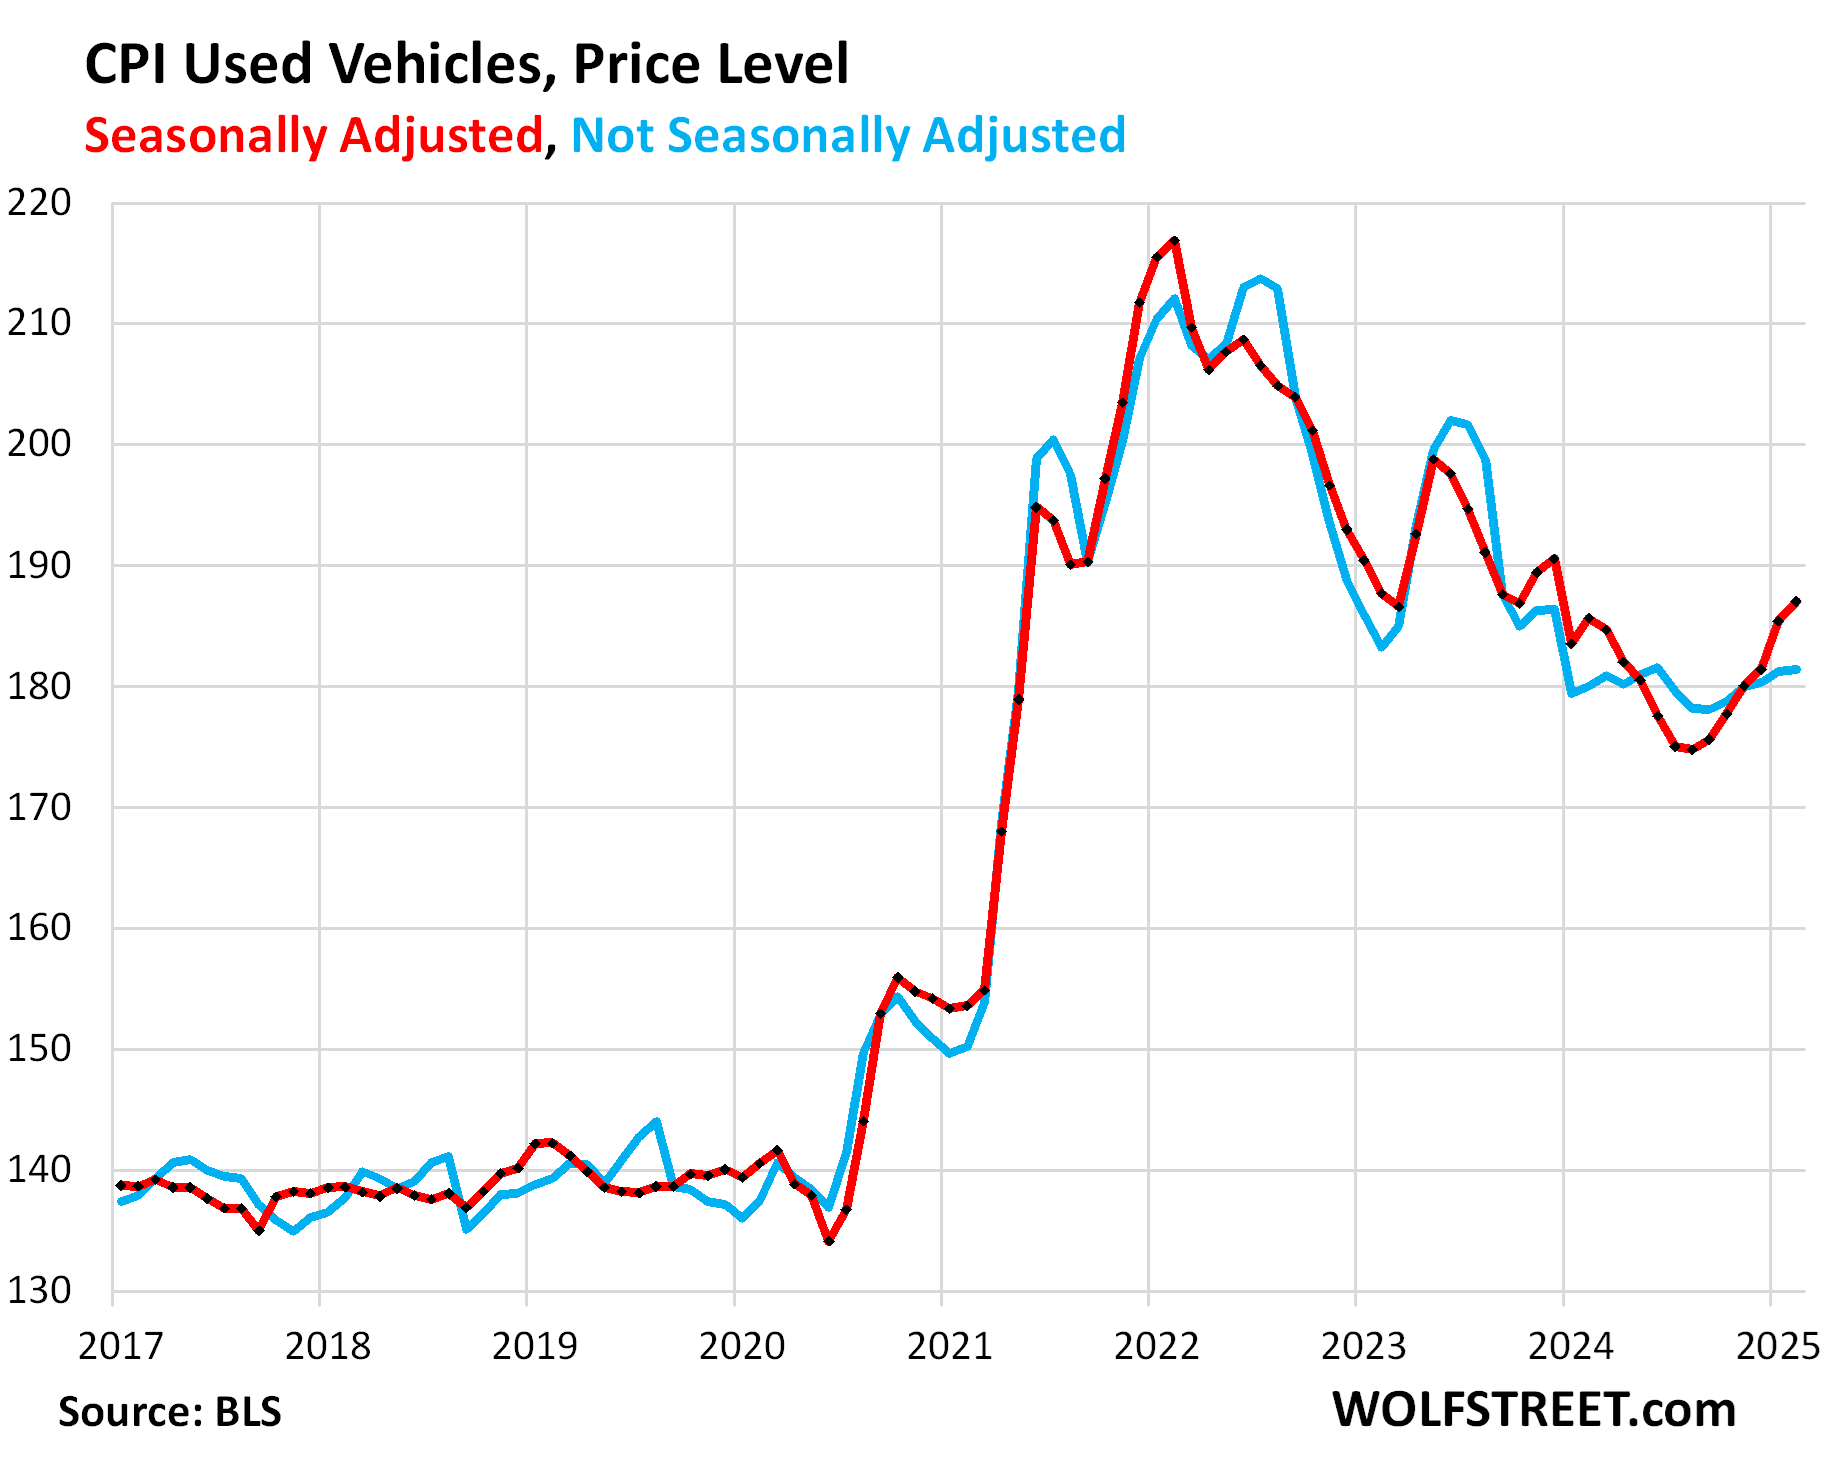
The used vehicle CPI jumped by 0.9% not annualized (+11.1% annualized) in February from January, seasonally adjusted, the sixth month-to-month increase in a row.
Year-over-year, used vehicle prices rose by 0.8%, the second month in a row of year-over-year increases, after steep declines topping out at 10% year-over-year drops last summer.
The historic plunge of used vehicle prices from early 2022 through August 2024 was one of the factors in the cooling of CPI inflation over that period. That’s now over.
Since January 2020, prices are up by 34%, despite the plunge from early 2022 through August 2024.
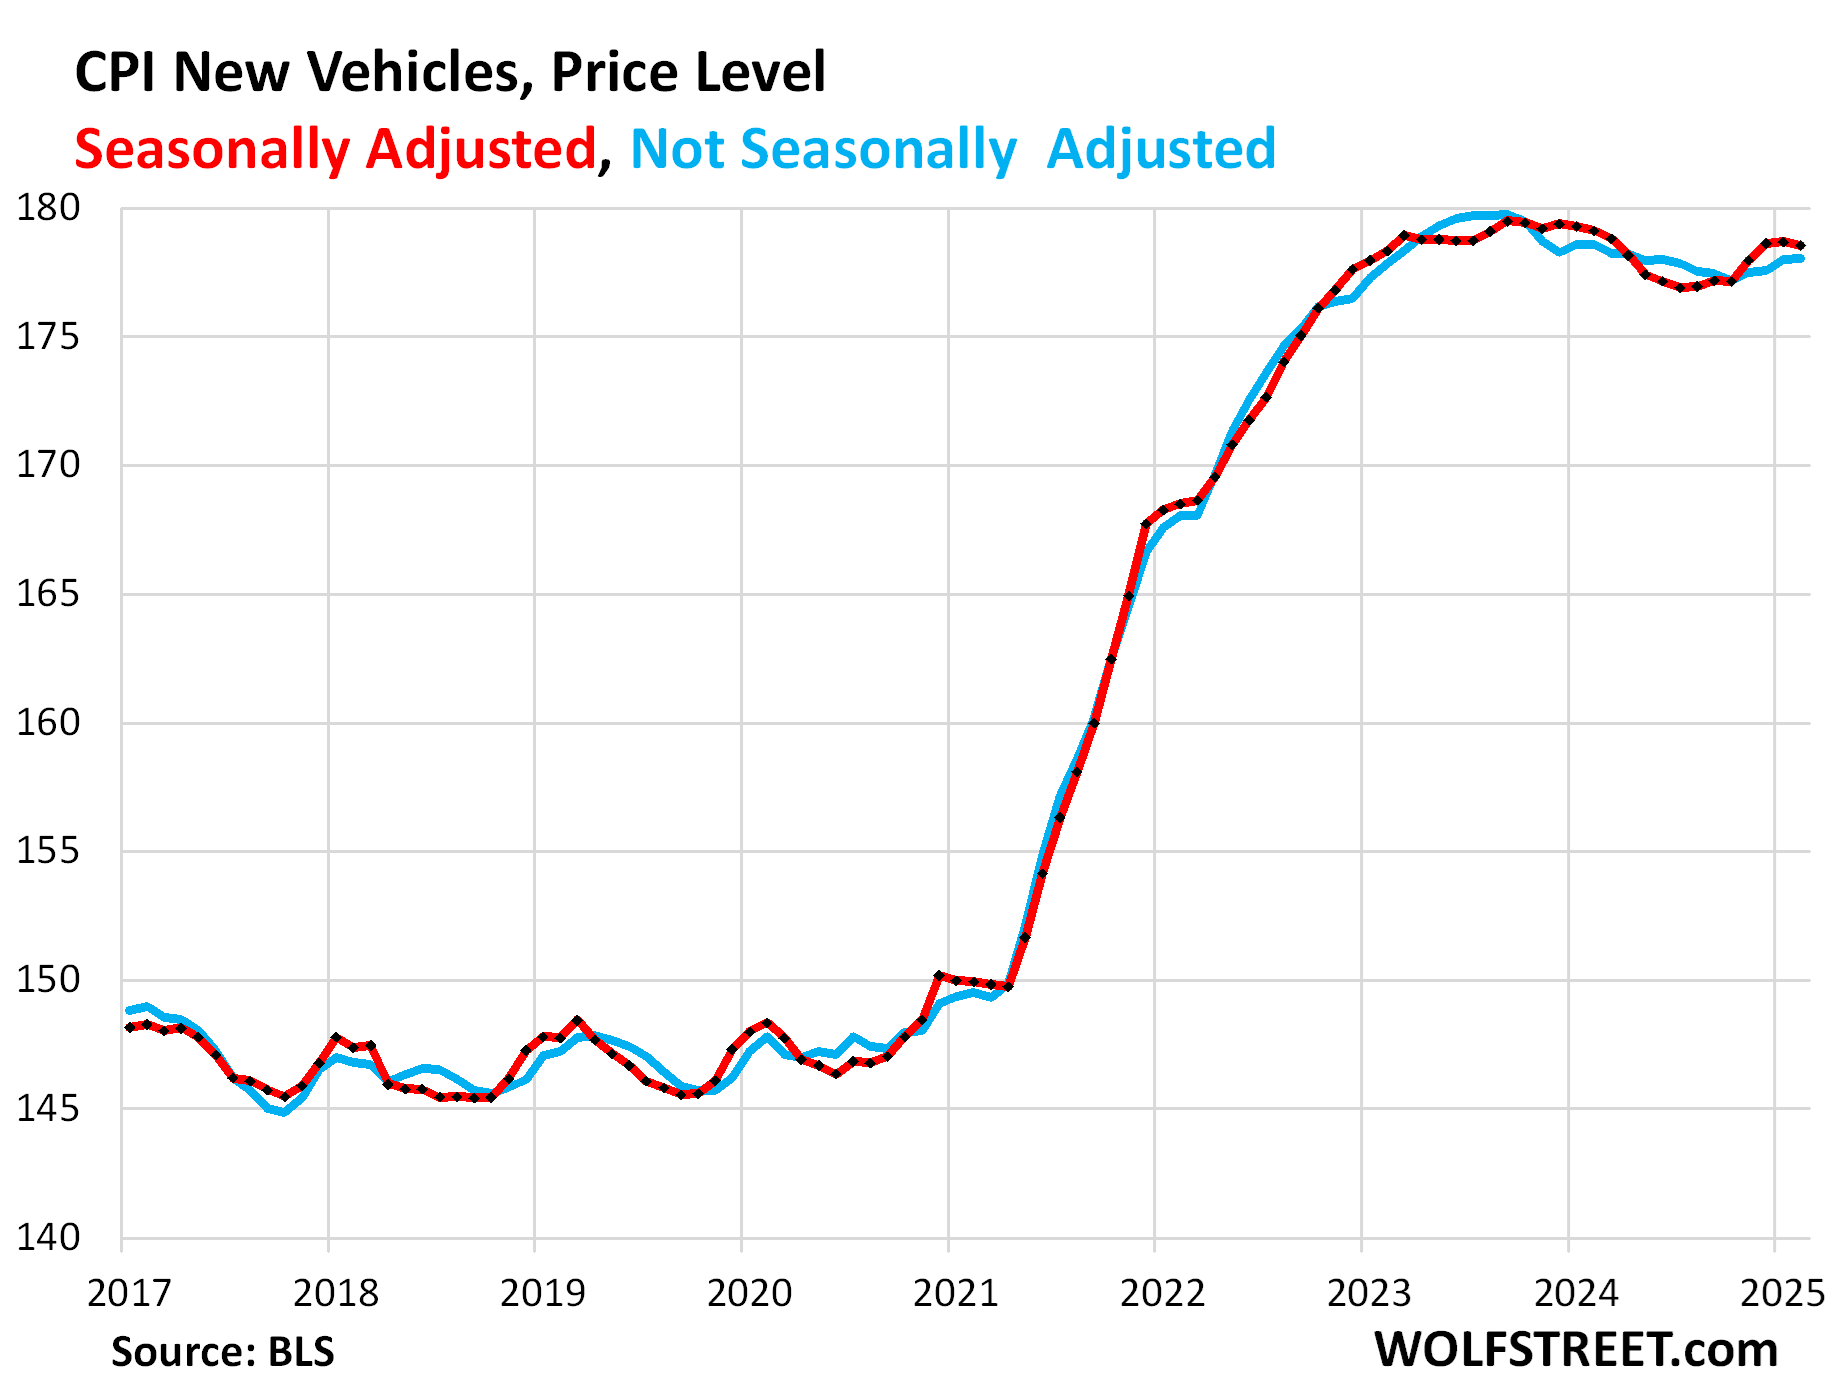
New vehicles CPI edged down a hair in February from January, seasonally adjusted. Year-over-year, the index edged down by 0.3%.
New-vehicle prices have proven to be sticky, unlike used-vehicle prices, despite lots of supply of new vehicles now on many lots. Automakers and dealers are giving their darndest to preserve their profit margins while maintaining unit sales.
It’s hard to imagine how they’re going to pass on tariffs without crushing their sales in this environment, which is why certain US automakers that have offshored the most, such as Ford, are so upset about the tariffs: They know they have to eat them. They know they cannot pass them on without seriously damaging their sales.
Durable Goods – dominated by new and used vehicles – have experienced price declines (deflation) across the board, starting in mid- to late 2022, after the huge price spikes during the pandemic. But at least part of that has ended now:
| Major durable goods categories | MoM | YoY |
| Durable goods overall | -0.1% | -1.2% |
| New vehicles | -0.1% | -0.3% |
| Used vehicles | 0.9% | 0.8% |
| Household furnishings (furniture, appliances, floor coverings, tools) | 0.2% | -0.4% |
| Sporting goods (bicycles, equipment, etc.) | -2.2% | -5.3% |
| Information technology (computers, smartphones, etc.) | -0.2% | -8.6% |
Food Inflation.
The CPI for “Food at home” was unchanged in February, after the big jump in January. This is food purchased at stores and markets and eaten off premises.
Year-over-year, the index rose by 1.8%. Since January 2020, food prices have surged by 28%.
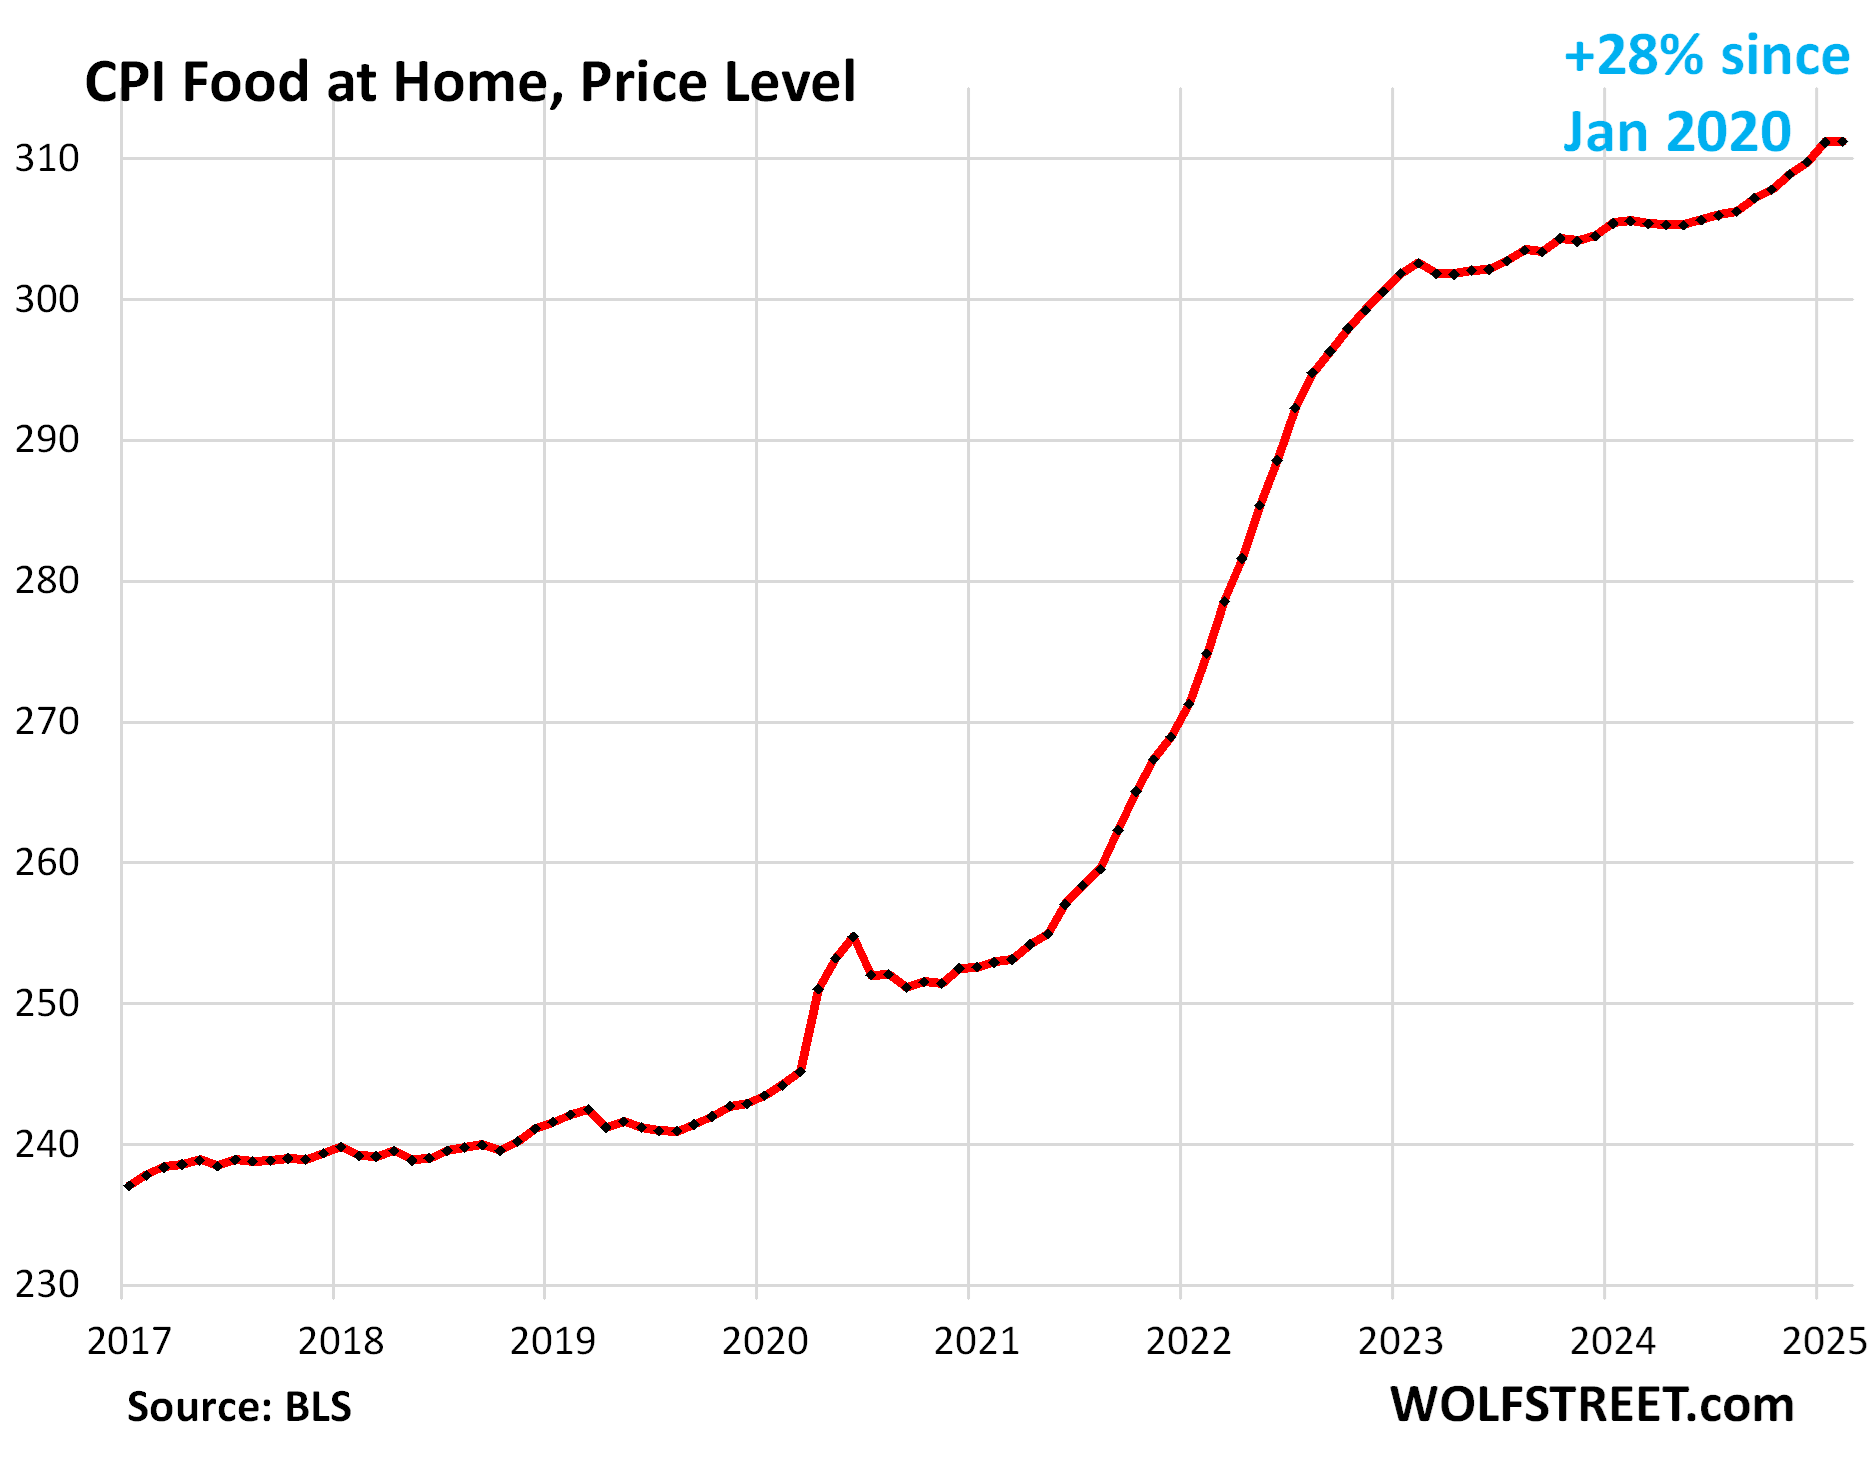
The avian-flu-triggered price spike of eggs, which started in early 2024, seems to have run its course and is beginning to cool.
Big month-to-month and year-over-year increases also occurred with beef, where prices already soared in prior years, and coffee.
| MoM | YoY | |
| Food at home | 0.0% | 1.9% |
| Cereals, breads, bakery products | 0.4% | 0.3% |
| Beef and veal | 2.4% | 7.6% |
| Pork | -1.4% | 1.8% |
| Poultry | -0.2% | 1.3% |
| Fish and seafood | 0.7% | 1.8% |
| Eggs | 10.4% | 58.8% |
| Dairy and related products | -1.0% | 0.8% |
| Fresh fruits | -0.8% | 1.9% |
| Fresh vegetables | -0.5% | -2.5% |
| Juices and nonalcoholic drinks | -0.8% | 1.3% |
| Coffee, tea, etc. | 1.8% | 6.0% |
| Fats and oils | -0.2% | -0.2% |
| Baby food & formula | -0.4% | 0.0% |
| Alcoholic beverages at home | 0.1% | 0.4% |
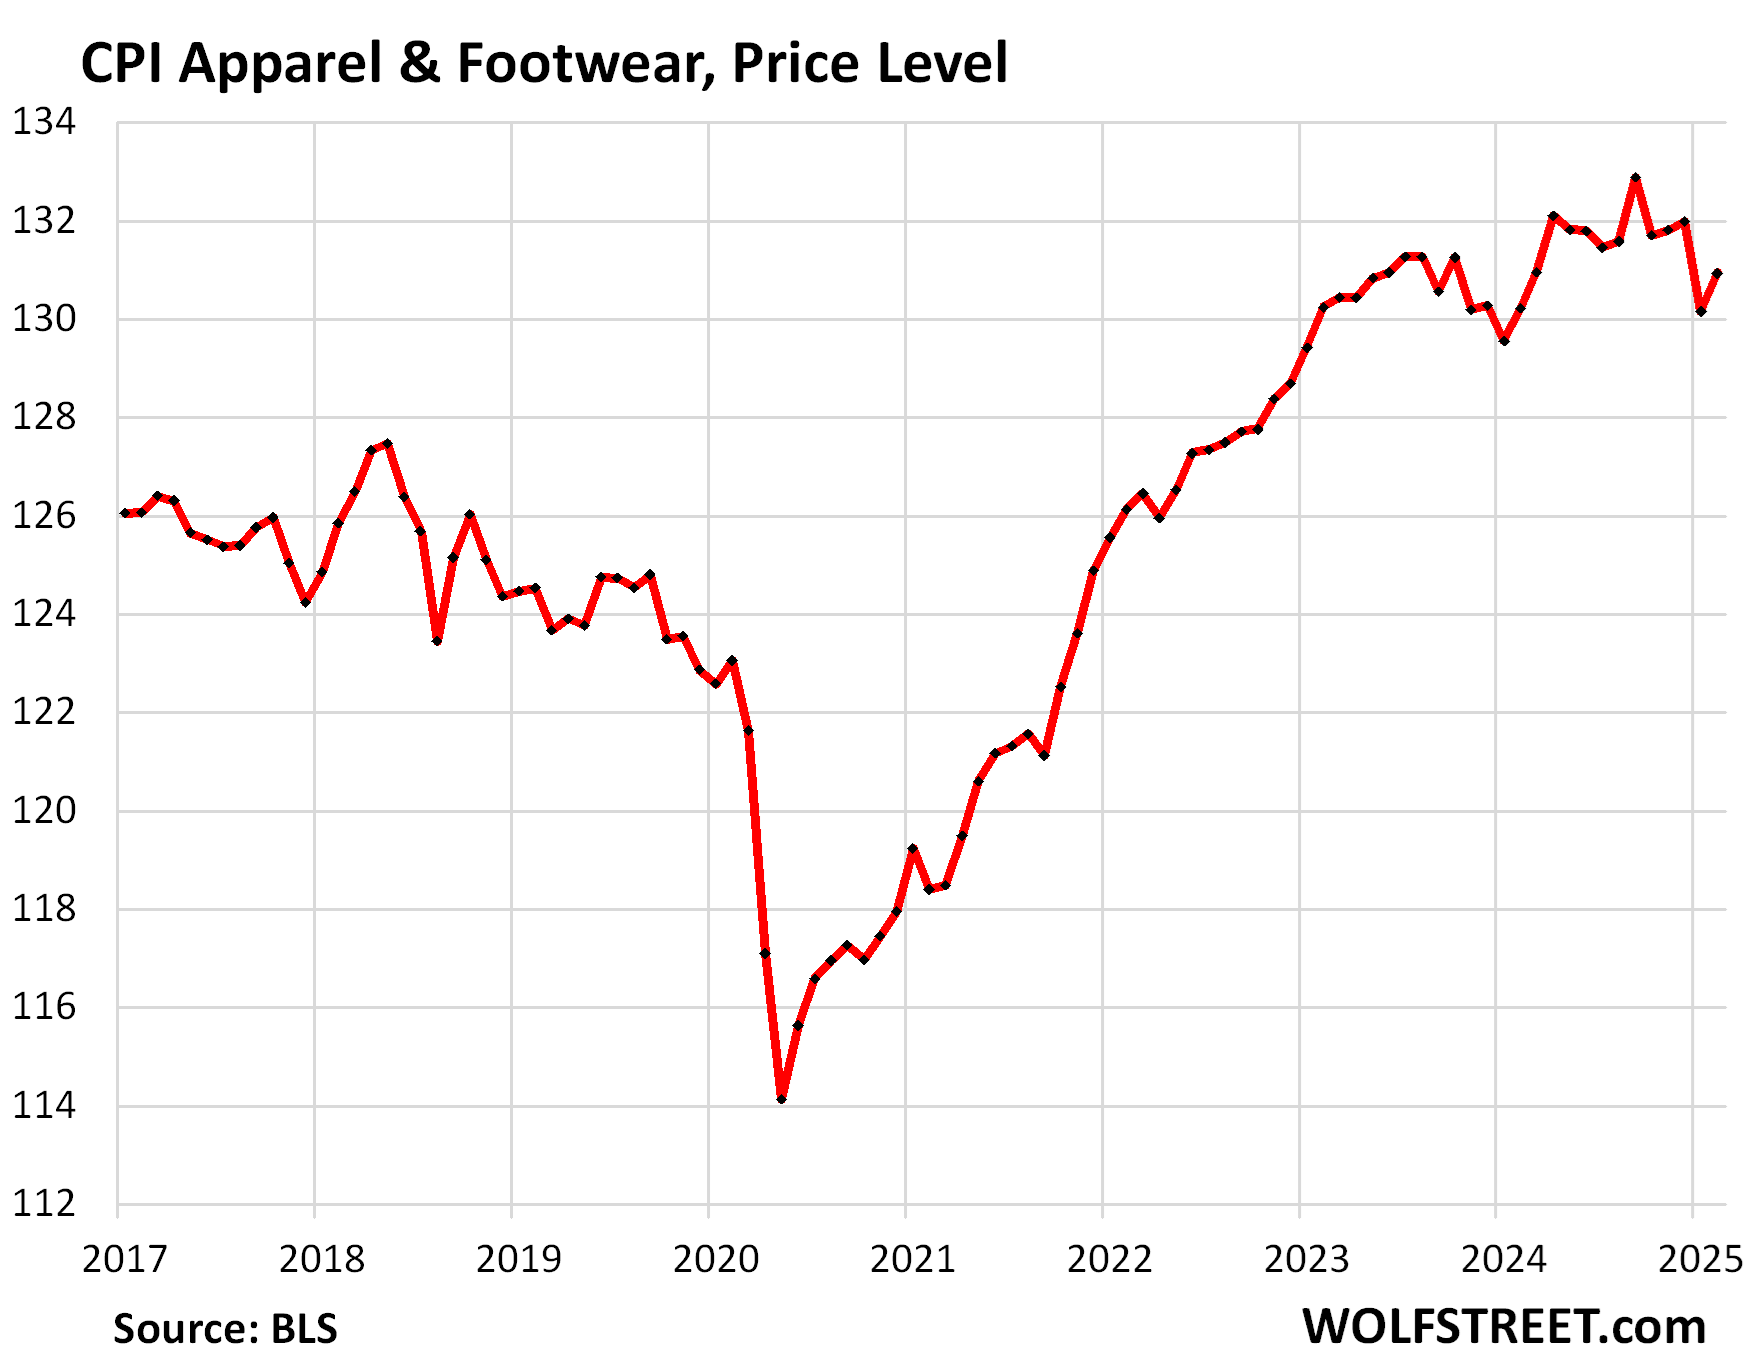
Apparel and footwear.
The CPI for apparel and footwear jumped by 0.6% (not annualized), undoing about half of the drop in the prior month. Year-over-year, the index rose 0.5%.
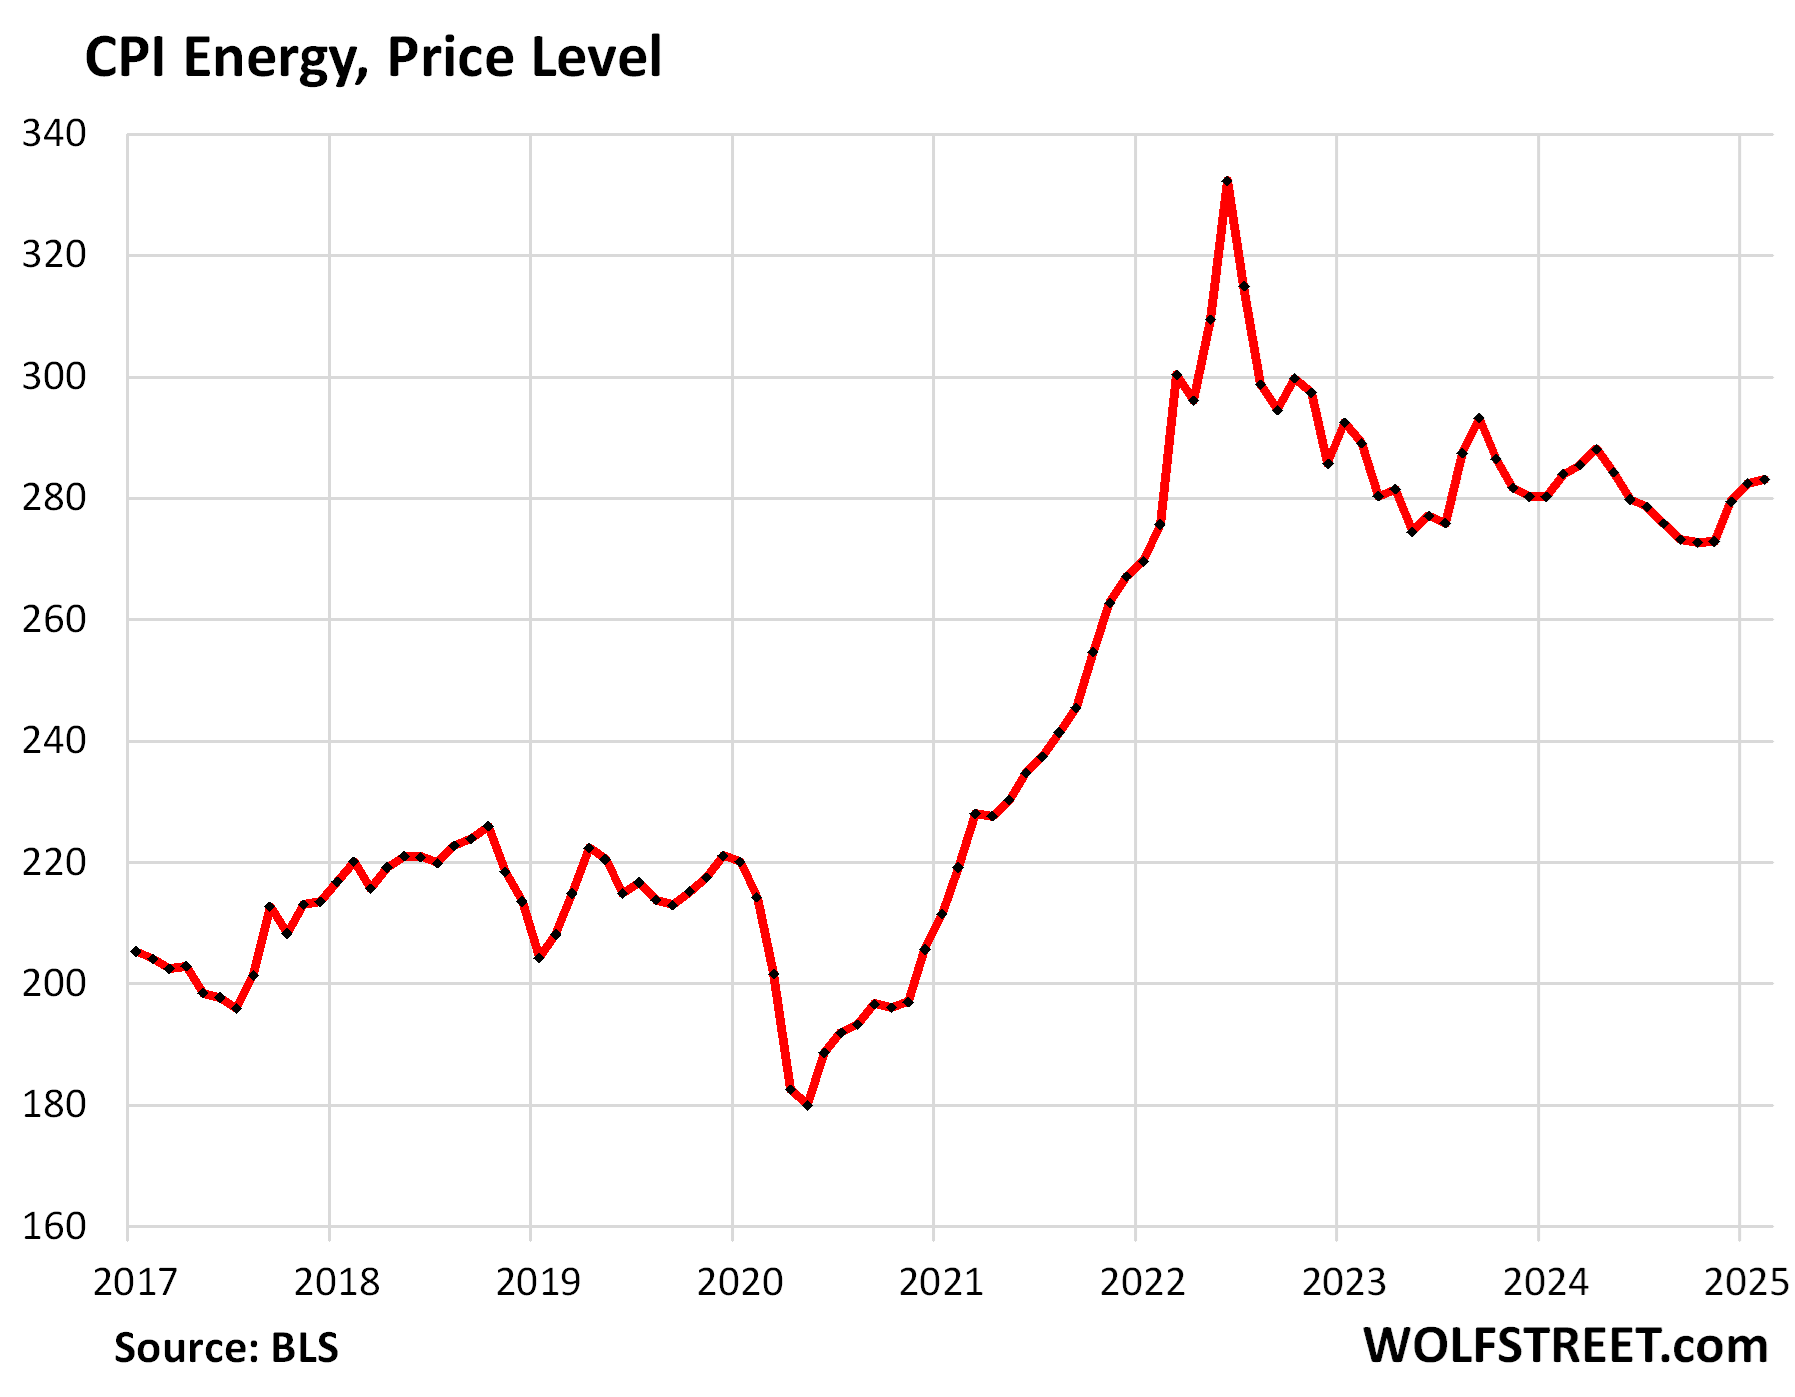
Energy.
The CPI for gasoline makes up about half of the overall energy CPI. Seasonally adjusted, it fell by 1.0% (not annualized) in February, undoing part of the increase in January.
Not seasonally adjusted, the index rose month-to-month, but slightly less than normally in February.
Year-over-year, the index fell by 3.1%. This decline essentially since the summer of 2022 was a significant contributor to the cooling of overall CPI in February.

The CPI for energy rose by 0.2% for the month, despite the drop in gasoline prices. The driver was a big jump in natural gas prices. We discussed the 140% year-over-year price spike of natural gas in the futures market here, which has started to bleed into prices charged by utilities for natural gas piped to the home. The index for electricity services also increased as 43% of the electricity in the US is generated by natural-gas fired powerplants.
| CPI for Energy, by Category | MoM | YoY |
| Overall Energy CPI | 0.2% | -0.2% |
| Gasoline | -1.0% | -3.1% |
| Electricity service | 1.0% | 2.5% |
| Utility natural gas to home | 2.5% | 6.0% |
| Heating oil, propane, kerosene, firewood | -0.2% | -1.7% |
Enjoy reading WOLF STREET and want to support it? You can donate. I appreciate it immensely. Click on the mug to find out how:

![]()
The post Beneath the Skin of CPI Inflation: Pace Slows from Spike Last Month, but 6-Month CPI Accelerates Further, Worst Increase since September 2023 appeared first on Energy News Beat.
“}]]
Energy News Beat