[[{“value”:”
Demand destruction because prices are too high after the 50% price explosion during the pandemic.
By Wolf Richter for WOLF STREET.
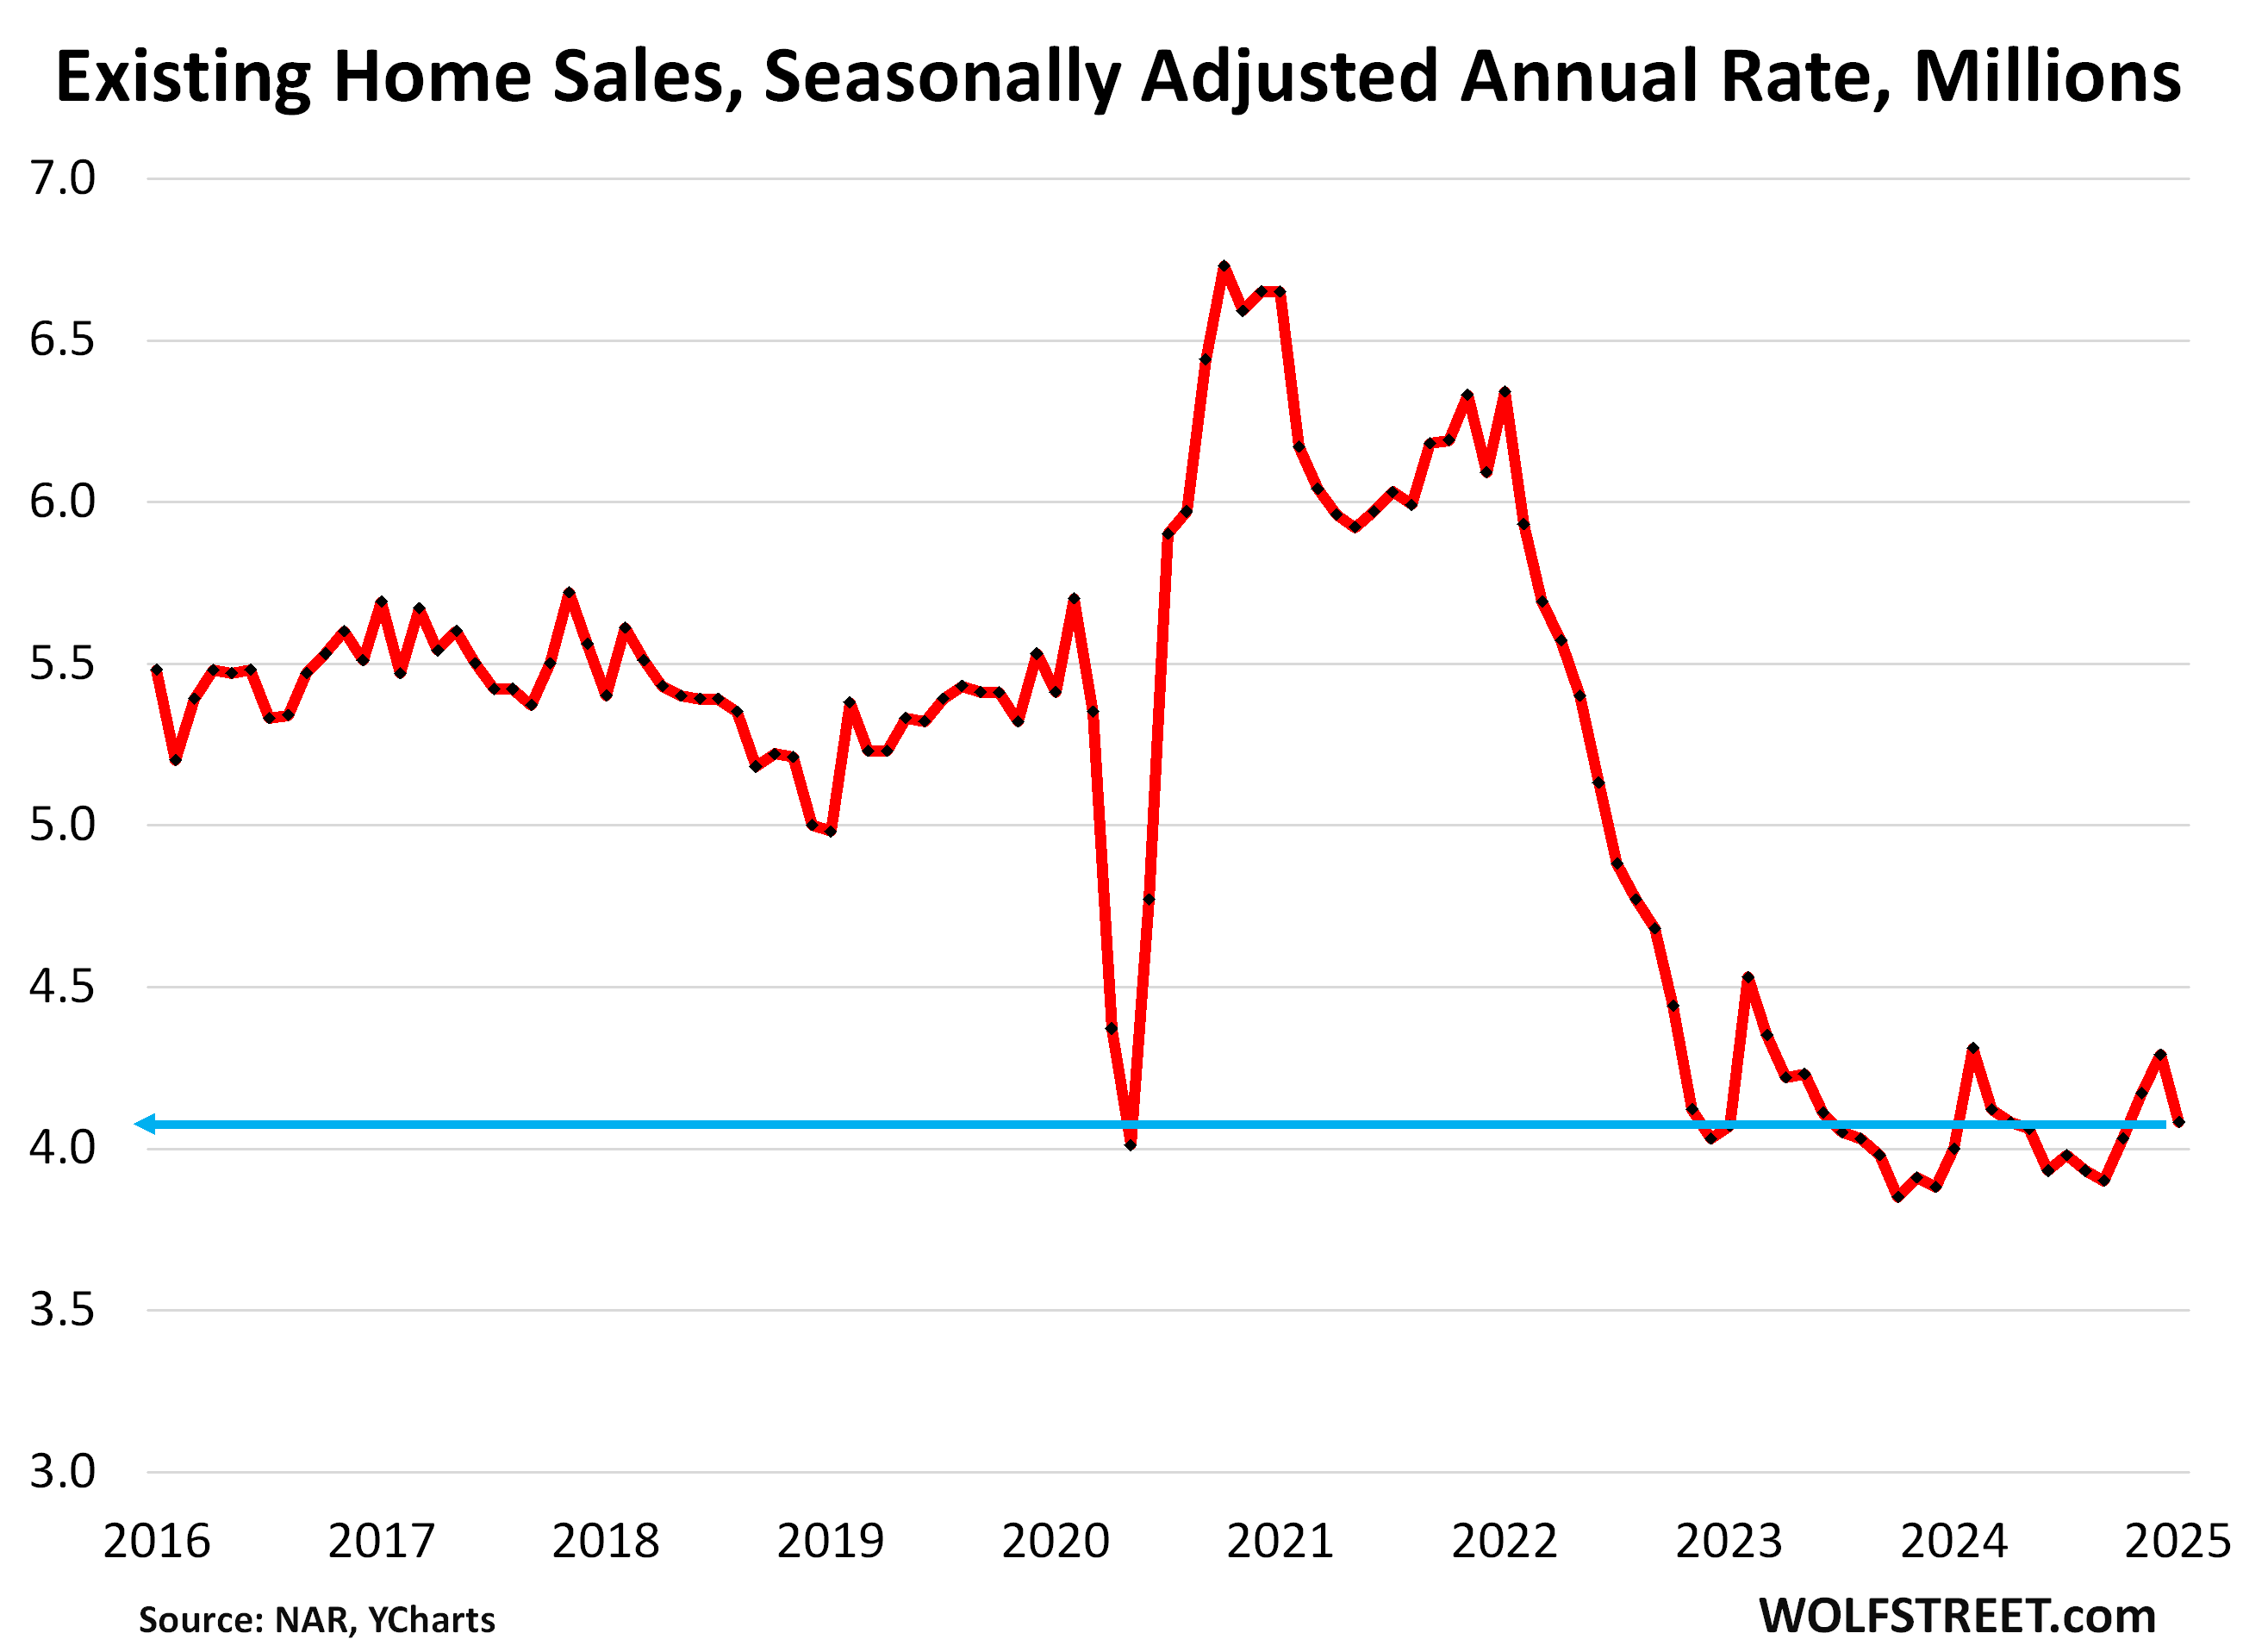
Demand in the resale market just keeps getting crushed after every little sign of green shoots. Sales of existing single-family houses, townhouses, condos, and co-ops that closed in January dropped by 4.9% from December, seasonally adjusted, to an annual rate of 4.08 million sales, according to the National Association of Realtors today.
This rate of sales was up just 2.0% from the abysmally low levels a year ago – 2024 as a whole had been the worst sales year since 1995 – and flat with the abysmally low levels two years ago.
Compared to January 2021, the sales rate was down by 36%, compared to January 2019, the sales rate was down by 25% (historical data from YCharts):
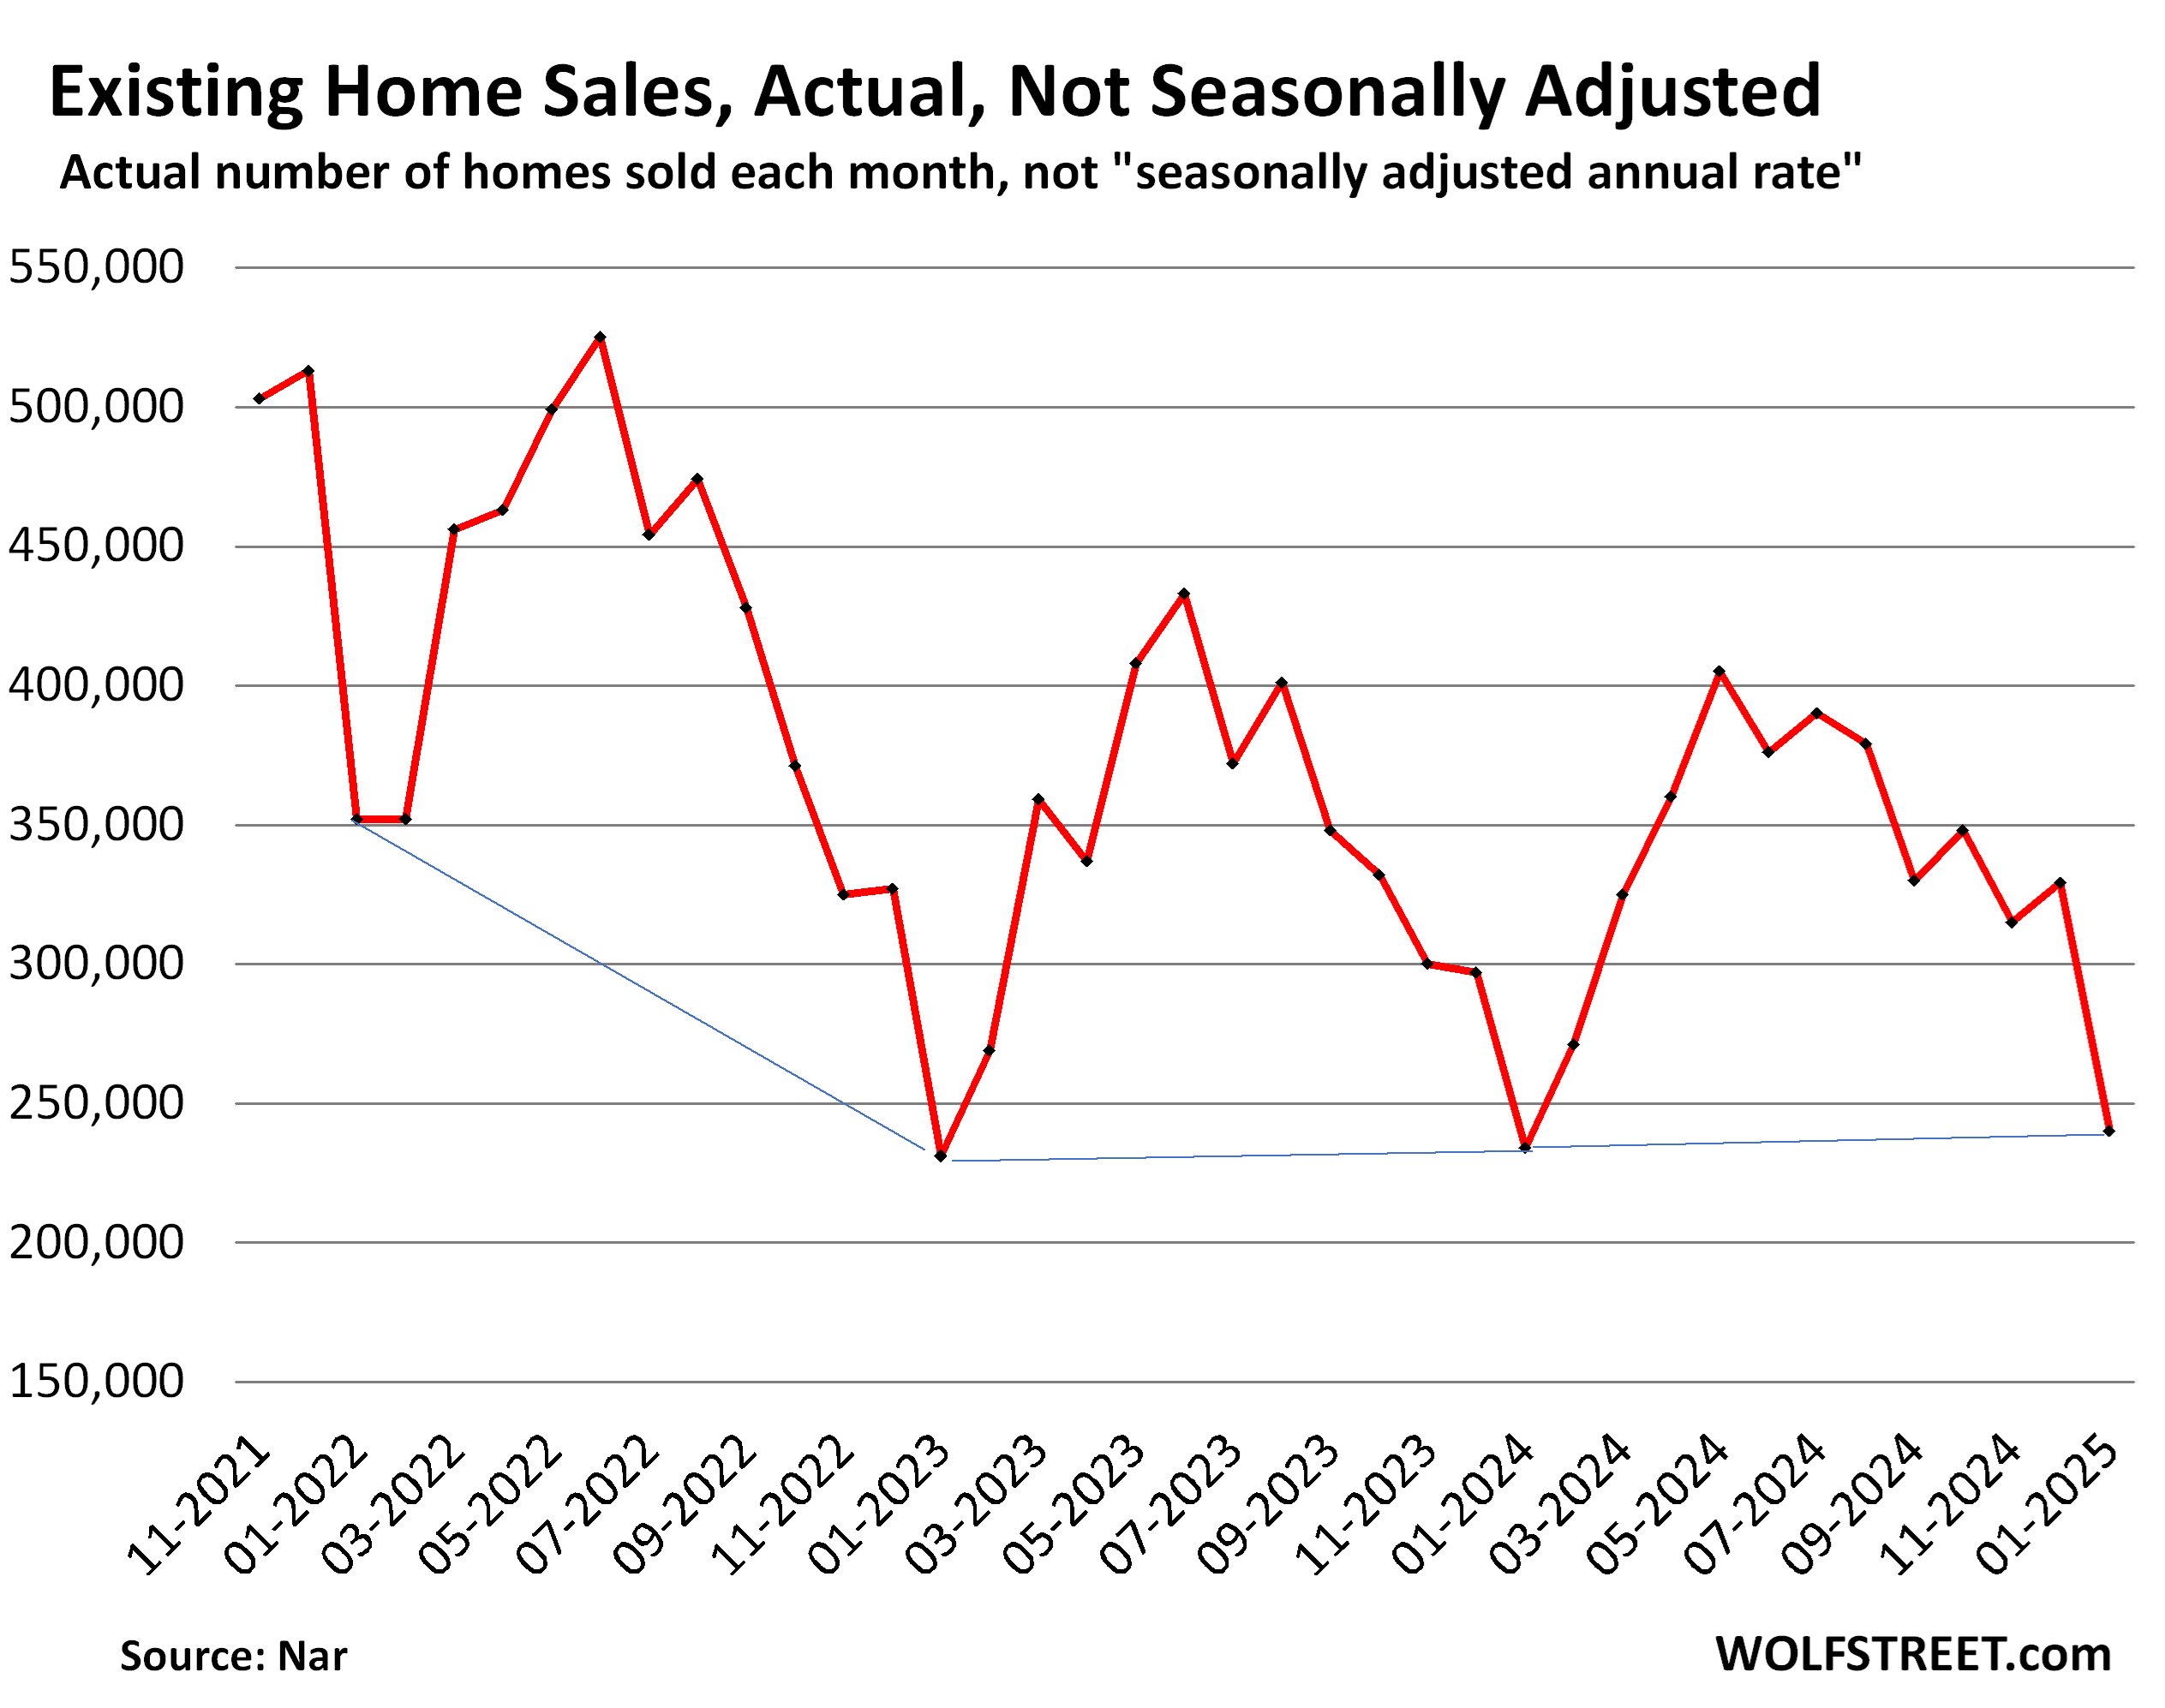
Actual sales, not seasonally adjusted and not annual rate, at 240,000 in January, were up by 2.6% from the abysmally low levels a year ago, and down by 31% from January 2022. The blue lines connect the Januarys.
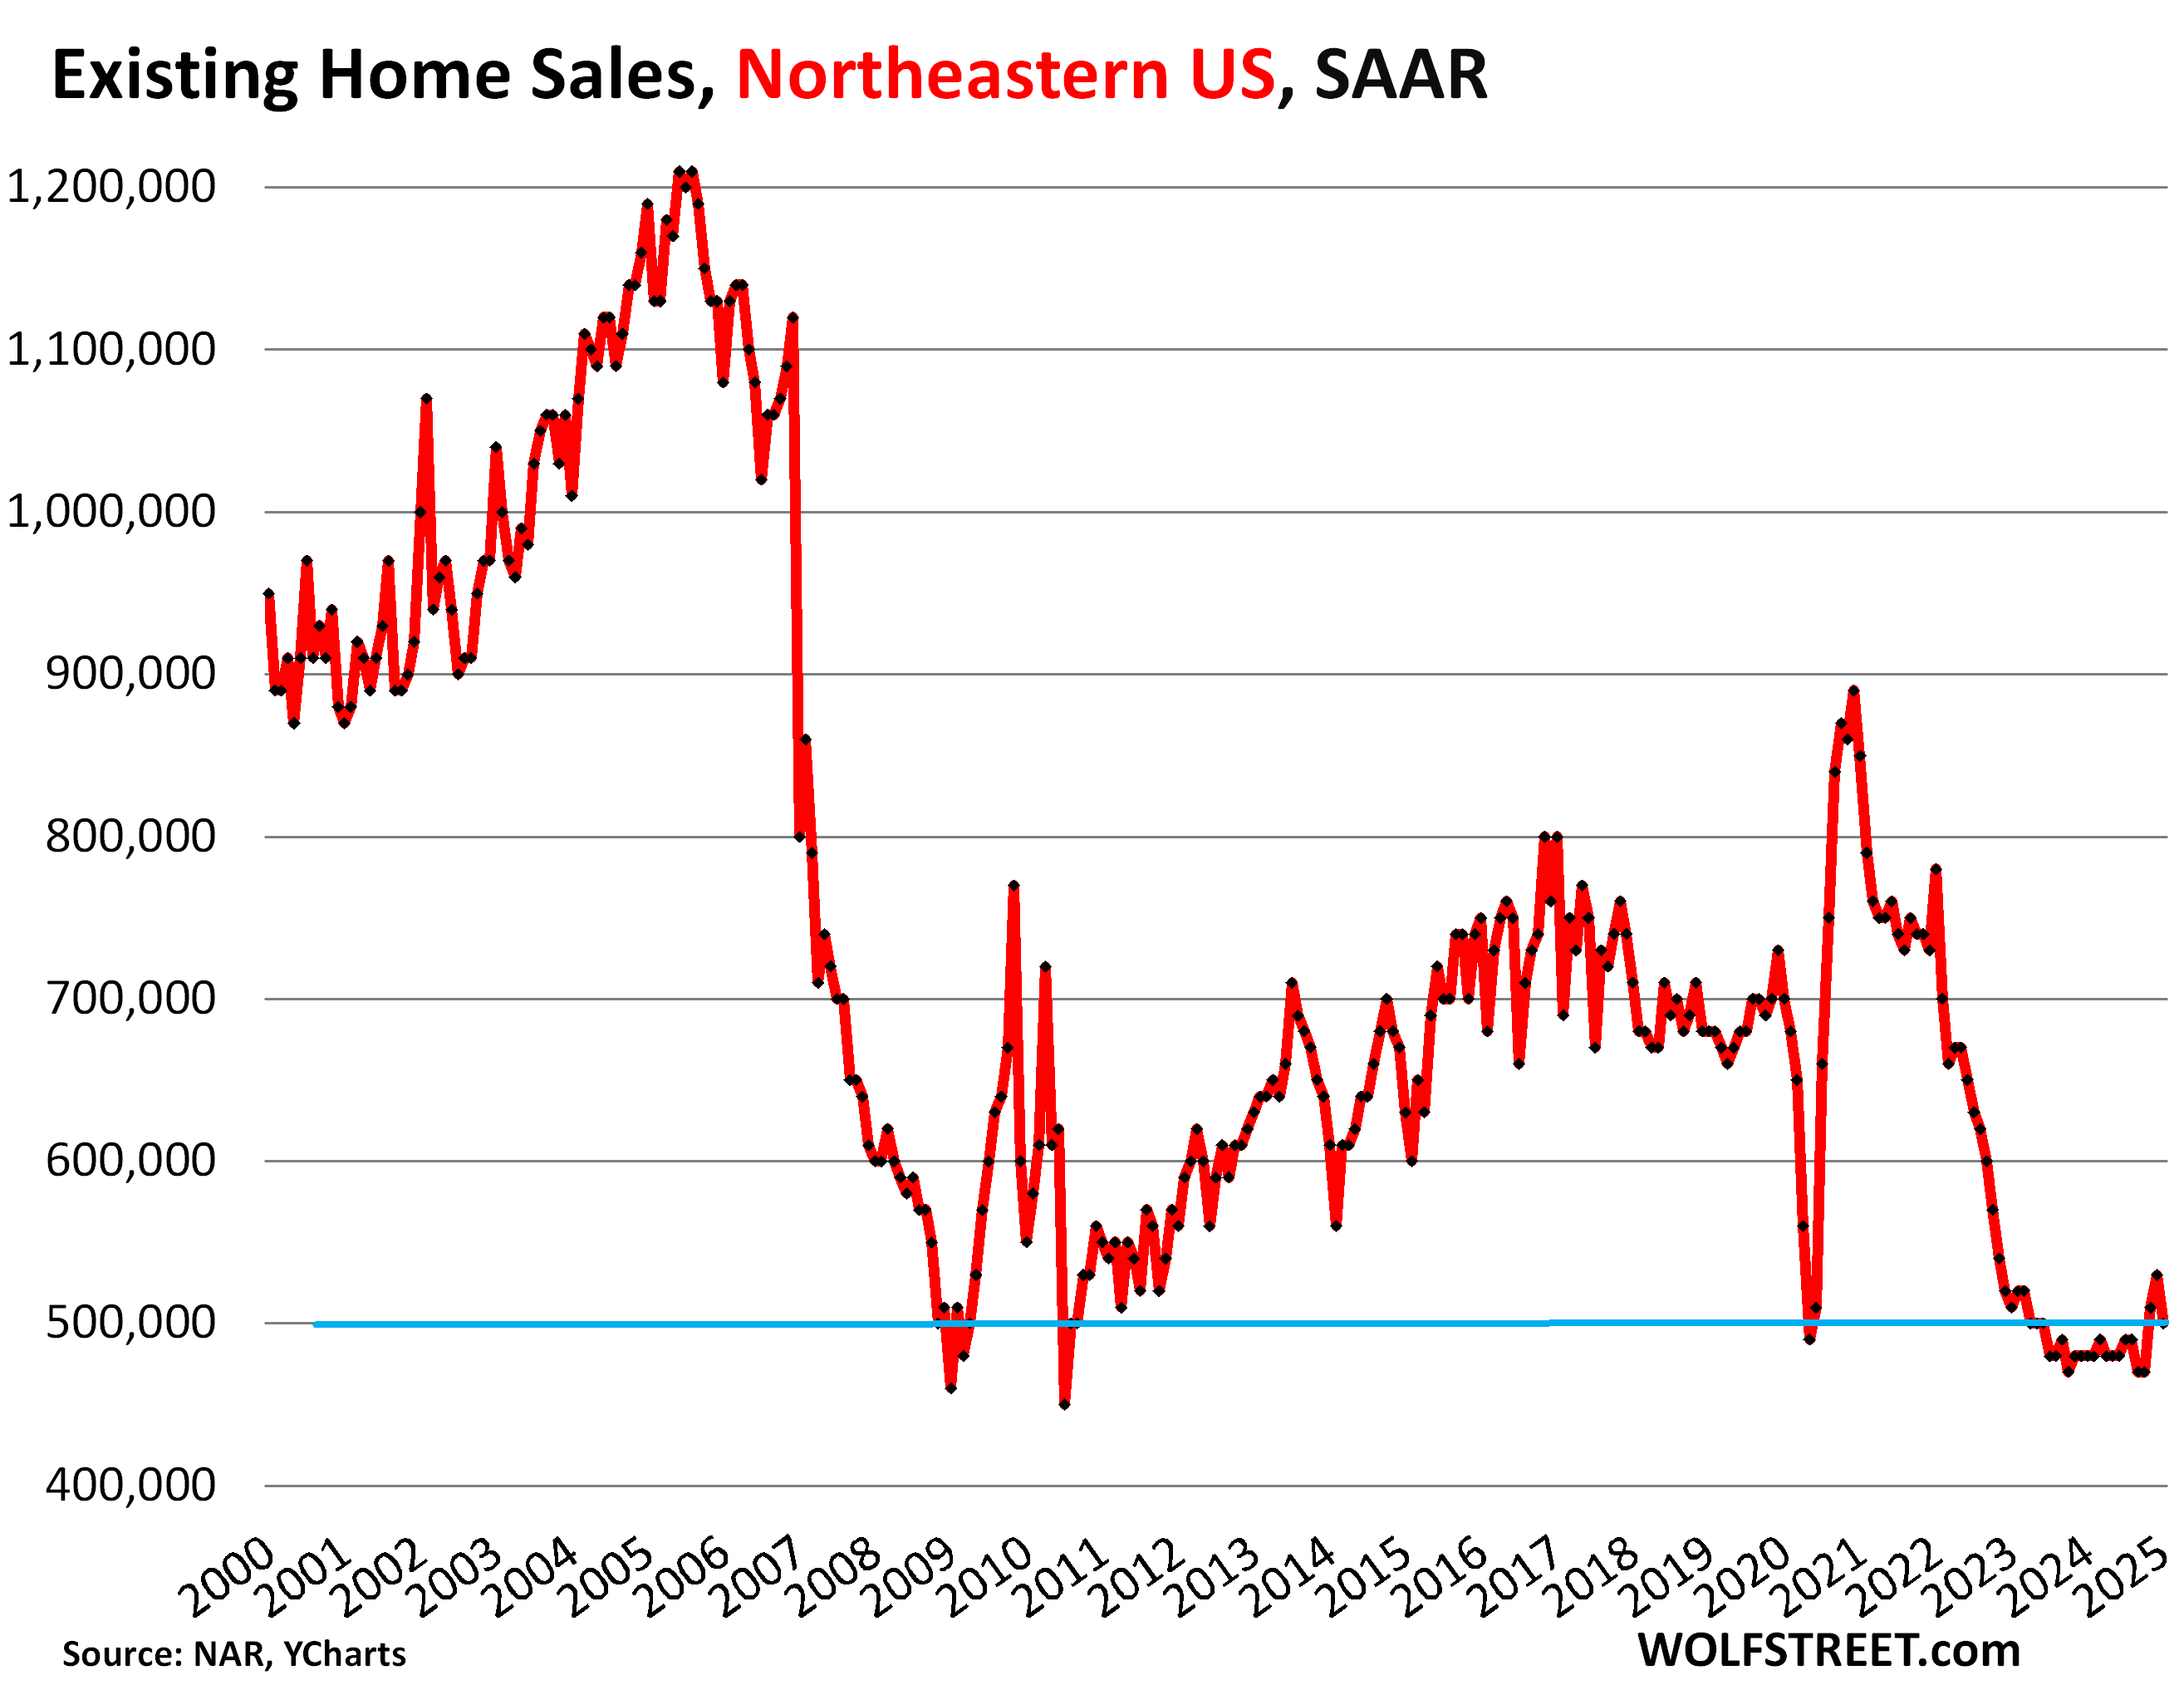
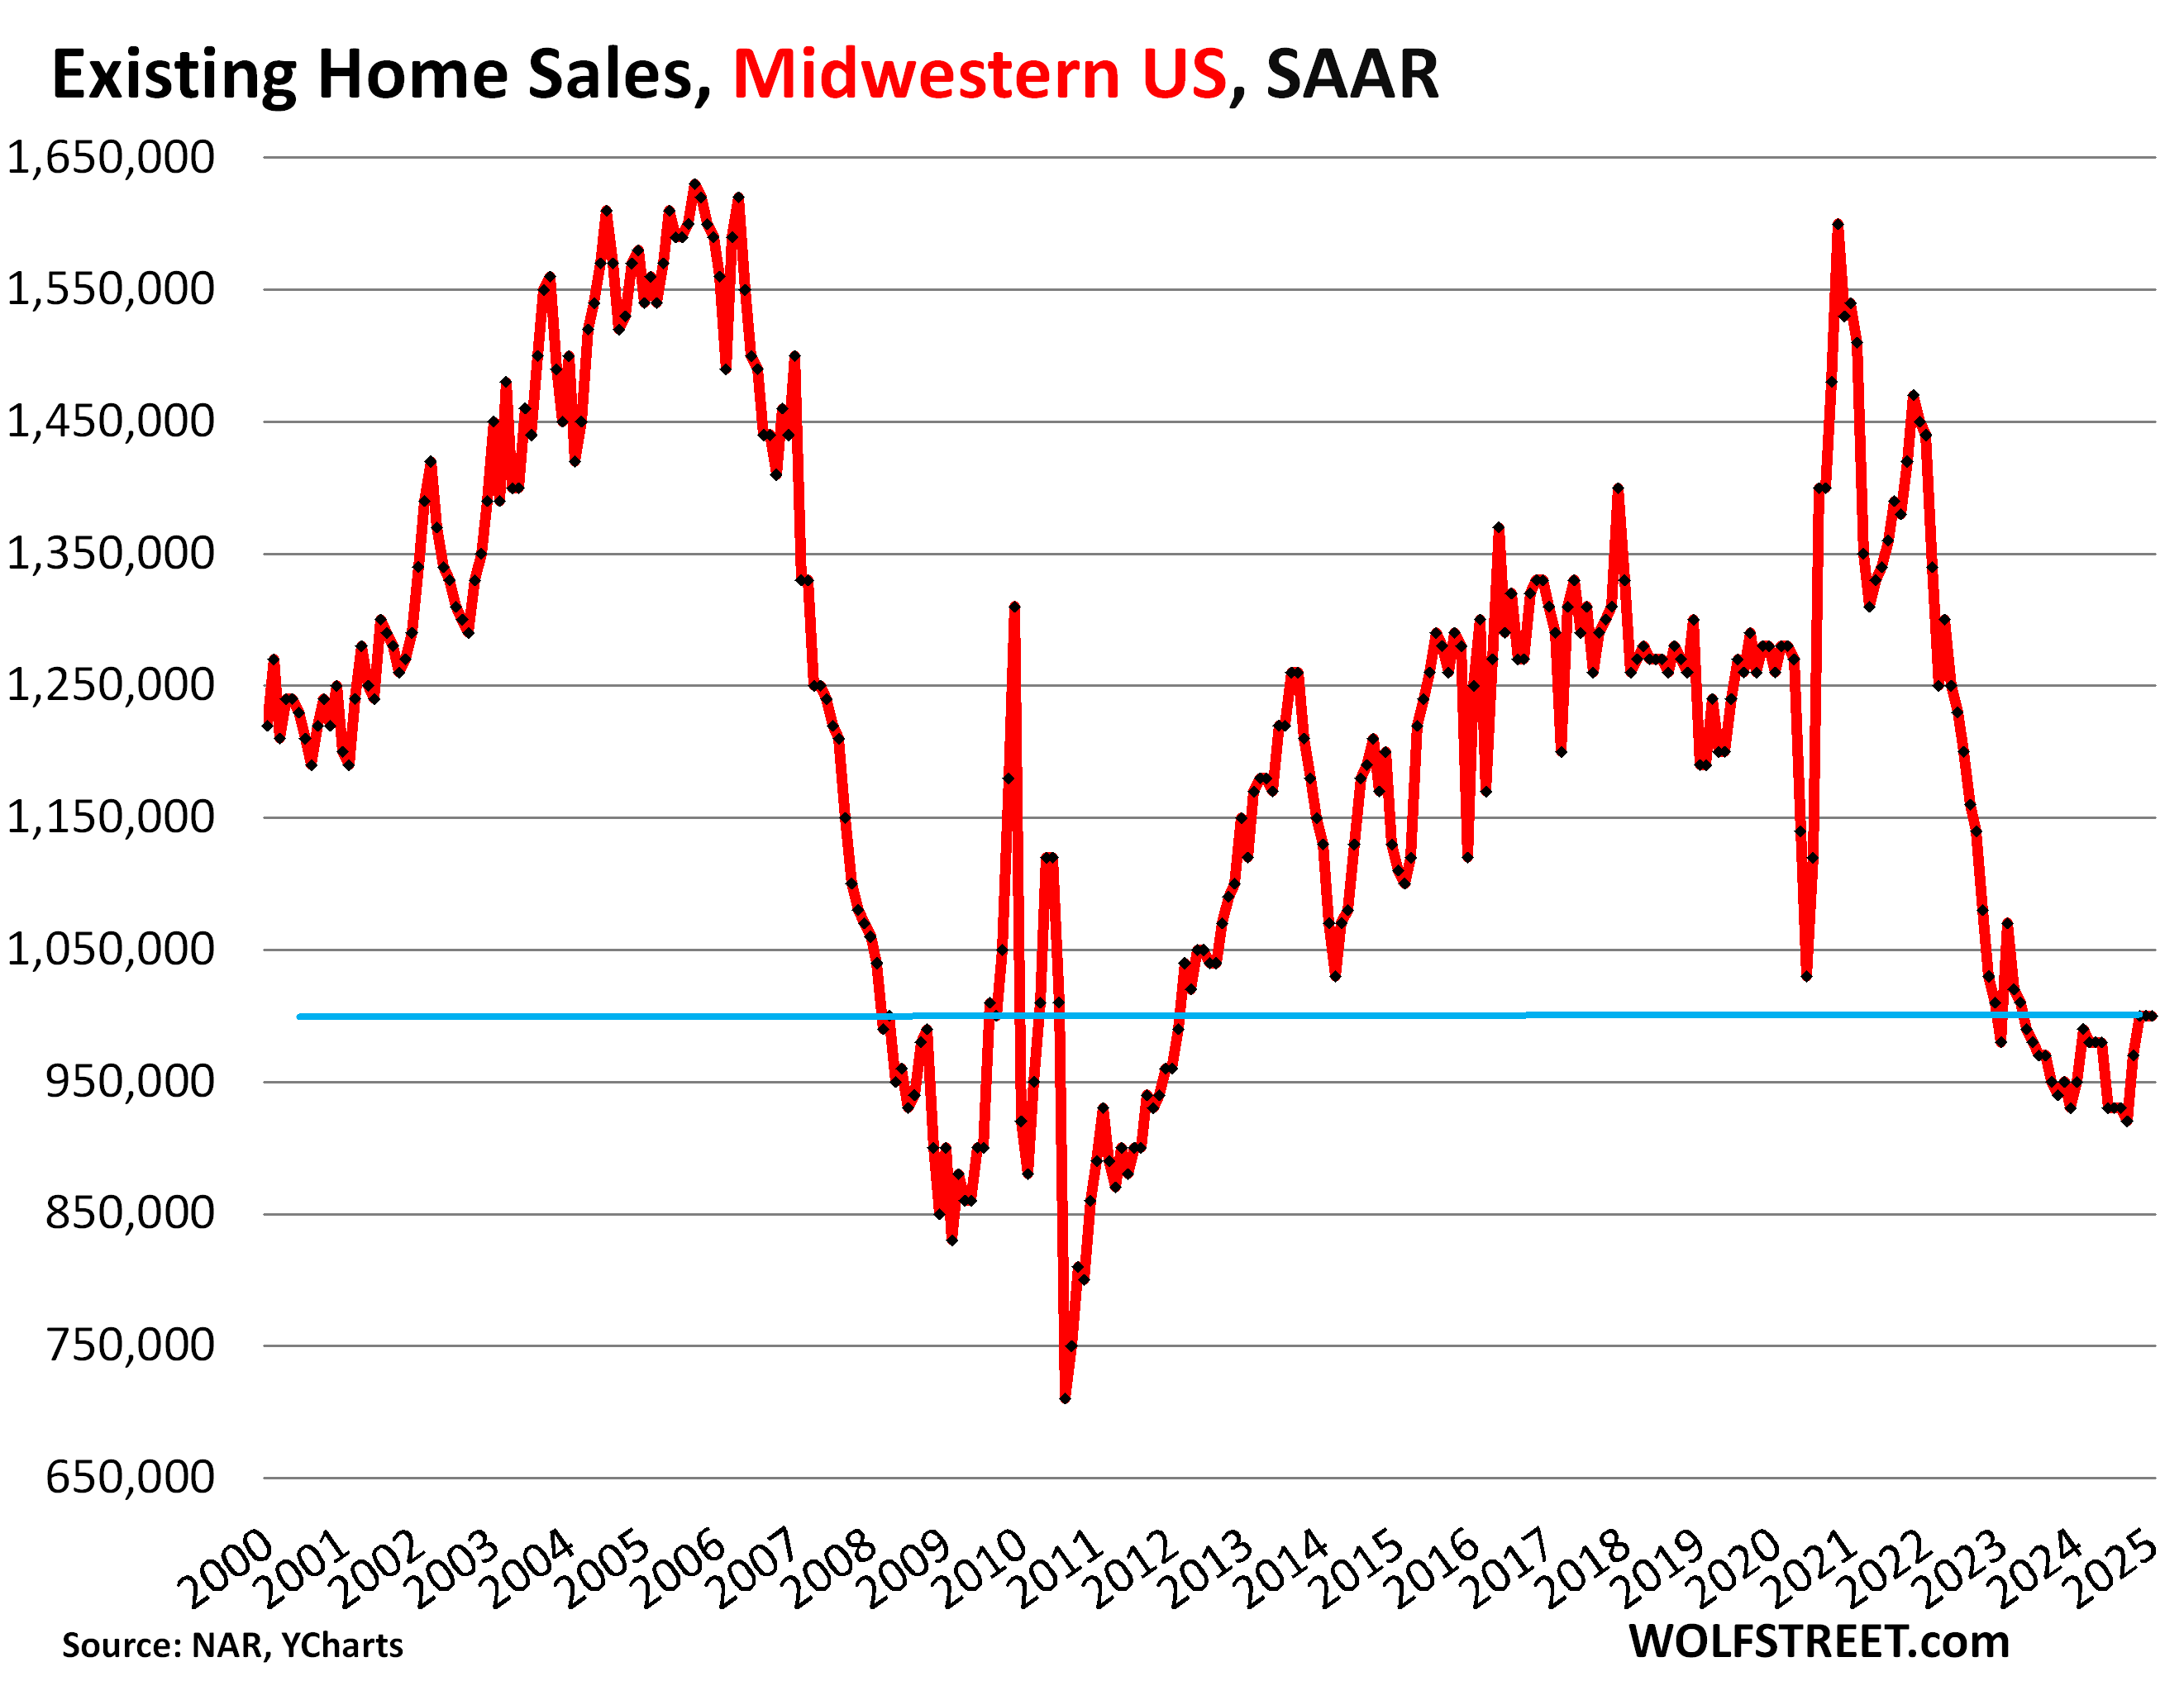
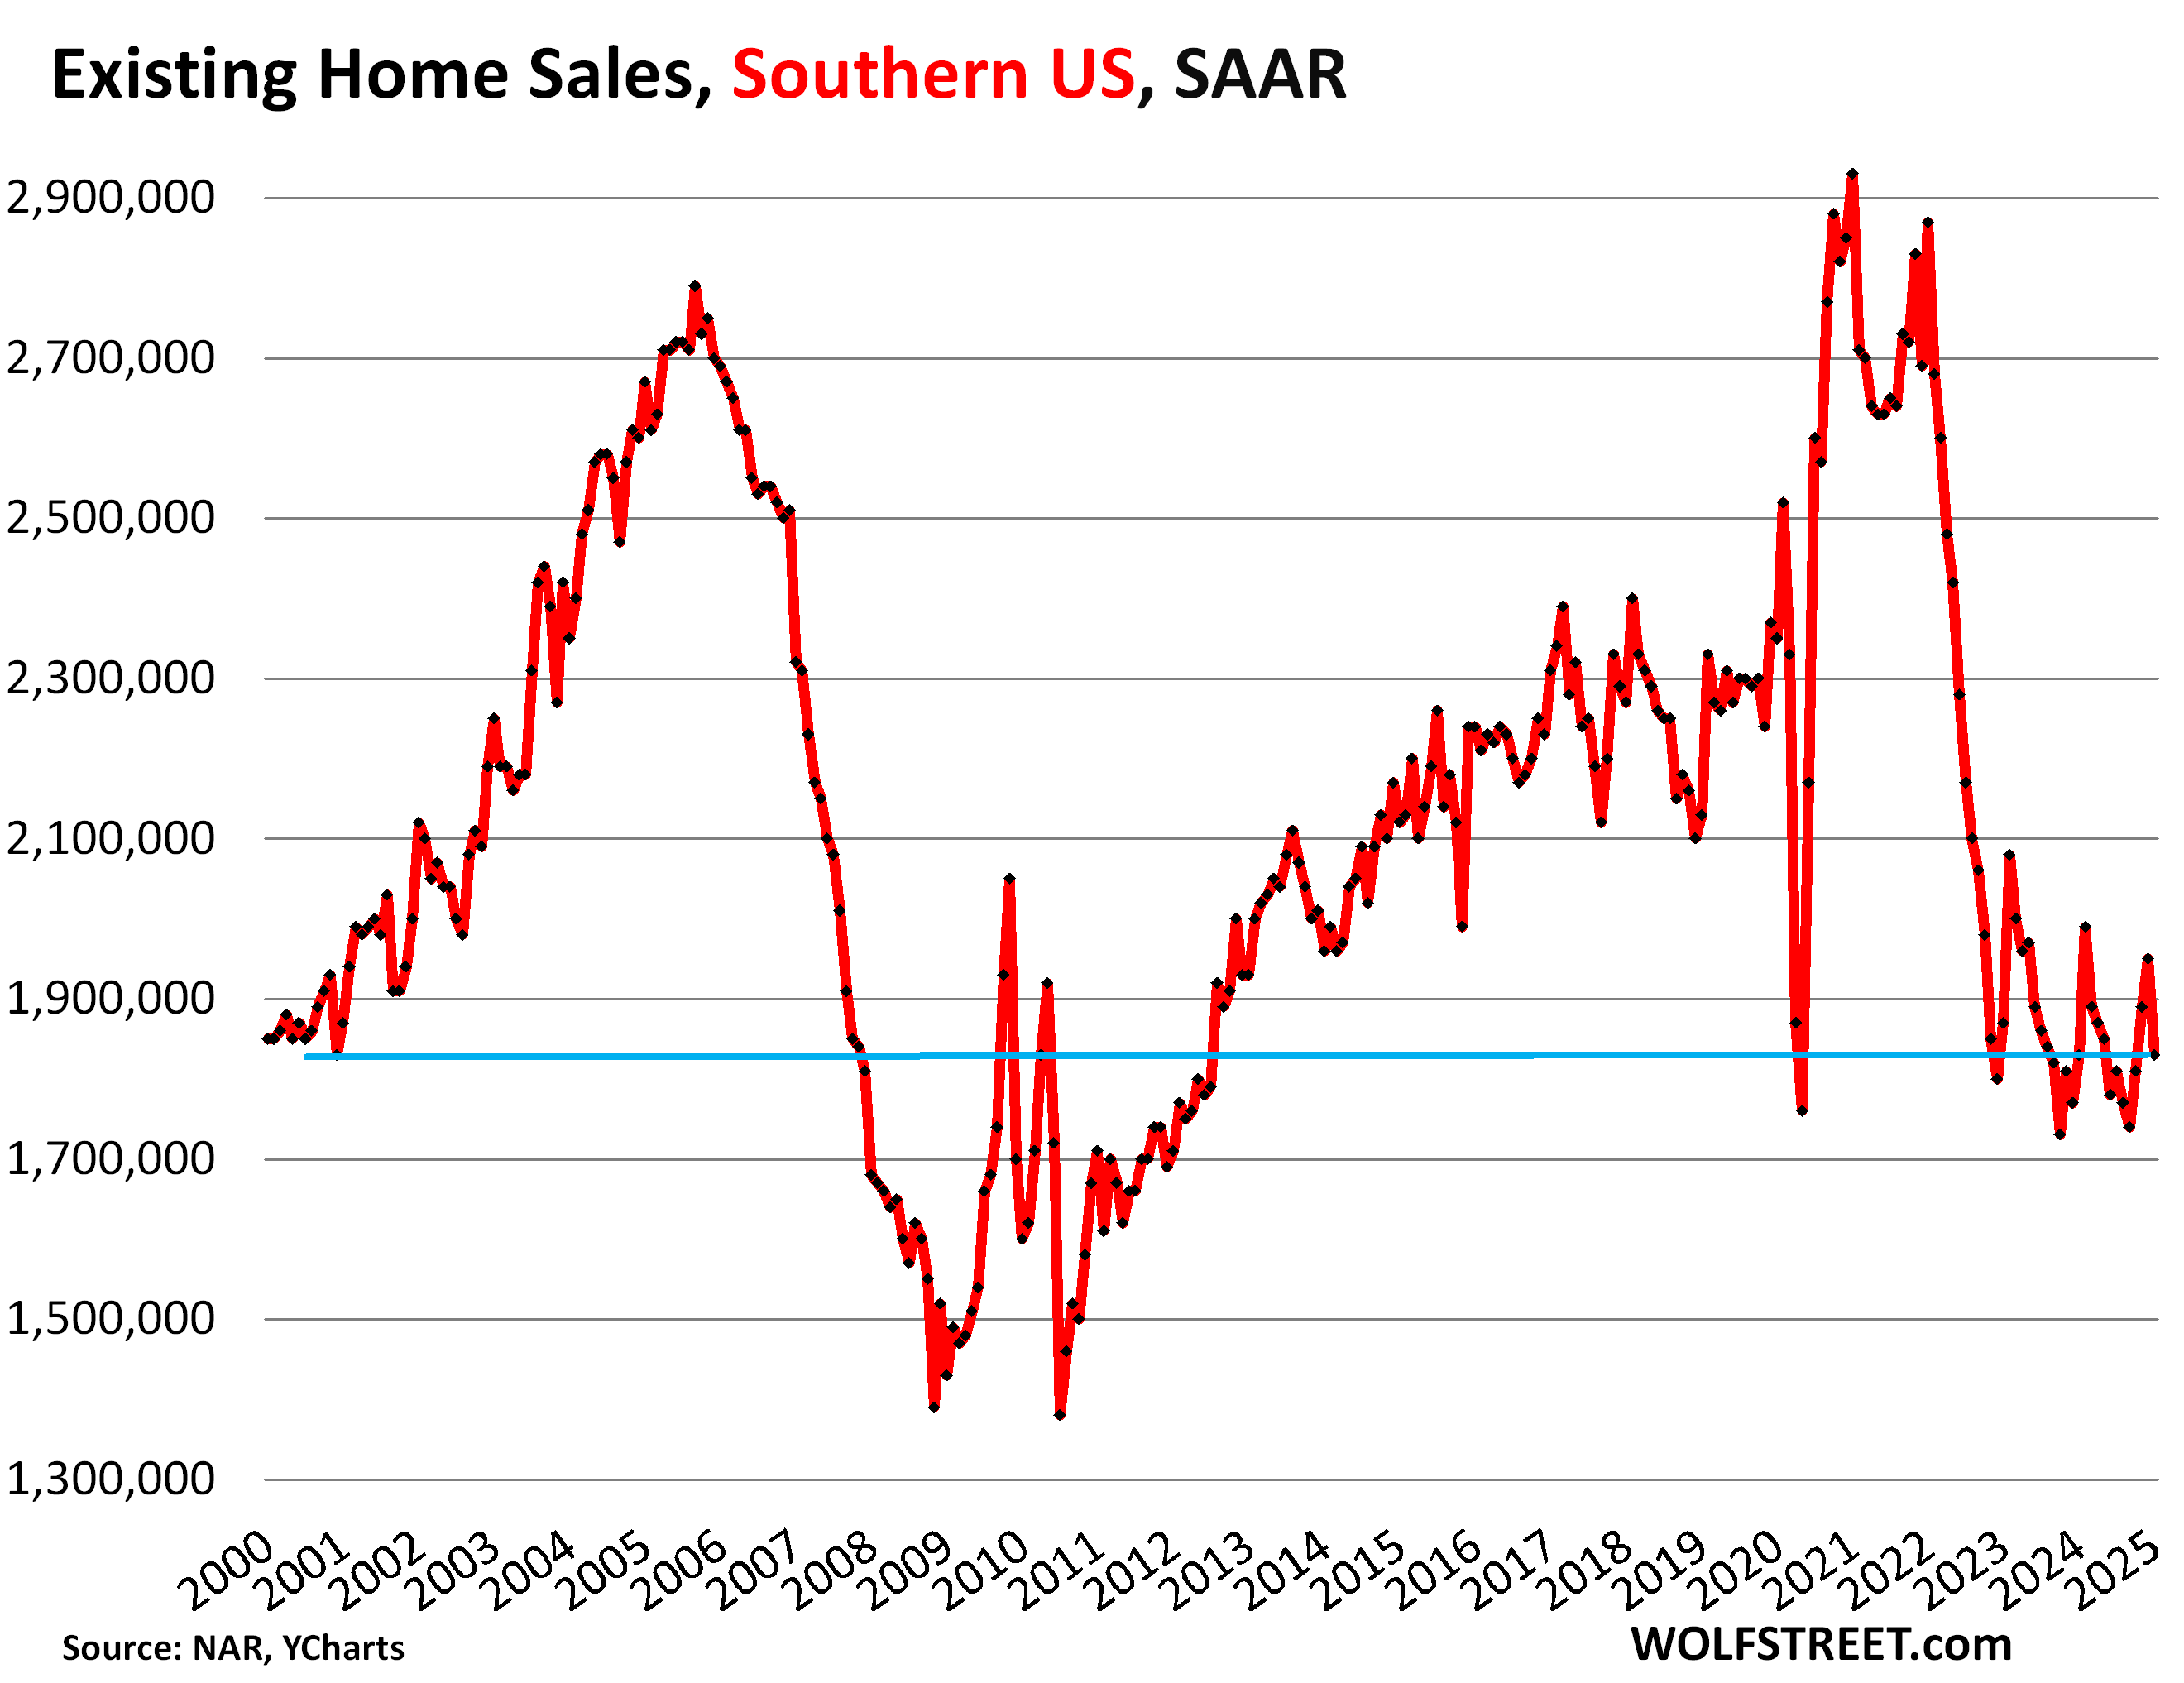
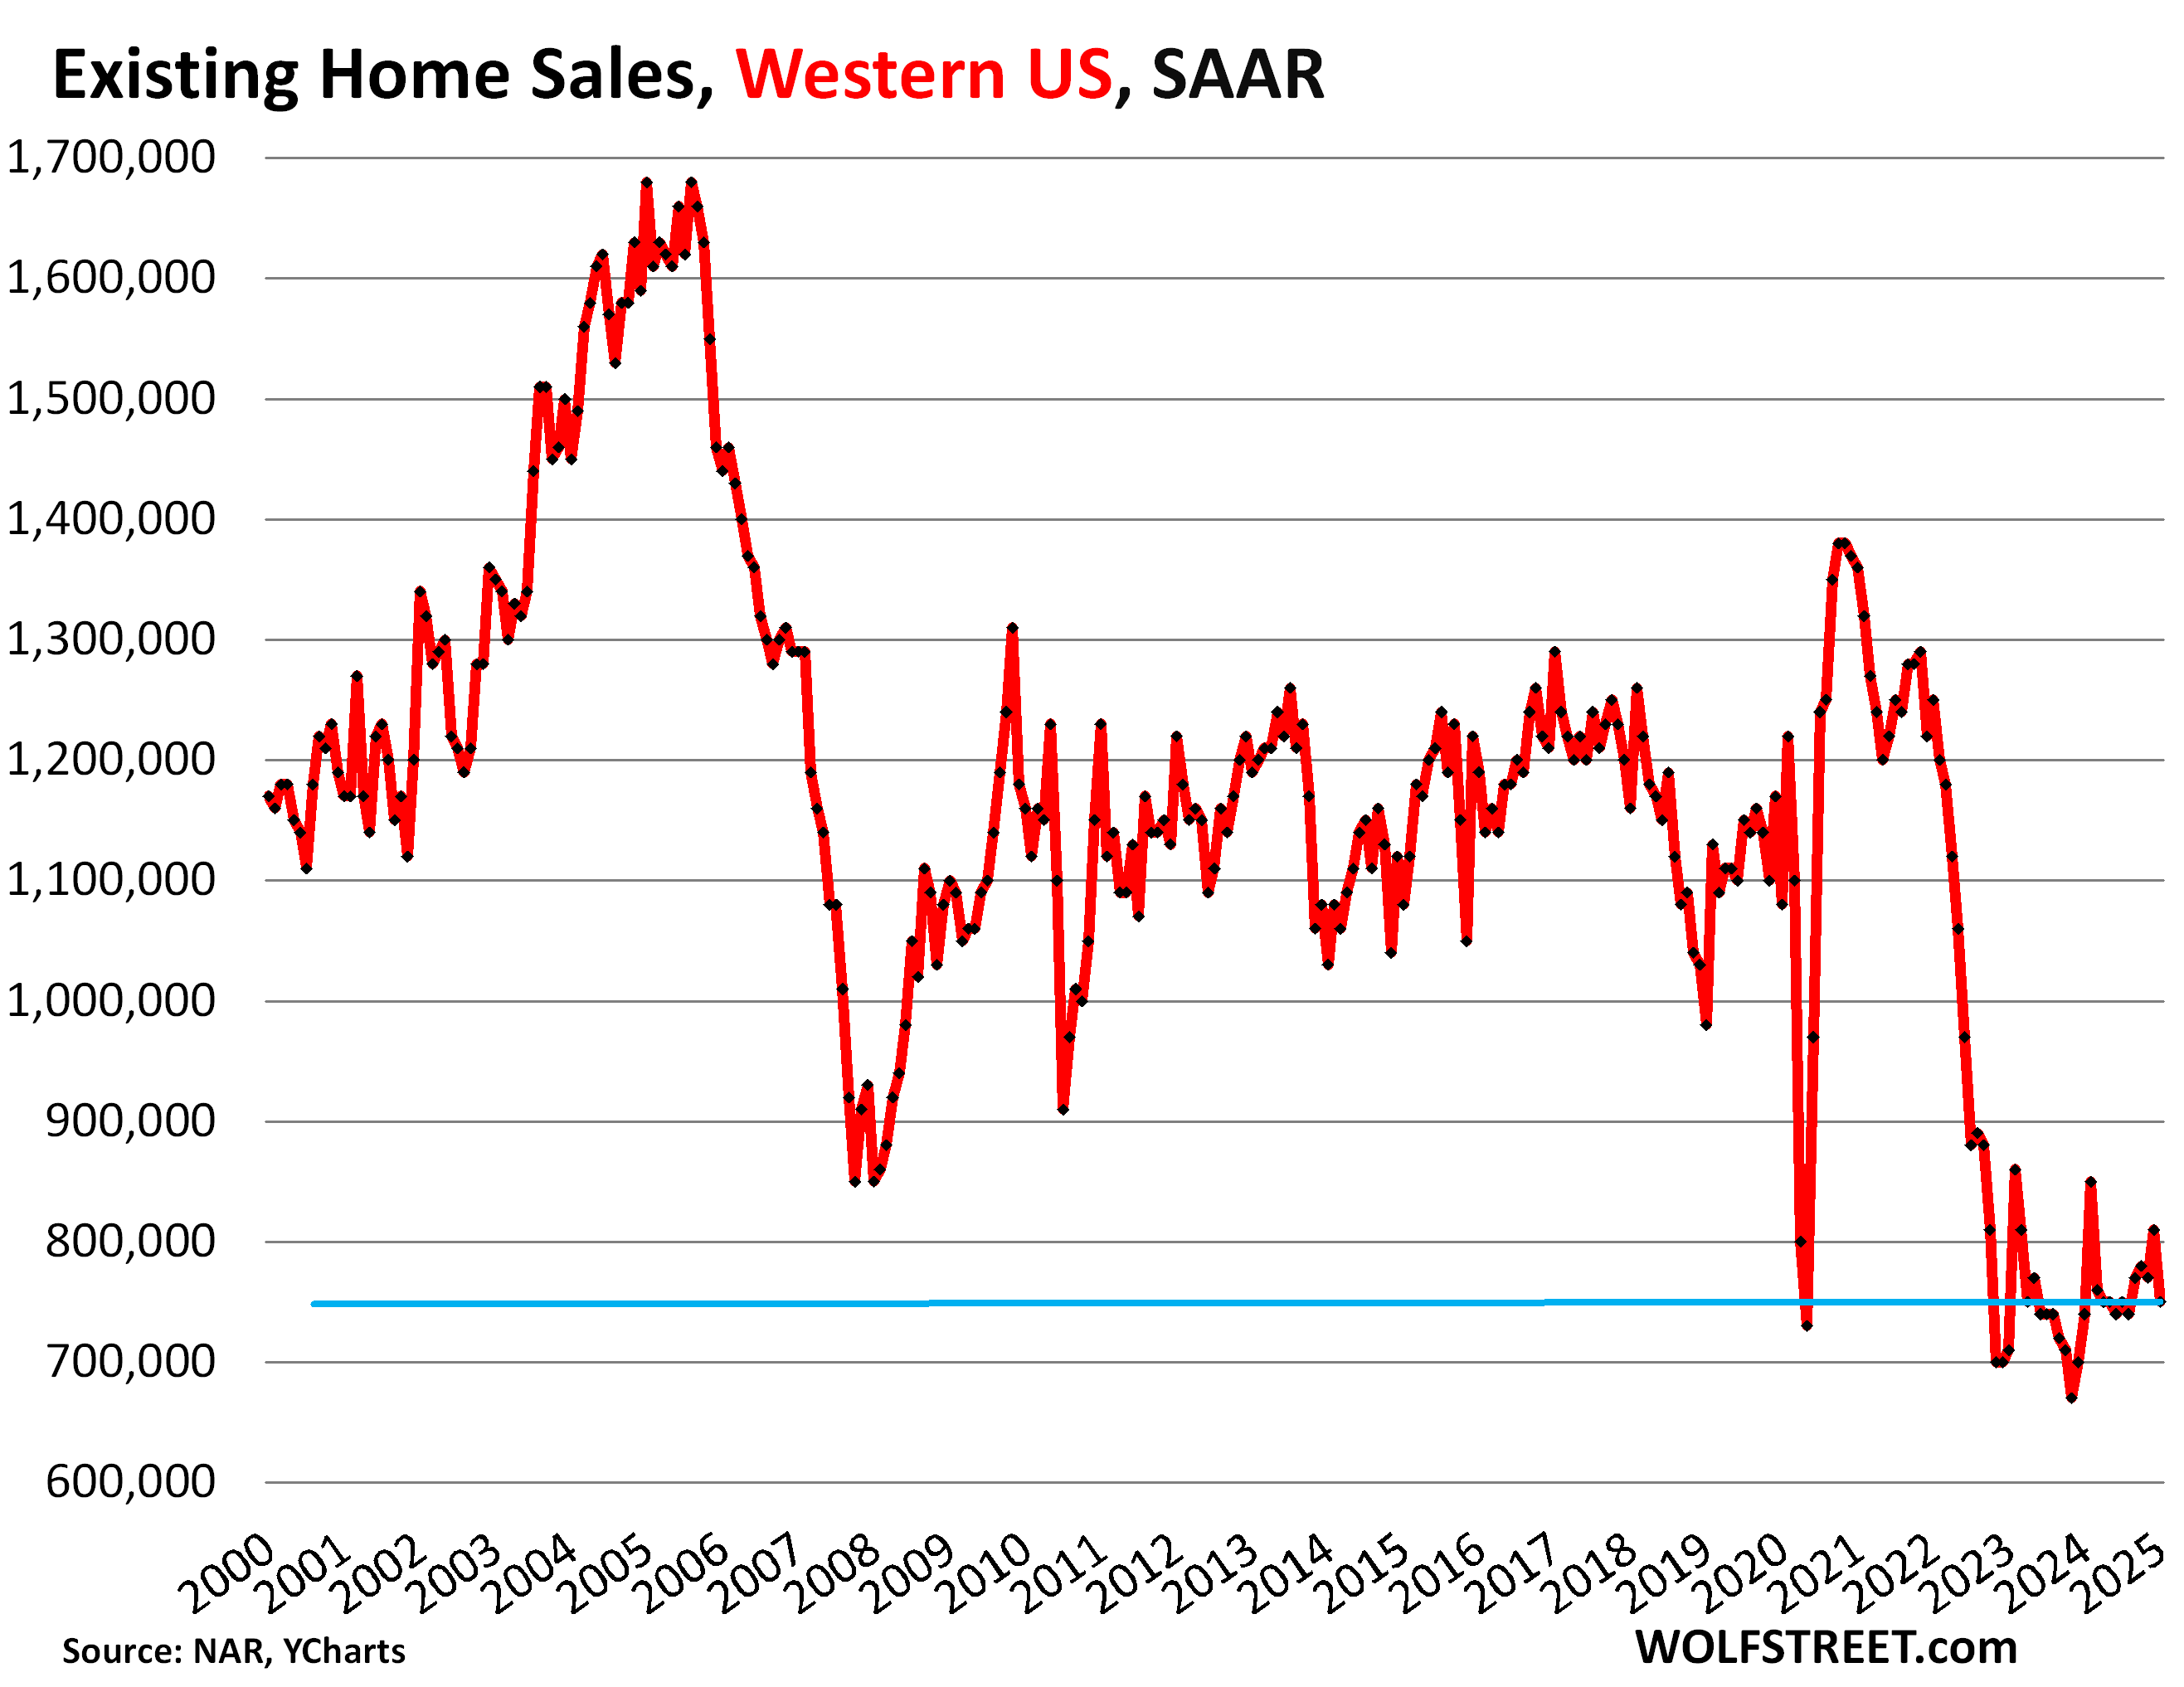
Demand destruction by region.
The charts below show the seasonally adjusted annual rate of sales (SAAR) in the four Census Regions of the US. A map of the four regions is in the comments below the article.
Northeastern US: The seasonally adjusted annual rate of sales fell to 500,000 homes:
Midwestern US: The seasonally adjusted annual rate of sales remained at 1,000,000 homes.
Southern US: The seasonally adjusted annual rate of sales fell to 1,830,000 homes.
Western US: The seasonally adjusted annual rate of sales rose 750,000:
Highest supply since January 2019.
Supply of unsold existing homes on the market jumped to 3.5 months in January, the highest since January 2019 (3.8 months), higher than January 2018 (3.4 months), and same as January 2017. January 2025 is shown as the red square.

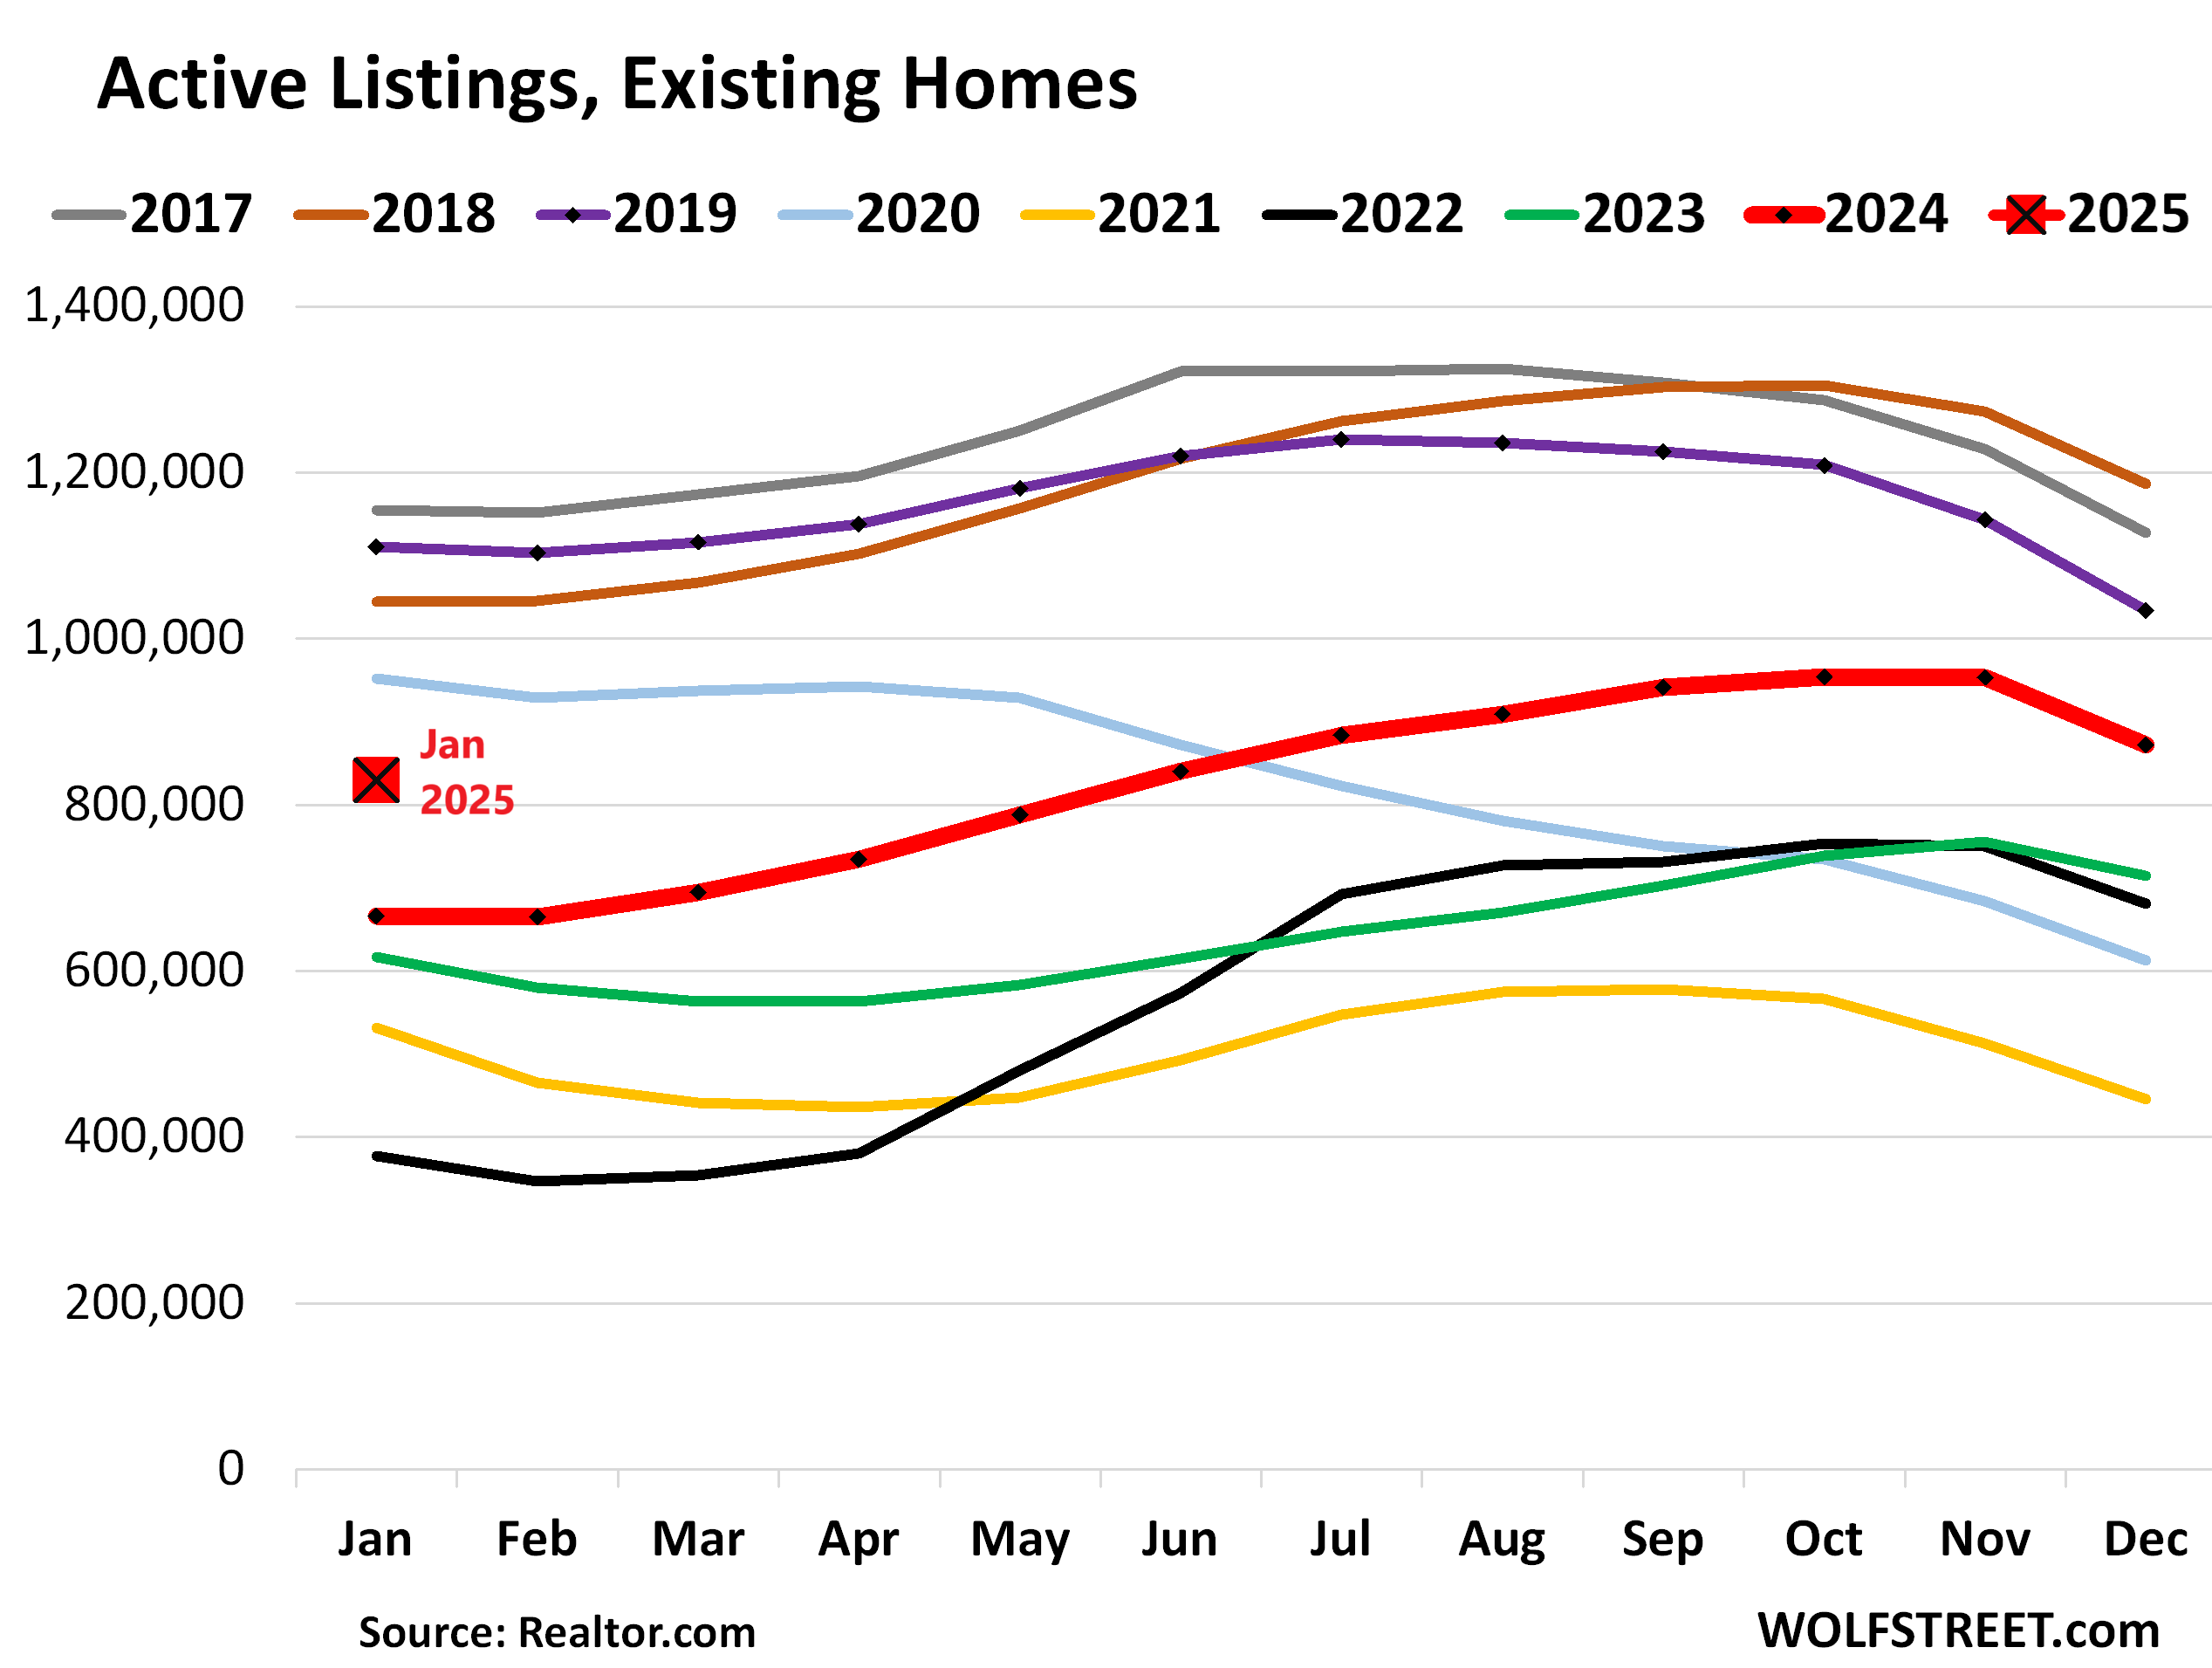
Active Listings doubled since 2021.
Active listings – total inventory for sale minus homes whose sales are pending – rose to 829,400 (red square in the chart below), the highest for any January since 2020, according to data from Realtor.com.
Active listings have more than doubled since January 2022, while actual sales in January have plunged by 31% from January 2022.
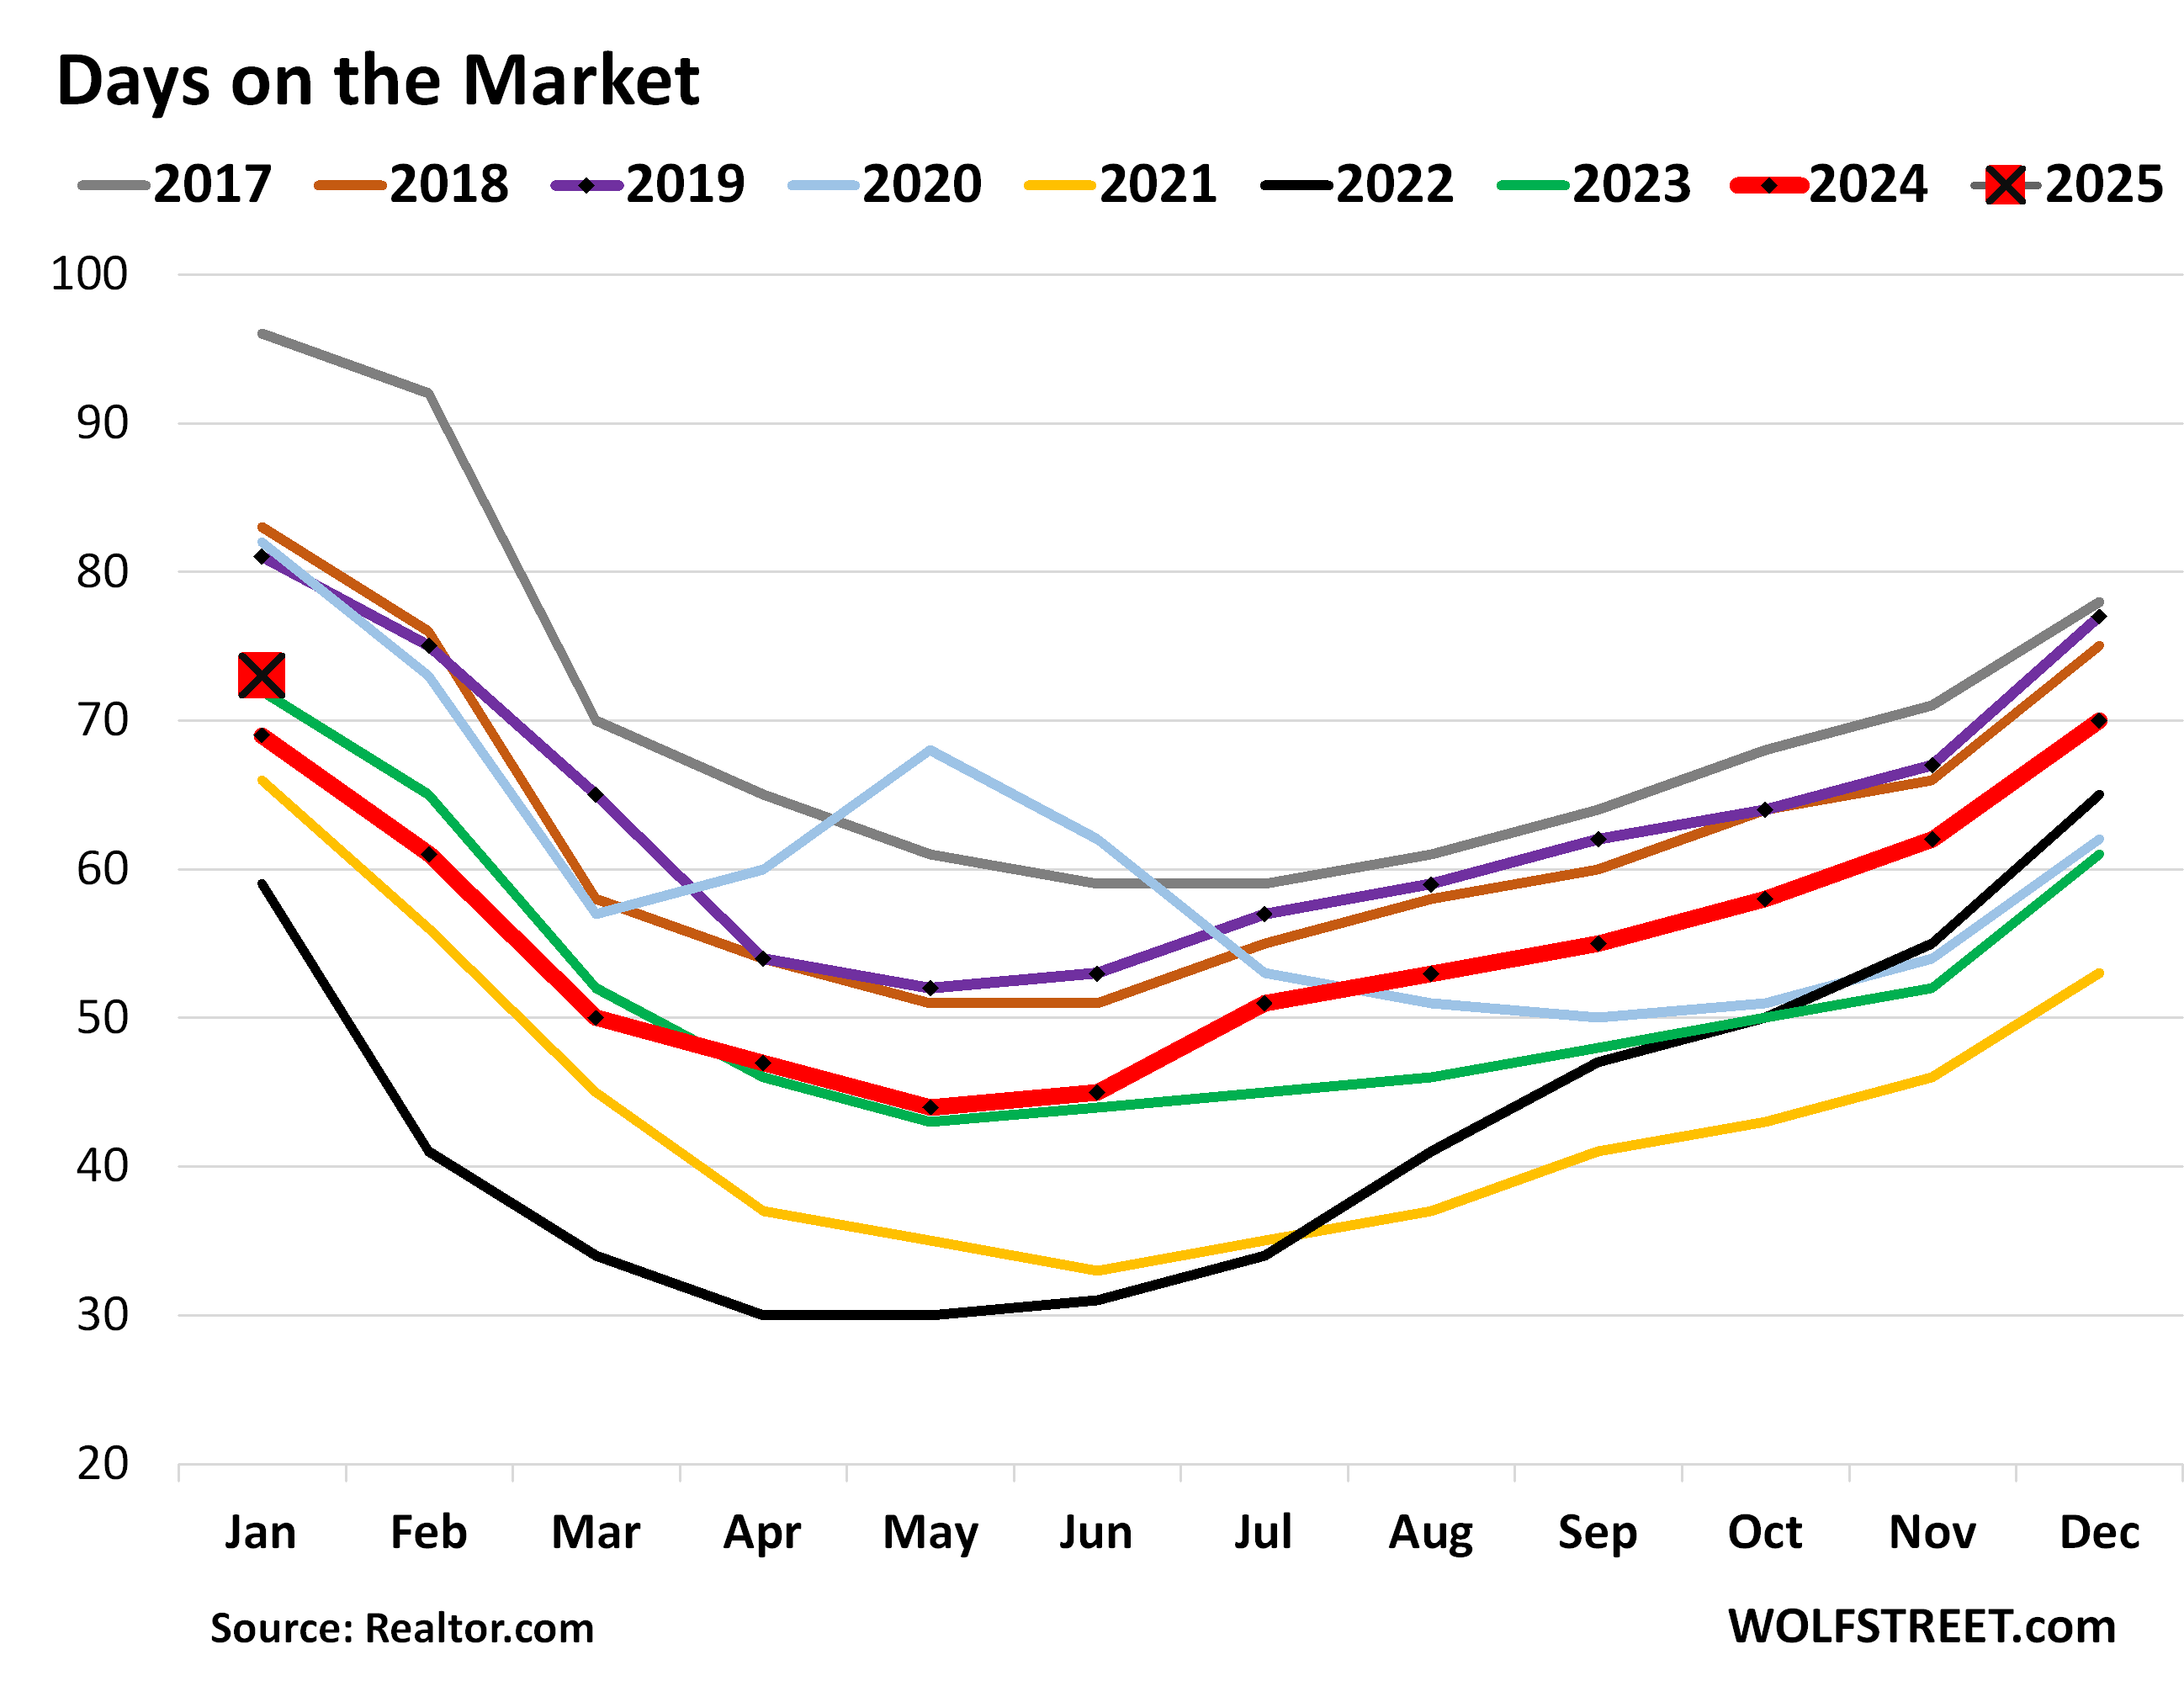
Days on the market lengthen to 73 days.
The median number of days before the home is either sold or pulled off the market because it failed to sell rose to 73 days in January, the highest for any January since 2020, and up from 69 days a year ago, according to Realtor.com.
Days on the market track the mix of two factors: How motivated sellers are by letting their home sit on the market when it doesn’t sell right away, before they pull it, and how quickly homes sell that do sell.
I’ll just vent here about the metric, “median price.”
To get the national median price, the NAR essentially puts all homes that sold in the US on a list sorted by price and takes the price of the one home that is in the middle of that list (=median price).
The median price is heavily skewed by changes in the mix of homes that sold. In the spring, nationally, more higher-end homes come on the market and sell, which changes the mix of what sold and skews the median price higher. It then does the reverse in the fall and winter and skews the median price lower. These seasonal ups and downs in prices are at least in part due to this shift in the mix. In individual markets, median prices jump up and down wildly on a monthly basis, based largely on the mix of what sold.
The median home price is the second worst measure for home prices, after “average home prices” (sum of all home prices divided by number of homes). Today, there are far better methods available, based on huge amounts of data from all sources, including public records, with sales-pairs relationships.
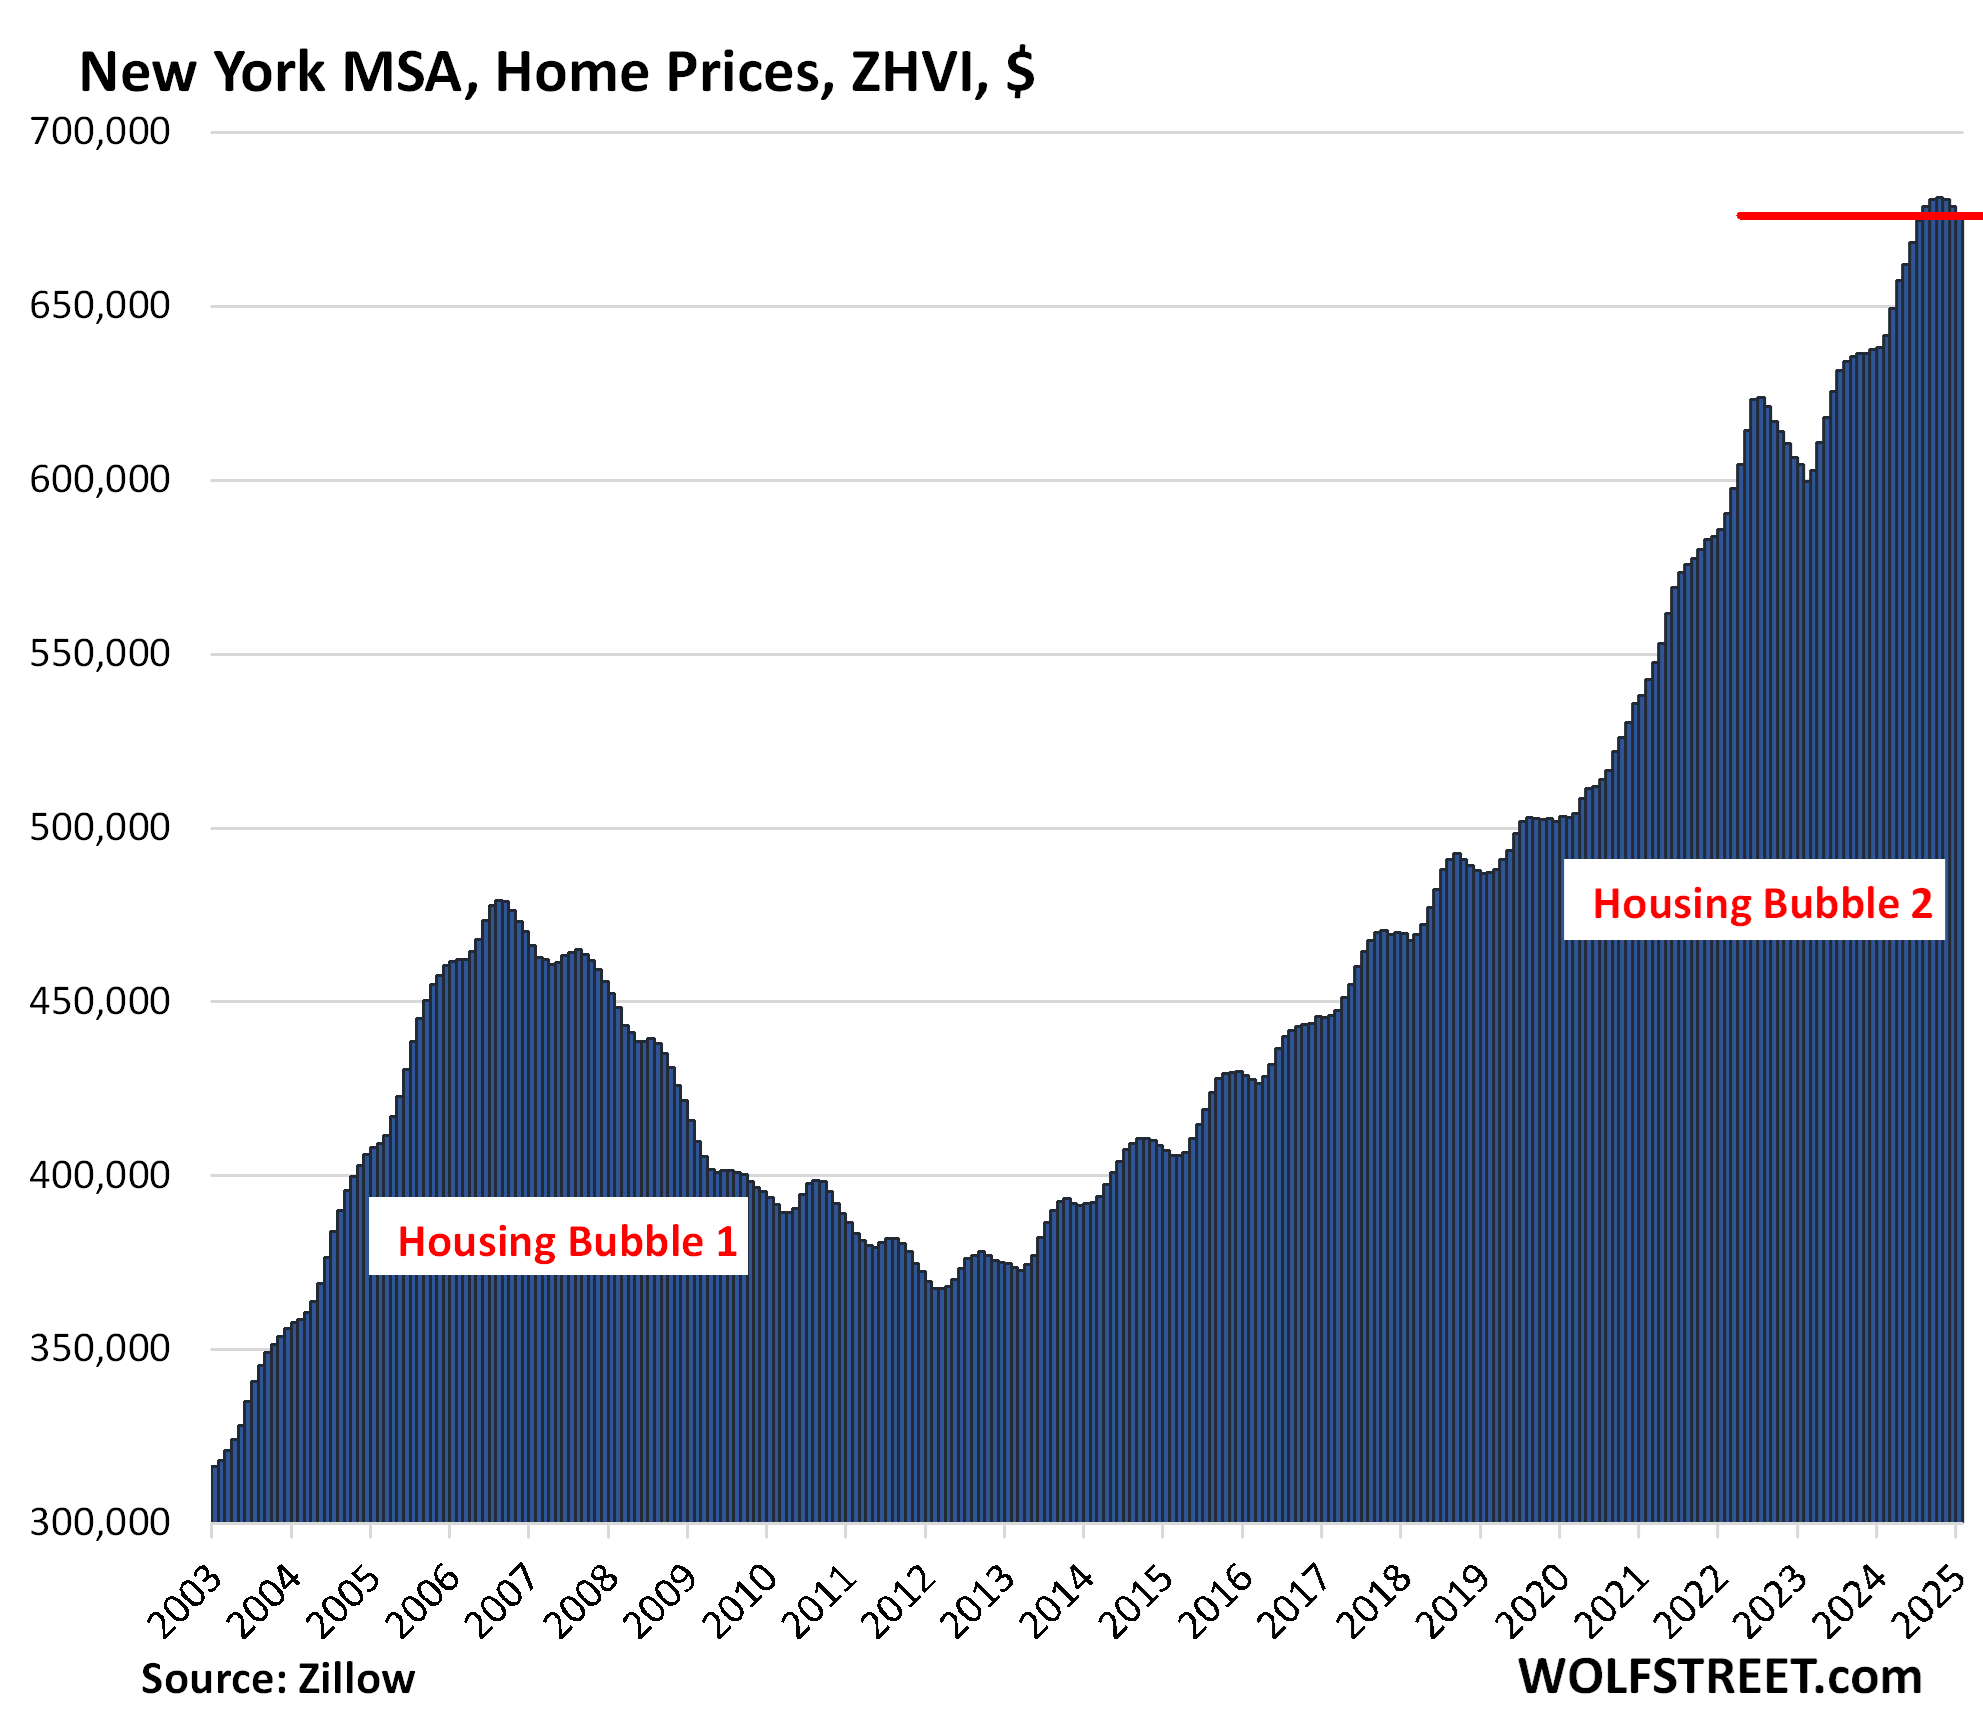
I use one of those massive data sets that is not based on a median price to depict visually the largest most expensive 33 markets – those where prices have dropped sharply since their peak in 2022 and those where prices have continued to rise, for my series, The Most Splendid Housing Bubbles in America, Jan 2025: The Price Drops & Gains in 33 of the Largest Housing Markets.
These 33 large metros are bookended by the Austin metro with the biggest drop from peak (-23% from June 2022), and by the New York metro with the biggest year-over-year gain (+6.0% yoy):

But the NAR still puts out its national median price as it has for decades.
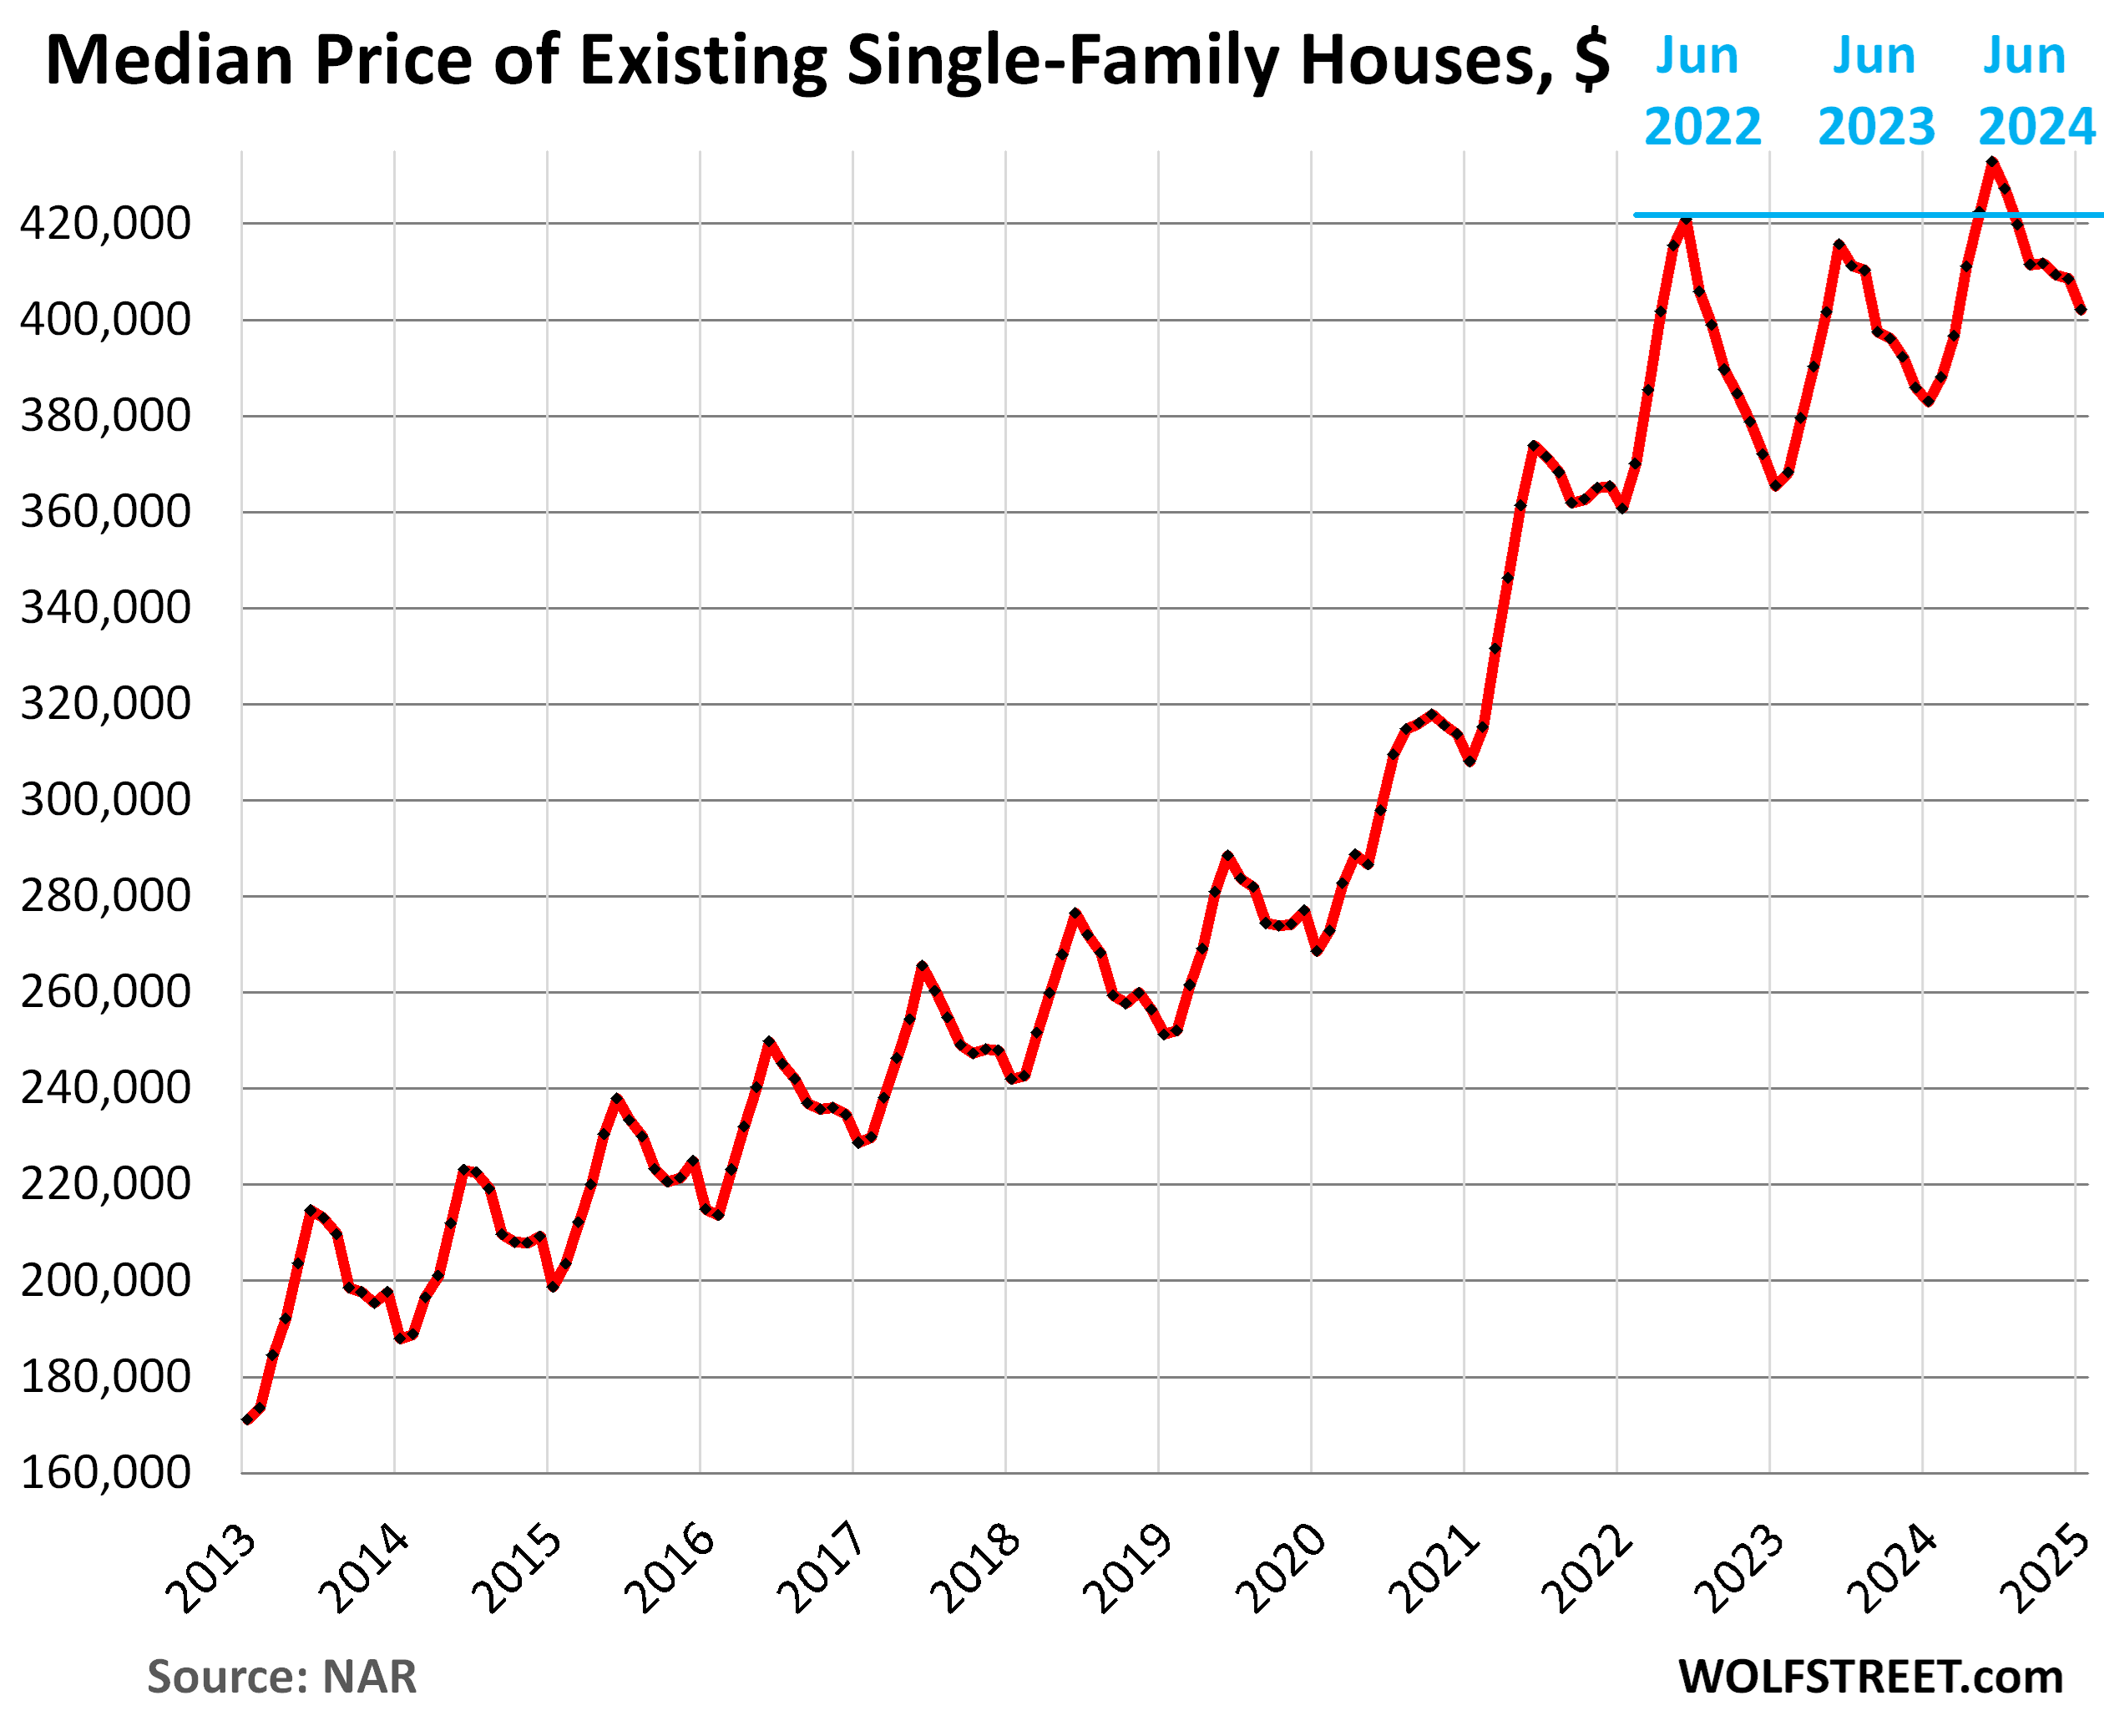
Single-family houses: In January, the national median price declined along seasonal lines to $402,000 from the downwardly revised December median price. This trimmed down the year-over-year increase to +5.0% in January, from +5.9% in December (originally reported as +6.1%).
Based on the pre-pandemic seasonality, the median price drops sharply in January, and January or February marks the seasonal low point. The high points are in June.
The 50% price explosion between June 2019 and June 2022, on top of the large price gains in the prior 10 years, was driven by the Fed’s interest-rate repression and money-printing schemes which have created the #1 problem in the housing market today, which is why demand has plunged: Prices are way too high.
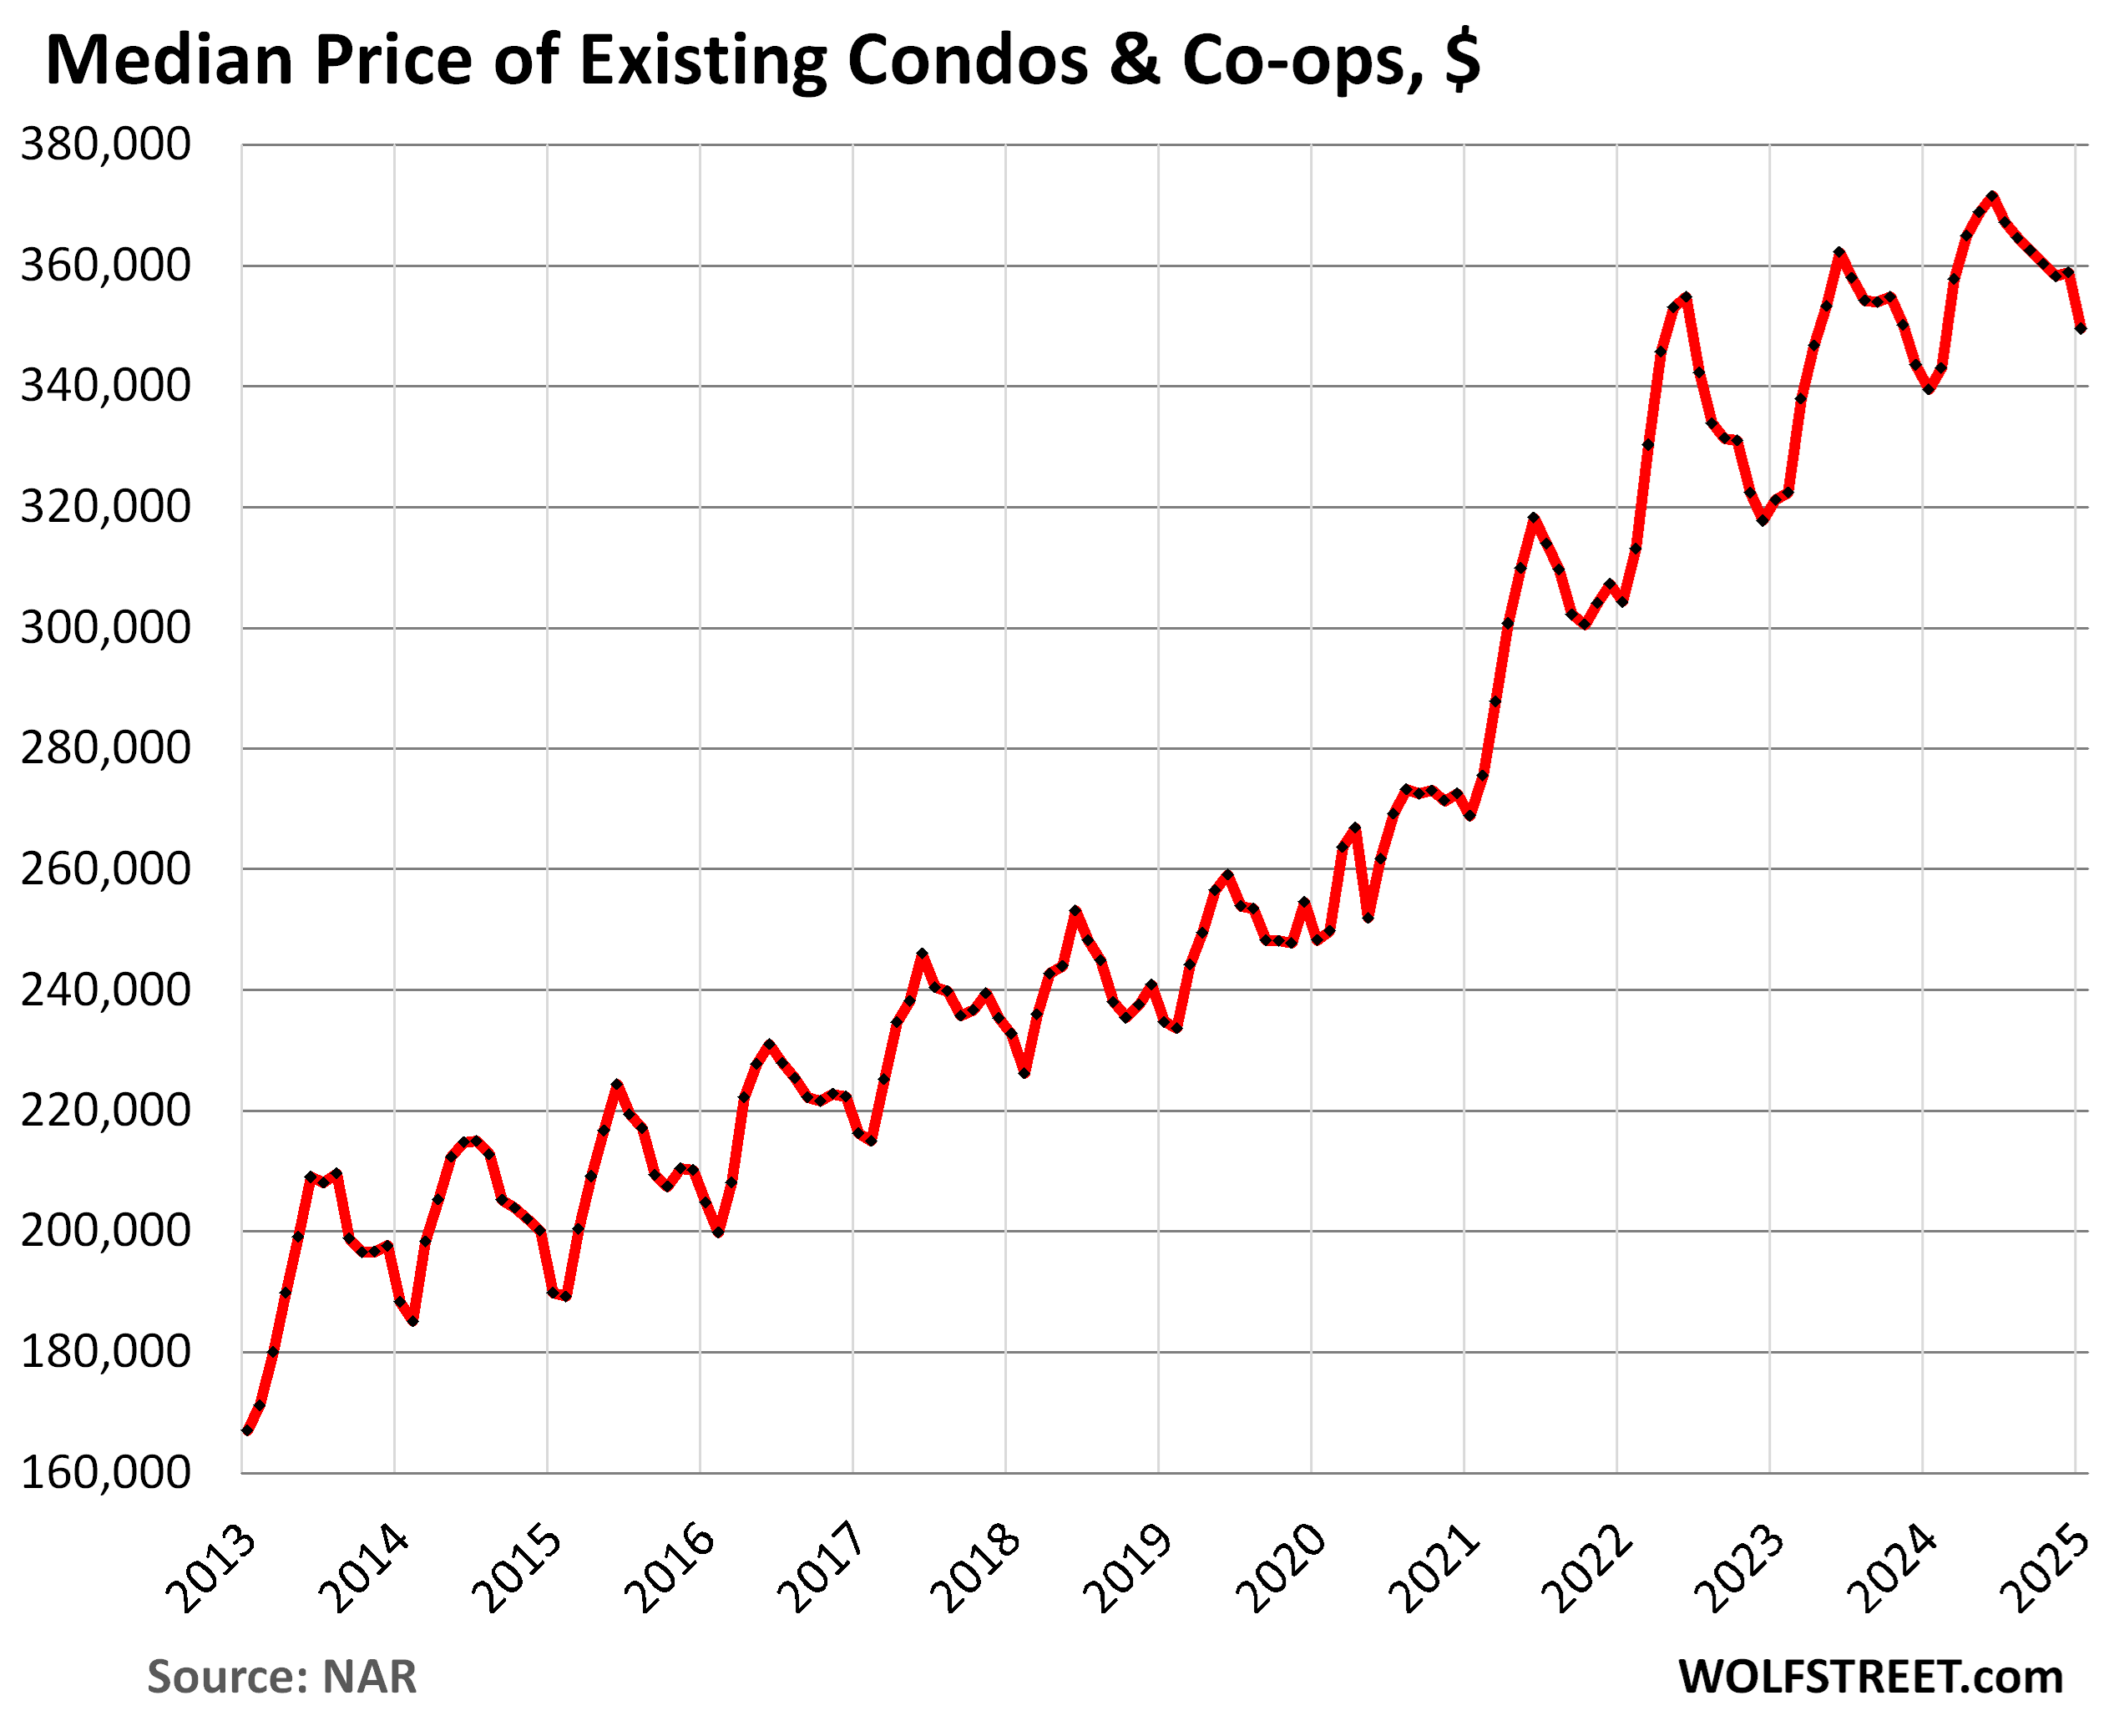
Condos and co-ops. Prices dropped by 2.9% in January from December, the biggest December-January drop since 2015, to $349,500. This drop, which was far more than the typical seasonal drop in January, cut the year-over-year gain to 2.9% in January, from 4.5% in December.
Enjoy reading WOLF STREET and want to support it? You can donate. I appreciate it immensely. Click on the mug to find out how:

![]()
The post Buyers Strike Crushes Green Shoots of Demand for Existing Homes, amid Surging Supply, Active Listings & Days on Market appeared first on Energy News Beat.
“}]]
Energy News Beat